 2010 Q4
Investor Presentation
Exhibit 99.1 |
| 2010 Q4
Investor Presentation
Exhibit 99.1 |
 2
Safe Harbor Statement
Cautionary Note About Forward-Looking Statements:
Certain statements made by us in this presentation that are not historical facts or that
relate to future plans, events or performances are forward-looking statements
that reflect management’s current outlook for future periods, including
statements regarding future financial performance. These forward-looking statements are
based upon our current expectations, and our actual results may differ materially from
those described or contemplated in the forward–looking statements. Factors
that may cause our actual results to differ materially from those contained in the
forward-looking statements, include without limitation the following: 1) national and
global economic conditions, including the impact of changes in national and global credit
markets and other changes on our customers; 2) our ability to continue to attract
and retain customers and maintain profit margins in the face of new and existing
competition; 3) new laws and regulations that could have a materially adverse
effect on our operations and financial results; 4) significant labor disturbances which
could disrupt industries we serve; 5) increased costs and collateral requirements
in connection with our insurance obligations, including workers’ compensation
insurance; 6) the adequacy of our financial reserves; 7) our continuing ability to comply
with financial covenants in our lines of credit and other financing agreements; 8) our
ability to attract and retain competent employees in key positions or to find
temporary employees to fulfill the needs of our customers; 9) our ability to
successfully complete and integrate acquisitions that we may make from time to time; and 10)
other risks described in our filings with the Securities and Exchange Commission,
including our most recent Form 10-K and Form 10-Q filings.
Use of estimates and forecasts:
Any references made to Q-4 2010 or fiscal year 2010 are based on management guidance
issued Oct. 20, 2010, and are included for informational purposes only.
These references, including any financial examples or future targets, are not an
update or reaffirmation of Oct. 20, 2010 guidance. |
 Company and
Industry Overview |
 4
Investment Highlights
Specialized approach in serving the market
Attractive industry growth prospects
Unique industry-related upside
Strong operating leverage
Multiple opportunities to increase market share
Solid balance sheet
TrueBlue™
(NYSE:TBI)
2010
Q4
Investor
Presentation |
    We make a
positive difference in the lives of people. Every day, we use our specialized
brands to find new opportunities to better serve customers and workers at
all skill levels.
5
Our vision:
Be the Leading Provider of Blue-Collar Staffing
TrueBlue™
(NYSE:TBI)
2010
Q4
Investor
Presentation |
 6
Blue-Collar Specialties
General Labor
Postions filled on-demand
Numerous workers available
Convenient community branches
Logistics & Manufacturing
Specialized skills for manufacturing & logistics
Longer term assignments and temp to perm
On-site management of employees
Skilled Trades
Skilled tradespeople for a variety of end markets
Rigorous assessment of skill and trades experience
Long-term, multiple project opportunities
Aviation Mechanics
Mechanics and technicians for aviation
In-depth screening for aviation certification
Centralized recruiting and assignment nationwide
CDL Drivers
Temporary staffing or driver management services
Comprehensive application and hiring process
24/7 central dispatch
TrueBlue™
(NYSE:TBI)
2010
Q4
Investor
Presentation |
 7
The
Leading
Provider
of
Blue-Collar
Staffing
Market
size/share
($)
2
Labor Ready
$4 billion (20%)
Spartan Staffing
$7 billion (1%)
CLP
$1 billion (10%)
PlaneTechs
$500 million (35%)
Centerline
$800 million (5%)
TrueBlue™
(NYSE:TBI) 2010 Q4 Investor Presentation
1
2010 revenue estimated for all of 2010, rounded to the nearest $5 million.
2
Staffing Industry Analysts 2010 forecast, TrueBlue
estimates.
TrueBlue™
(NYSE:TBI)
2010
Q4
Investor
Presentation
Revenues in millions ($)
1
Labor Ready: $730
Spartan Staffing: $120
CLP: $100
PlaneTechs: $145
Centerline: $40 |
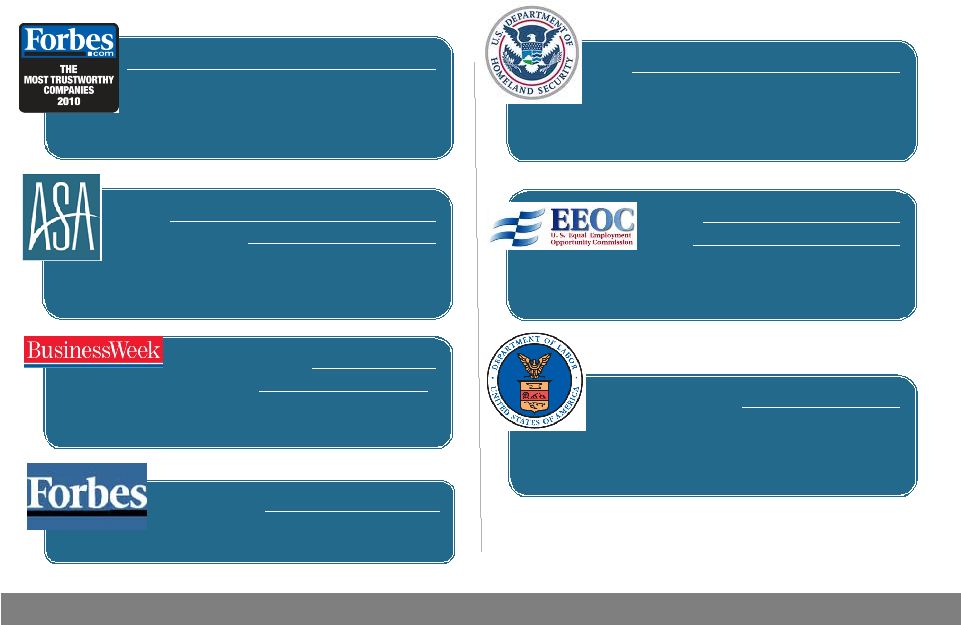 BusinessWeek
Hot Growth Company
TrueBlue
was listed on the 2007
100 Best Small Companies to Watch
List
.
Forbes Platinum 400
Forbes
magazine
named
TrueBlue
to
its
2005
list
of
the
Best
Big
Companies.
U.S. Dept. of Labor
In 2003, TrueBlue
become
the 1st
company to enter into the
DOL’s
VIP program to promote
employee fairness and safety.
Forbes Most Trustworthy Companies
In 2010, TrueBlue
received a
top score (100) for its transparency,
reliability and management
over the last 5 years.
American Staffing Association’s
“Award of Excellence”
In 2010, Labor Ready won ASA’s
highest award for its sales, safety and
worker training materials.
U.S. Dept. of Homeland Security
In 2008, TrueBlue
became the first
nationwide staffing company recognized
for its best practices by DHS/ Immigration
and Customs Enforcement.
Recognized as a Credible Industry Leader
U.S. Equal Employment
Opportunity Commission
In 2004, TrueBlue
became
the 34th
major corporation to sign the EEOC’s
National Universal Agreement to Mediate.
8
TrueBlue™
(NYSE:TBI)
2010
Q4
Investor
Presentation |
 9
Sales by Industry
Construction
37%
22%
Manufacturing
17%
19%
Transportation
9%
12%
Wholesale Trade
10%
9%
Retail
8%
7%
Services & Other
19%
15%
Aviation
0%
16%
2006
2010* * 2010 industry percentages are for the trailing four quarters
ended Q3 2010. TrueBlue™
(NYSE:TBI)
2010
Q4
Investor
Presentation |
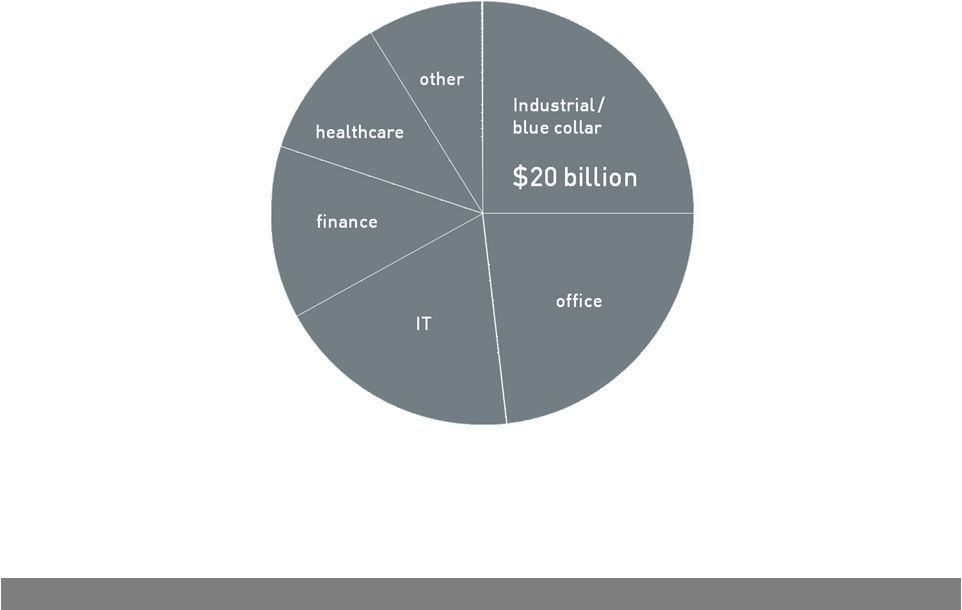 10
Temporary Staffing
$75 billion
Staffing Industry Analysts 2010 forecast, rounded
TrueBlue™
(NYSE:TBI)
2010
Q4
Investor
Presentation |
 2010
Market 11
$20B
2015 Market Forecast
$30B
Blue-collar Staffing –
Strong Future Growth
Source: Staffing Industry Analysts, Moody’s economic forecasts, TrueBlue
estimates
TrueBlue™
(NYSE:TBI)
2010
Q4
Investor
Presentation |
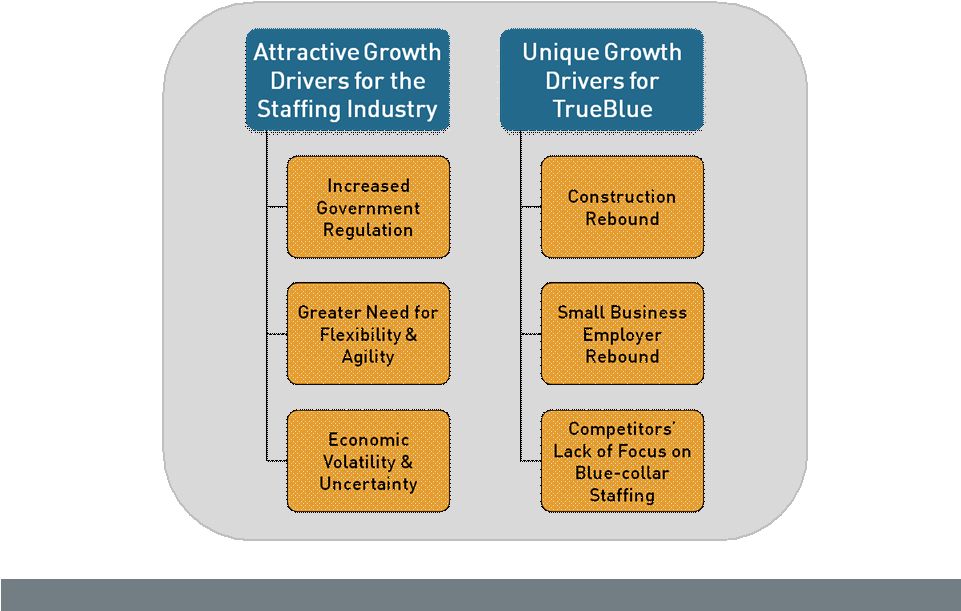 12
Industry Growth Drivers
TrueBlue™
(NYSE:TBI)
2010
Q4
Investor
Presentation |
 13
Strategic Priorities
Focus
Why
How
Same
Branch
Growth
+++
Operating
Leverage
Brand Specialization
Brand Leadership
Intra-brand Industry Specialization
Service Excellence
Geographic
Expansion
+
Increase
Market
Share
On-site Locations
Multi-Brand Locations
Acquisitions
TrueBlue™
(NYSE:TBI)
2010
Q4
Investor
Presentation |
 14
Operating Leverage of Same Branch Growth
Same branch growth = 20% incremental operating margins
*
Example calculation of incremental operating margins:
Incremental Revenue
100
$
Gross Profit Generated
27
$
Variable Operating Expense
Associated with Incremental Revenue
(7)
$
Incremental Operating Income
20
$
*
Reflects an approximation of the incremental operating margin that
management believes can
be achieved, in general,
with the current business model
and revenue mix.
TrueBlue™
(NYSE:TBI)
2010
Q4
Investor
Presentation |
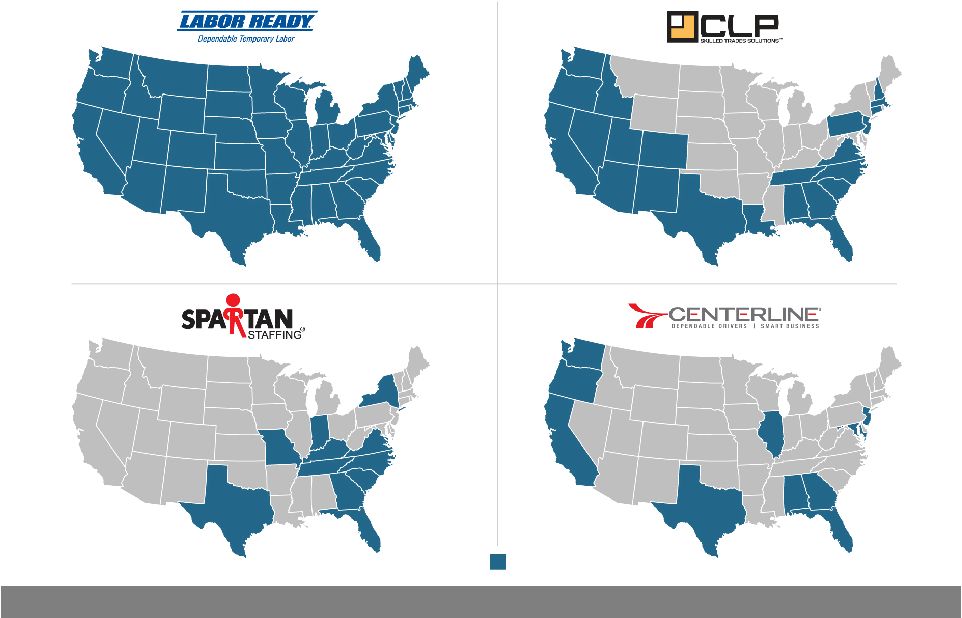 Geographic
Expansion Opportunities 15
Existing markets
TrueBlue™
(NYSE:TBI)
2010
Q4
Investor
Presentation |
  16
Strategic Acquisitions
Qualitative Factors
Quantitative Factors
•
Blue-collar
•
Existing market tuck-ins
•
New geographic markets
•
Cultural alignment
•
Return on investment
•
Financing
TrueBlue™
(NYSE:TBI)
2010
Q4
Investor
Presentation |
 Financial
Review |
   18
Financial Targets
Revenue
Growth
Market
>
EBITDA
%
7%
>
EBITDA is non-GAAP financial measure which excludes interest, taxes,
depreciation and amortization from net income. EBITDA is a key measure used by management in
evaluating performance. EBITDA should not be considered a measure of financial
performance in isolation or as an alternative to net income (loss) in the Statement of
Operations in accordance with GAAP, and, as presented, may not be comparable to
similarly titled measures of other companies. TrueBlue™
(NYSE:TBI)
2010
Q4
Investor
Presentation |
 19
Financial Summary
**
2010E
includes
53rd
week
which
is
estimated
to
add
approximately
1%
to
revenue
growth.
*EBITDA is non-GAAP financial measure which excludes interest, taxes,
depreciation and amortization from net income. EBITDA is a key measure used
by management in evaluating performance. EBITDA should not be considered a measure
of financial performance in isolation or as an alternative to net income
(loss) in the Statement of Operations in accordance with GAAP, and, as presented, may not be comparable to similarly titled measures of other
companies. See EBITDA reconciliation in the Appendix.
2010F **
2009
Growth %
Revenue
$1,135
$1,018
11%
Gross profit
$ 300
$ 291
3%
% of Revenue
26.4%
28.6%
SG&A expense
$ 255
$ 262
-3%
% of Revenue
22.5%
25.8%
EBITDA*
$ 45
$ 29
55%
% of Revenue
4.0%
2.8%
Net income
$ 20
$ 9
122%
% of Revenue
1.8%
0.9%
Earnings per share
$ 0.46
$ 0.20
129%
TrueBlue™
(NYSE:TBI)
2010
Q4
Investor
Presentation |
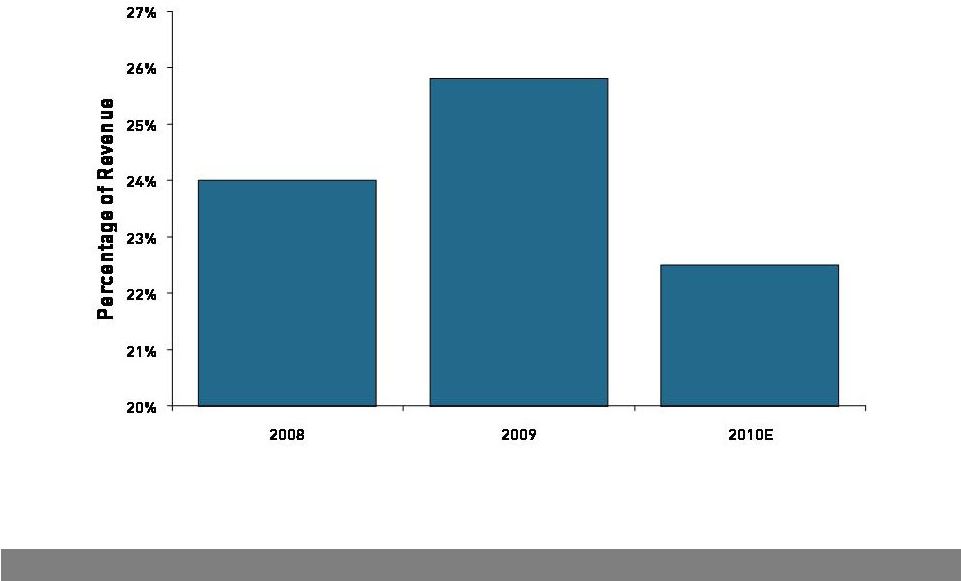 Selling, General & Administrative Costs
20
2008 excludes goodwill and intangible asset impairment charges.
TrueBlue™
(NYSE:TBI)
2010
Q4
Investor
Presentation |
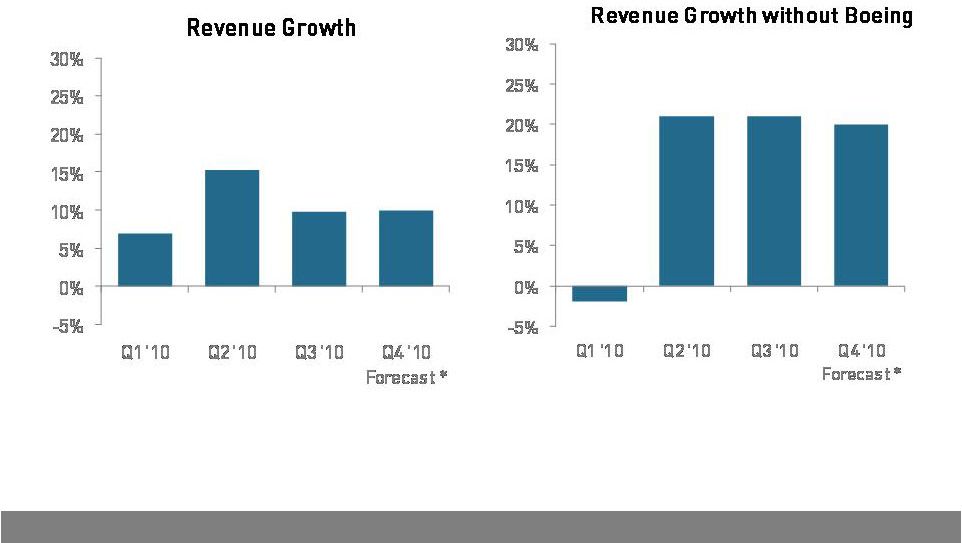 21
2010 Revenue Growth Trends
*
Q4
2010
Revenue
Growth
Forecast
excludes
14th
week
for
comparative
purposes.
TrueBlue™
(NYSE:TBI)
2010
Q4
Investor
Presentation |
 22
Strong Balance Sheet
Cash and investments
$139
$124
Current ratio
3.3
2.9
Restricted cash
$118
$124
Workers’
comp reserve
$190
$190
Long-term debt
$ 3
$ 3
Shareholders’
equity
$306
$285
Q-3
2010
FY
2009
$ in millions.
TrueBlue™
(NYSE:TBI)
2010
Q4
Investor
Presentation |
 23
Investment Highlights
Specialized approach in serving the market
Attractive industry growth prospects
Unique industry-related upside
Strong operating leverage
Multiple opportunities to increase market share
Solid balance sheet
TrueBlue™
(NYSE:TBI)
2010
Q4
Investor
Presentation |
 Appendix |
 25
0
200
400
600
800
1,000
1,200
1,400
1,600
1996
1997
1998
1999
2000
2001
2002
2003
2004
2005
2006
2007
2008
2009
2010F
0
10
20
30
40
50
60
70
80
90
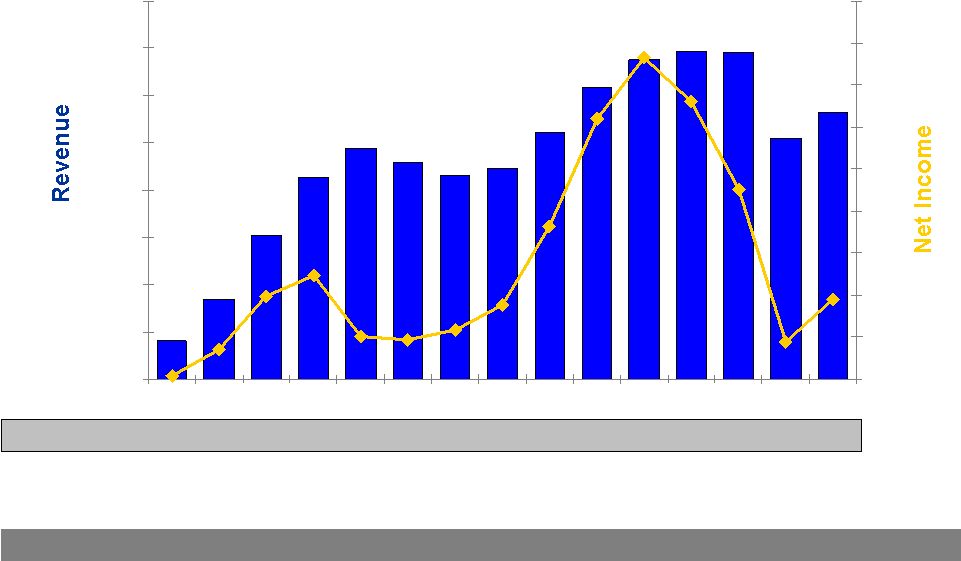
Historical Summary
Annual Revenue and Net Income
in $M
in $M
No. of Branches
200 316 486
687 816 756 748 779 815
887 912 894
850 754 725 2008 excludes goodwill and
intangible asset impairment charges. TrueBlue™
(NYSE:TBI)
2010
Q4
Investor
Presentation |
 26
Reconciliation of EBITDA to Net Income
*EBITDA is
non-GAAP financial measure which excludes interest, taxes, depreciation and amortization from net income. EBITDA is a key
measure used by management in evaluating performance. EBITDA should not be
considered a measure of financial performance in isolation or as an
alternative to net income (loss) in the Statement of Operations in accordance with GAAP, and, as presented, may not be
comparable to similarly titled measures of other companies.
2010F
2009
Net income
$ 20
$ 9
Income tax expense
10
5
Income before tax expense
30
14
Interest and other income, net
(1)
(2)
Income from operations
29
12
Depreciation & Amortization
16
17
EBITDA*
$ 45
$ 29
TrueBlue™
(NYSE:TBI) 2010 Q4 Investor Presentation
|