
Exhibit 99.1
Exhibit 99.1
2010 Q1 Investor Presentation
Safe Harbor Statement
Cautionary Note About Forward-Looking Statements:
Certain statements made by us in this presentation that are not historical facts or that relate to future plans, events or performances are forward-looking statements within the meaning of the federal securities laws. Our actual results may differ materially from those expressed in any forward-looking statements made by us. Forward-looking statements involve a number of risks and uncertainties including, but not limited to, the risks described in the Company’s most recent 10-K and 10-Q filings. All forward-looking statements are qualified by those risk factors.
Use of estimates and forecasts:
Any references made to Q-1 2010 and fiscal year 2010 are based on management guidance issued Feb. 3, 2010 and are included for illustrative purposes, and are not deemed an update or reaffirmation of Feb. 3, 2010 guidance.

Company and Industry Overview

Investment Highlights
Leader in blue-collar staffing
Poised to benefit from economic recovery Attractive long-term industry growth prospects Strong operating leverage New growth platforms and diversification
TrueBlue™ | 2010 Q1 Investor Presentation
4
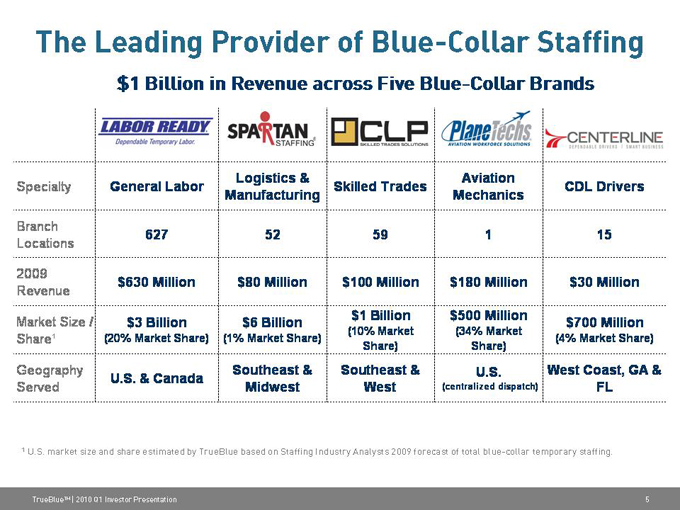
The Leading Provider of Blue-Collar Staffing
$1 Billion in Revenue across Five Blue-Collar Brands
Logistics & Aviation
Specialty General Labor Skilled Trades CDL Drivers
Manufacturing Mechanics
Branch
Locations 627 52 59 1 15
2009
Revenue $630 Million $80 Million $100 Million $180 Million $30 Million
Market Size / $3 Billion $6 Billion $1 Billion $500 Million $700 Million
(10% Market Share) (34% Market Share)
Share1 (20% Market Share) (1% Market Share) (4% Market Share)
Geography Southeast & Southeast & U.S. West Coast, GA &
U.S. & Canada
Served Midwest West (centralized dispatch) FL
1 U.S. market size and share estimated by TrueBlue based on Staffing Industry Analysts 2009 forecast of total blue-collar temporary staffing.
TrueBlue™ | 2010 Q1 Investor Presentation 5
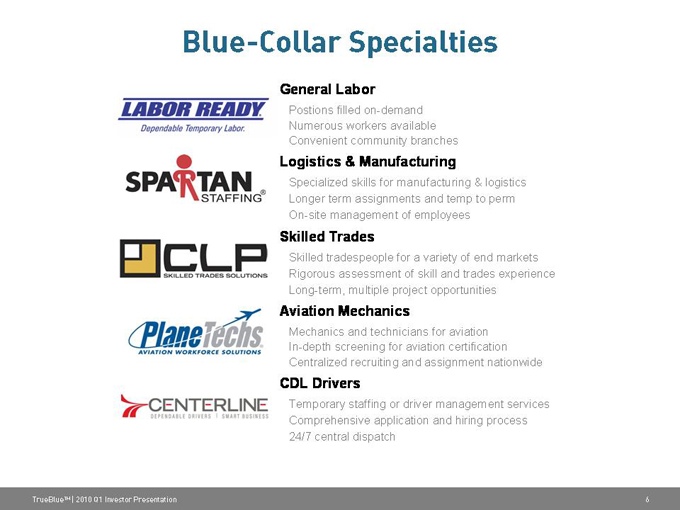
Blue-Collar Specialties
General Labor
Postions filled on-demand Numerous workers available Convenient community branches
Logistics & Manufacturing
Specialized skills for manufacturing & logistics Longer term assignments and temp to perm On-site management of employees
Skilled Trades
Skilled tradespeople for a variety of end markets Rigorous assessment of skill and trades experience Long-term, multiple project opportunities
Aviation Mechanics
Mechanics and technicians for aviation In-depth screening for aviation certification Centralized recruiting and assignment nationwide
CDL Drivers
Temporary staffing or driver management services Comprehensive application and hiring process 24/7 central dispatch
TrueBlue™ | 2010 Q1 Investor Presentation 6
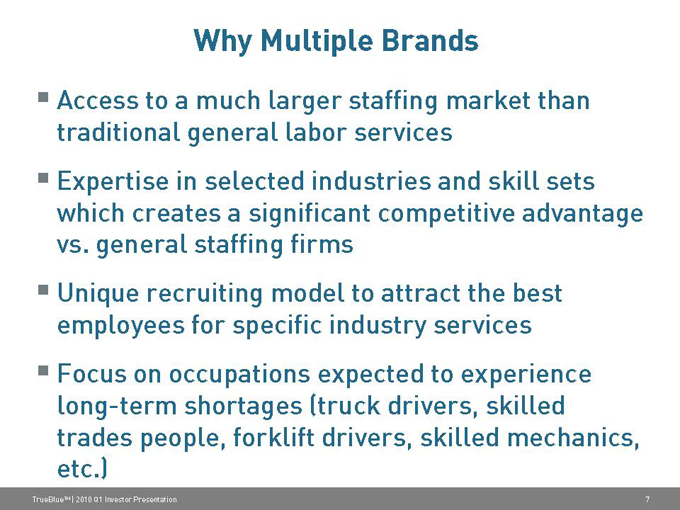
Why Multiple Brands
Access to a much larger staffing market than traditional general labor services Expertise in selected industries and skill sets which creates a significant competitive advantage vs. general staffing firms Unique recruiting model to attract the best employees for specific industry services Focus on occupations expected to experience long-term shortages (truck drivers, skilled trades people, forklift drivers, skilled mechanics, etc.)
TrueBlue™ | 2010 Q1 Investor Presentation
7
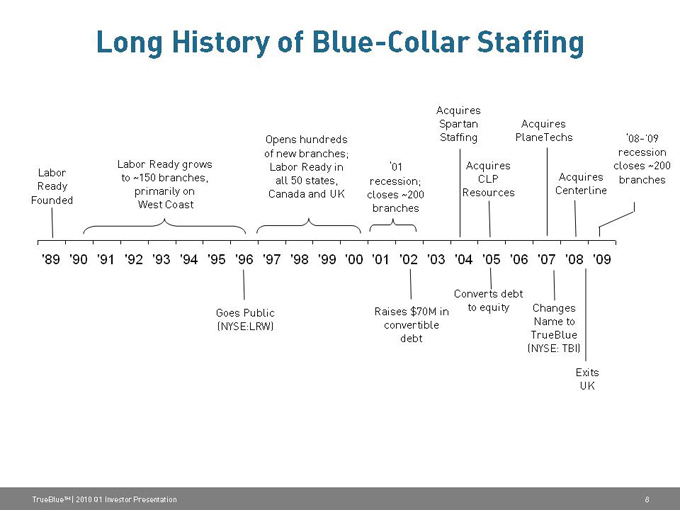
Long History of Blue-Collar Staffing
Acquires
Spartan Acquires
Opens hundreds Staffing PlaneTechs ‘08-’09
of new branches; recession
Labor Ready grows Labor Ready in ‘01 Acquires closes ~200
Labor to ~150 branches, all 50 states, recession; CLP Acquires branches
Ready primarily on Canada and UK closes ~200 Resources Centerline
Founded West Coast branches
‘89 ‘90 ‘91 ‘92 ‘93 ‘94 ‘95 ‘96 ‘97 ‘98 ‘99 ‘00 ‘01 ‘02 ‘03 ‘04 ‘05 ‘06 ‘07 ‘08 ‘09
Converts debt
Goes Public Raises $70M in to equity Changes
(NYSE:LRW) convertible Name to
debt TrueBlue
(NYSE: TBI)
Exits
UK
TrueBlue™ | 2010 Q1 Investor Presentation
8
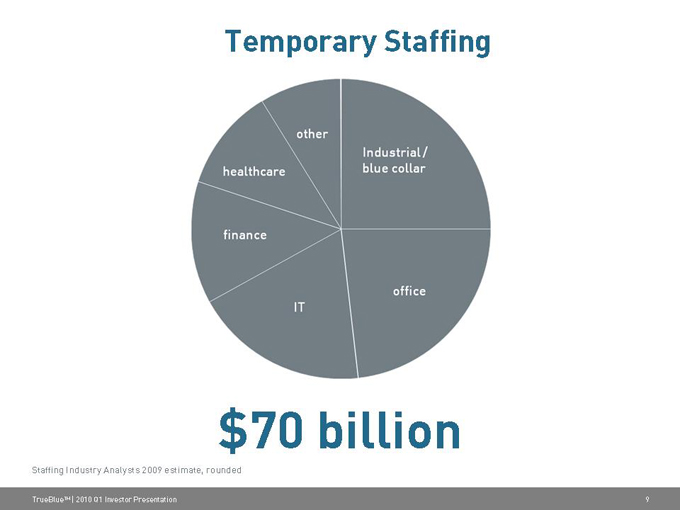
Temporary Staffing
$70 billion
Staffing Industry Analysts 2009 estimate, rounded
other
Industrial/blue collar
office
IT
finance
healthcare
TrueBlue™ | 2010 Q1 Investor Presentation 9
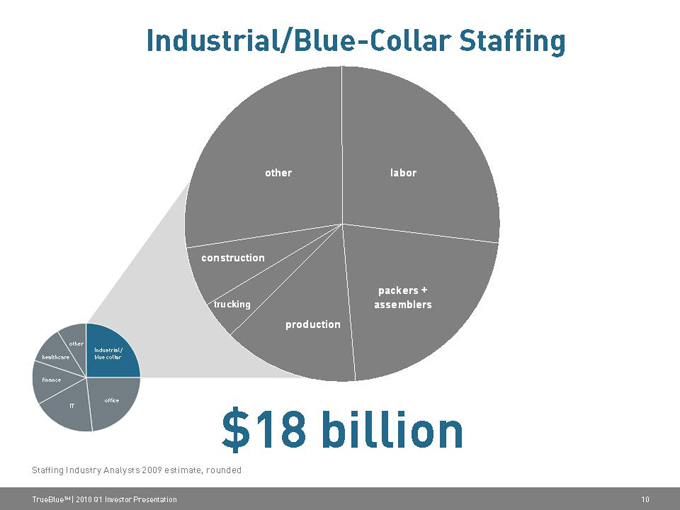
Industrial/Blue-Collar Staffing
other labor
construction
packers + trucking assemblers production
other
Industrial / healthcare blue collar
finance
IT office $18 billion
Staffing Industry Analysts 2009 estimate, rounded
TrueBlue™ | 2010 Q1 Investor Presentation 10
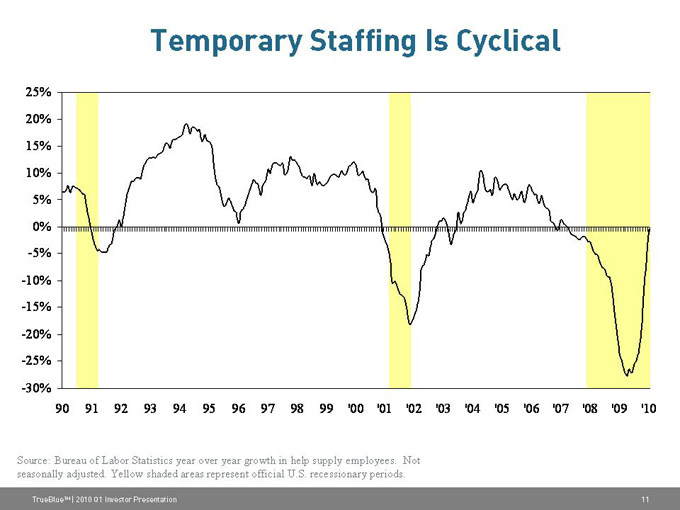
Temporary Staffing Is Cyclical
25% 20% 15% 10% 5% 0% -5% -10% -15% -20% -25% -30%
90 91 92 93 94 95 96 97 98 99 ‘00 ‘01 ‘02 ‘03 ‘04 ‘05 ‘06 ‘07 ‘08 ‘09 ‘10
Source: Bureau of Labor Statistics year over year growth in help supply employees. Not seasonally adjusted. Yellow shaded areas represent official U.S. recessionary periods.
TrueBlue™ | 2010 Q1 Investor Presentation
11
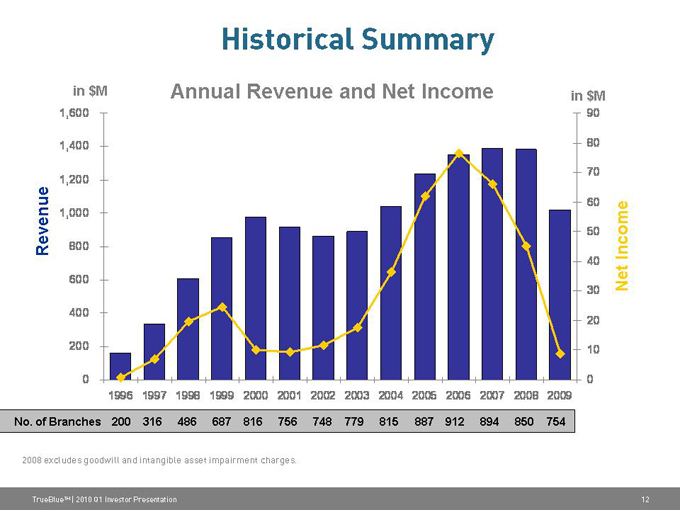
Historical Summary
in $M Annual Revenue and Net Income in $M
1,600 90
1,400 80 70 1,200 1,000 60 50
Revenue 800 Income
40 600 30 Net 400 20
200 10
0 0 1996 1997 1998 1999 2000 2001 2002 2003 2004 2005 2006 2007 2008 2009
No. of Branches 200 316 486 687 816 756 748 779 815 887 912 894 850 754
2008 excludes goodwill and intangible asset impairment charges.
TrueBlue™ | 2010 Q1 Investor Presentation
12

Recent & Potential Staffing Industry Trends
Temporary help penetration rate improved to 1.5%* in January 2010 versus 1.3%* in October 2009.
Layoffs and economic uncertainty may create an increase in the temporary help penetration rate peak of 2%* in the last cycle. Recent revenue trends for most industrial staffing companies have outperformed trends in other lines of staffing.
Purchasing Managers’ Index improved to 58 in January 2010 – this marked 6 consecutive months above 50 and the highest rating since October 2005.
Weakened balance sheets may eliminate competitors or spur consolidation presenting market share gains for surviving firms.
* Source: BLS
TrueBlue™ | 2010 Q1 Investor Presentation
13

Strategies for Growth
Operating Leverage of Existing Branch Network Same-branch revenue growth Cost controls Geographic Expansion Strategic Acquisitions
TrueBlue™ | 2010 Q1 Investor Presentation
14
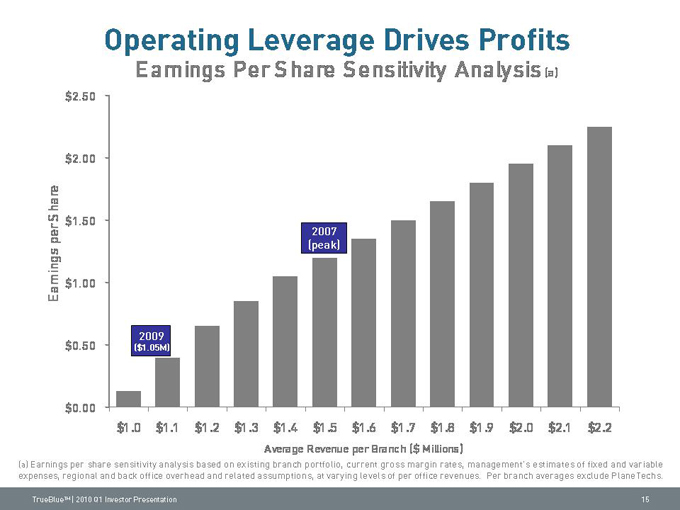
Operating Leverage Drives Profits
Earnings Per Share Sensitivity Analysis (a)
$2.50
$2.00
Share $1.50 per 2007 (peak)
Earnings $1.00
2009
$0.50 ($1.05M)
$0.00 $1.0 $1.1 $1.2 $1.3 $1.4 $1.5 $1.6 $1.7 $1.8 $1.9 $2.0 $2.1 $2.2 Average Revenue per Branch ($ Millions)
(a) Earnings per share sensitivity analysis based on existing branch portfolio, current gross margin rates, management’s estimates of fixed and variable expenses, regional and back office overhead and related assumptions, at varying levels of per office revenues. Per branch averages exclude PlaneTechs.
TrueBlue™ | 2010 Q1 Investor Presentation
15
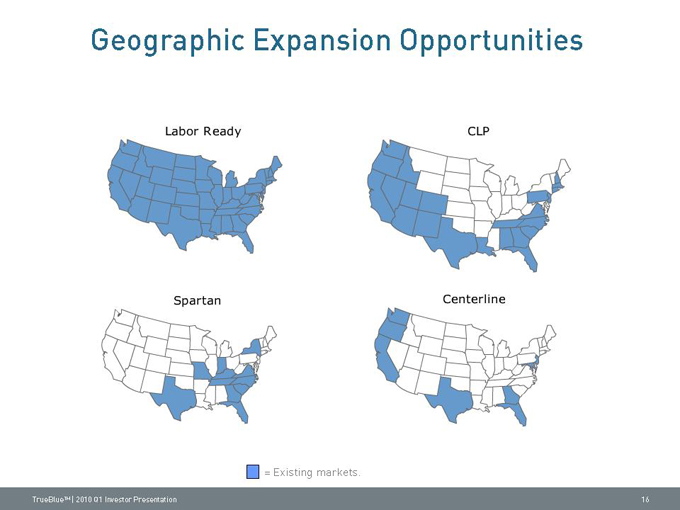
Geographic Expansion Opportunities
= Existing markets.
TrueBlue™ | 2010 Q1 Investor Presentation
Labor Ready
CLP
Spartan
Centerline
16
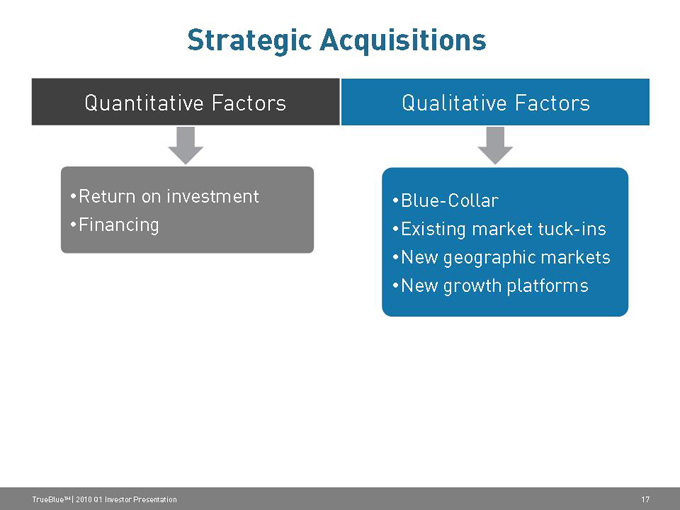
Strategic Acquisitions
Quantitative Factors Qualitative Factors
Return on investment Blue-Collar
Financing Existing market tuck-ins New geographic markets New growth platforms
TrueBlue™ | 2010 Q1 Investor Presentation
17

Financial Review
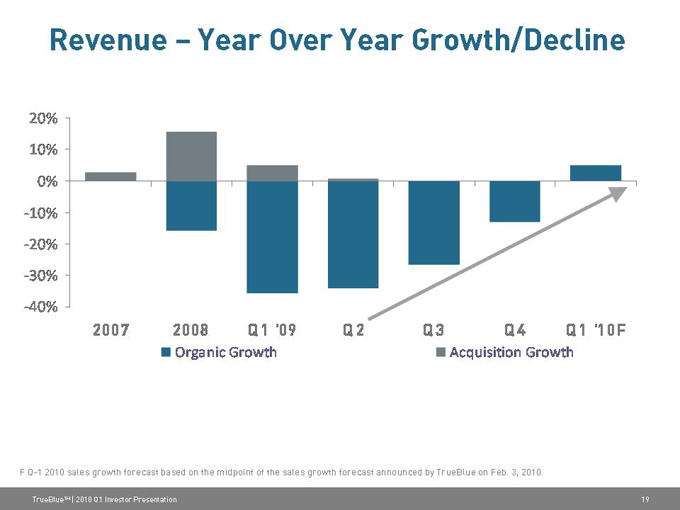
Revenue – Year Over Year Growth/Decline
20% 10% 0% -10% -20% -30% -40%
2007 2008 Q1 ‘09 Q2 Q3 Q4 Q1 ‘10F
Organic Growth Acquisition Growth
F Q-1 2010 sales growth forecast based on the midpoint of the sales growth forecast announced by TrueBlue on Feb. 3, 2010.
TrueBlue™ | 2010 Q1 Investor Presentation
19
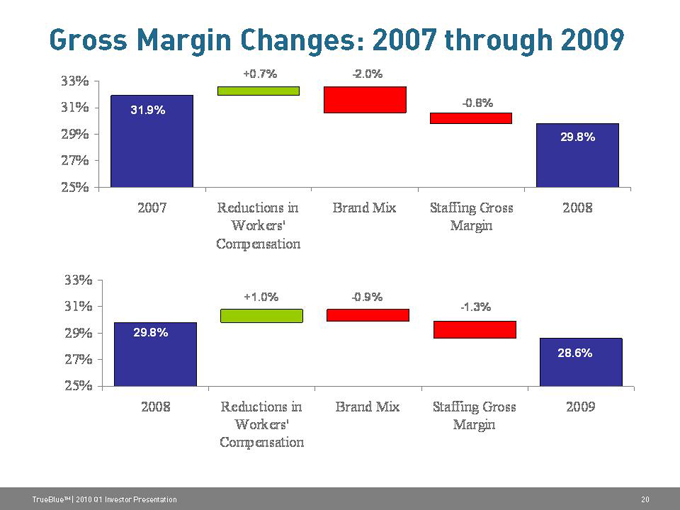
Gross Margin Changes: 2007 through 2009
33% +0.7% -2.0%
31% -0.8% 31.9%
29% 29.8%
27% 25%
2007 Reductions in Brand Mix Staffing Gross 2008 Workers’ Margin Compensation
33%
+1.0% -0.9%
31% -1.3% 29% 29.8%
27% 28.6%
25%
2008 Reductions in Brand Mix Staffing Gross 2009 Workers’ Margin Compensation
TrueBlue™ | 2010 Q1 Investor Presentation
20
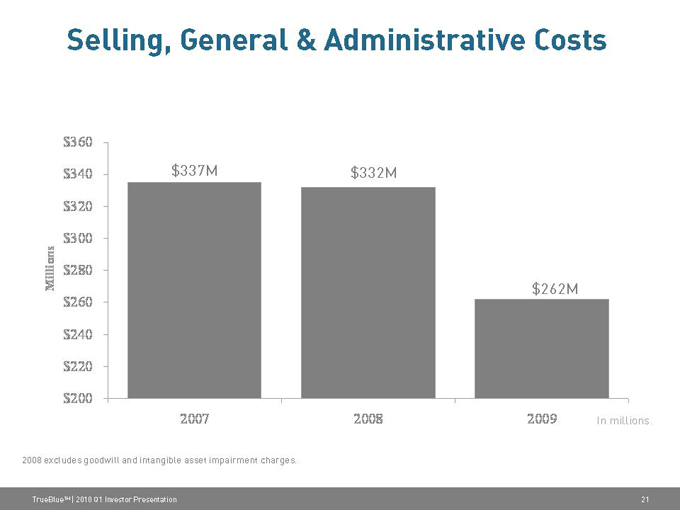
Selling, General & Administrative Costs
$360 $340 $337M $332M $320
$300
Millions $280
$260 $262M $240
$220
$200
2007 2008 2009 In millions.
2008 excludes goodwill and intangible asset impairment charges.
TrueBlue™ | 2010 Q1 Investor Presentation
21
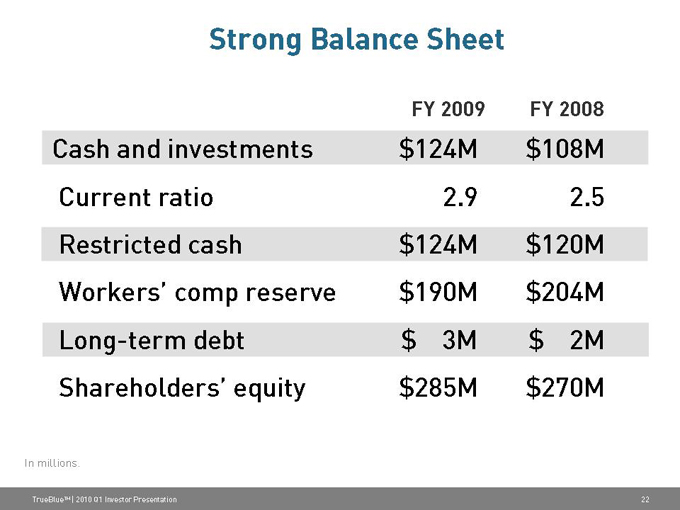
Strong Balance Sheet
FY 2009 FY 2008
Cash and investments $124M $108M
Current ratio 2.9 2.5
Restricted cash $124M $120M
Workers’ comp reserve $190M $204M
Long-term debt $ 3M $ 2M
Shareholders’ equity $285M $270M
In millions.
TrueBlue™ | 2010 Q1 Investor Presentation
22
Investment Highlights
Leader in blue-collar staffing
Poised to benefit from economic recovery Attractive long-term industry growth prospects Strong operating leverage New growth platforms and diversification
TrueBlue™ | 2010 Q1 Investor Presentation
23