Exhibit 99.1
|
|
THE LEADER IN BLUE-COLLAR STAFFING |
Exhibit 99.1
|
|
THE LEADER IN BLUE-COLLAR STAFFING |
|
|
Safe Harbor Statement Cautionary Note About Forward-Looking Statements: Certain statements made by us in this presentation that are not historical facts or that relate to future plans, events or performances are forward-looking statements within the meaning of the federal securities laws. Our actual results may differ materially from those expressed in any forwardlooking statements made by us. Forward-looking statements involve a number of risks and uncertainties including, but not limited to, the risks described in the Company’s most recent 10-K and 10-Q filings. All forward-looking statements are qualified by those risk factors. 2 TrueBlue™ | 2008 Annual Meeting |
|
|
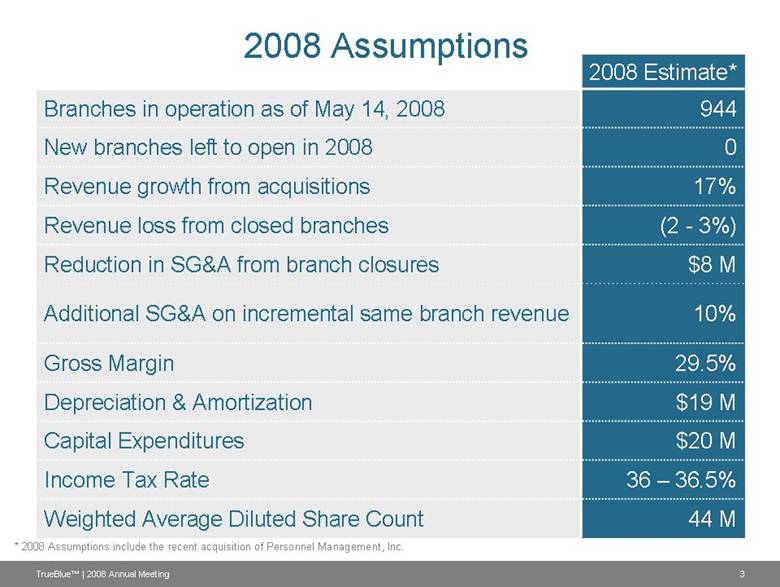
2008 Assumptions 2008 Estimate* Branches in operation as of May 14, 2008 944 New branches left to open in 2008 0 Revenue growth from acquisitions 17% Revenue loss from closed branches (2 - 3%) Reduction in SG&A from branch closures $8 M Additional SG&A on incremental same branch revenue 10% Gross Margin 29.5% Depreciation & Amortization $19 M Capital Expenditures $20 M Income Tax Rate 36 – 36.5% Weighted Average Diluted Share Count 44 M * 2008 Assumptions include the recent acquisition of Personnel Management, Inc. 3 TrueBlue™ | 2008 Annual Meeting |
|
|
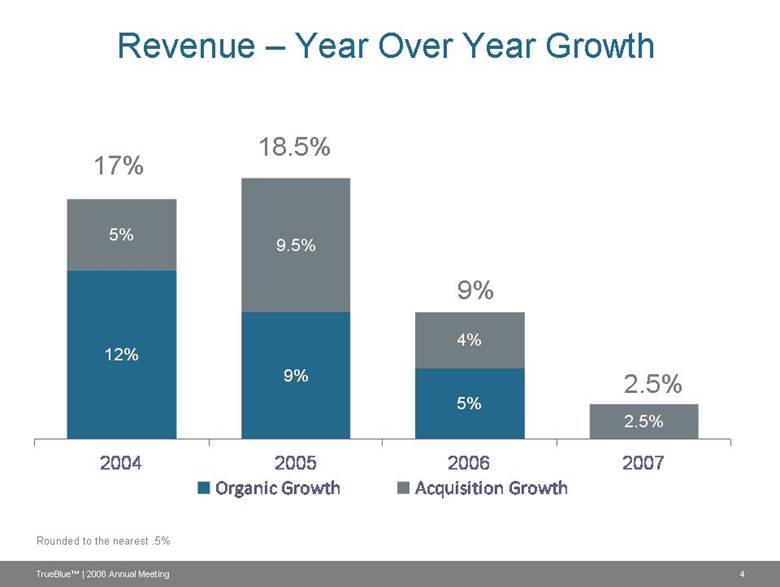
Revenue – Year Over Year Growth 12% 9% 5% 5% 9.5% 4% 2.5% 2004 2005 2006 2007 Organic Growth Acquisition Growth 17% 18.5% 9% 2.5% Rounded to the nearest .5% 4 TrueBlue™ | 2008 Annual Meeting |
|
|
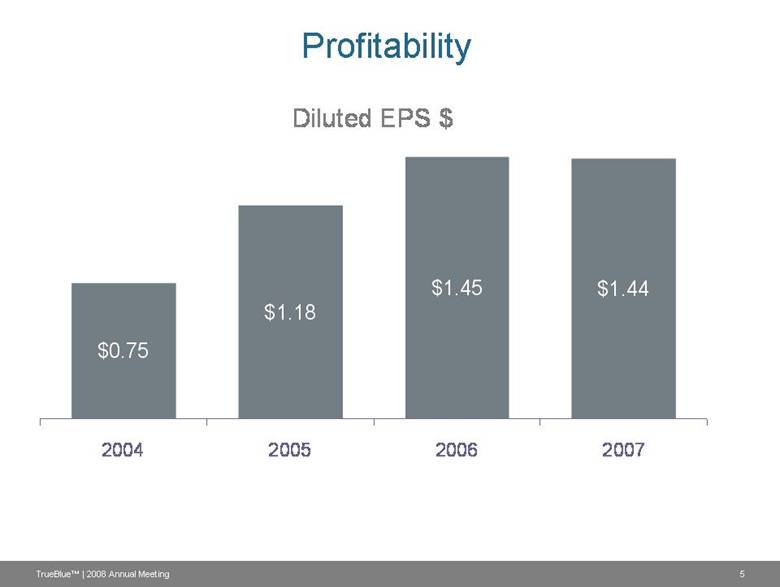
Profitability Diluted EPS $ $0.75 $1.18 $1.45 $1.44 2004 2005 2006 2007 5 TrueBlue™ | 2008 Annual Meeting |
|
|
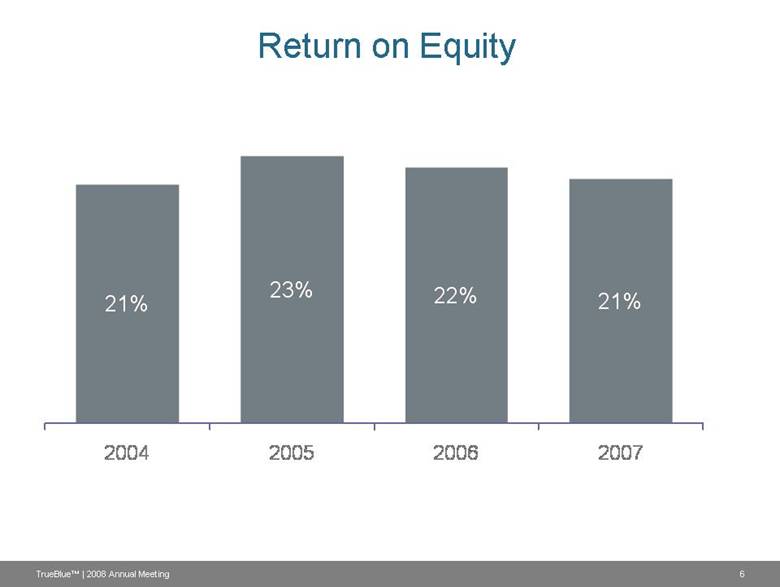
Return on Equity 21% 23% 22% 21% 2004 2005 2006 2007 6 TrueBlue™ | 2008 Annual Meeting |
|
|
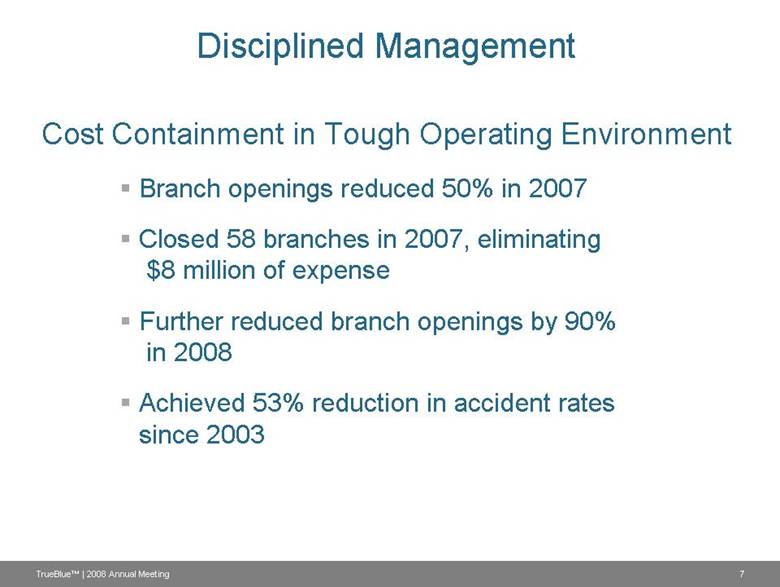
Disciplined Management Cost Containment in Tough Operating Environment Branch openings reduced 50% in 2007 Closed 58 branches in 2007, eliminating $8 million of expense Further reduced branch openings by 90% in 2008 Achieved 53% reduction in accident rates since 2003 7 TrueBlue™ | 2008 Annual Meeting |
|
|
Increasing Shareholder Value TrueBlue™ | 2008 Annual Meeting 8 Continued Diversification $100 Million Invested in Strategic Acquisitions in 2007 and 2008 Share Repurchase $239 Million Returned to Shareholders through Share Repurchases since 2006 |
|
|
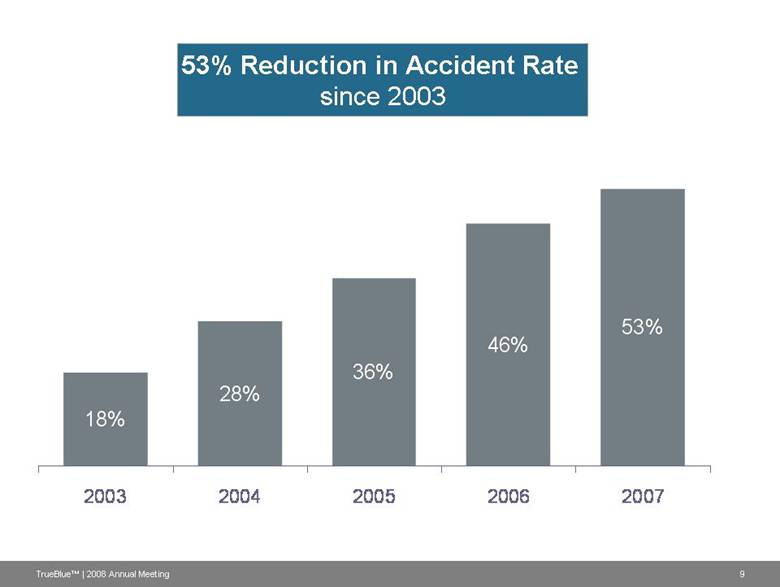
53% Reduction in Accident Rate since 2003 9 TrueBlue™ | 2008 Annual Meeting 18% 28% 36% 46% 53% 2003 2004 2005 2006 2007 |
|
|
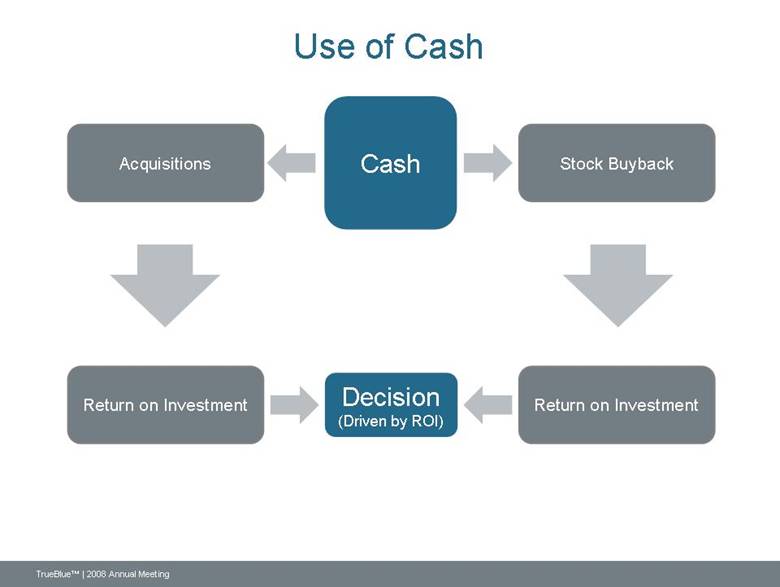
Use of Cash Cash Acquisitions Stock Buyback Return on Investment Return on Investment Decision (Driven by ROI) TrueBlue™ | 2008 Annual Meeting |
|
|
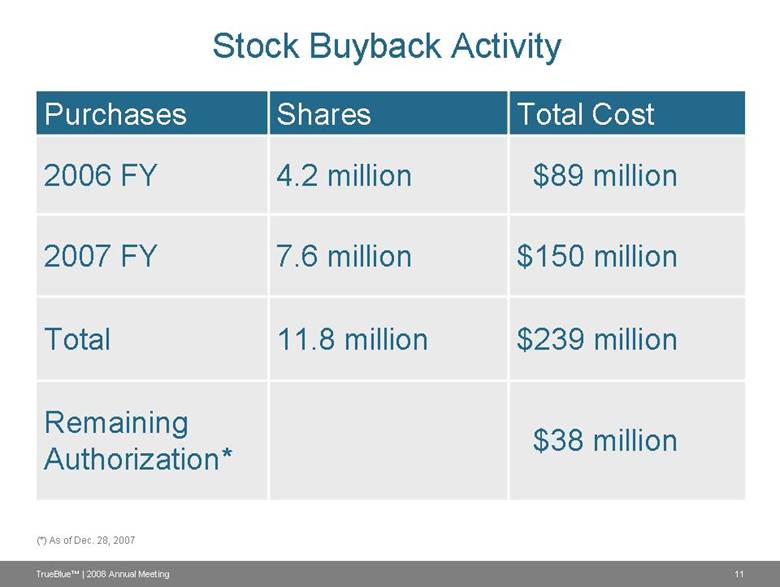
Stock Buyback Activity Purchases Shares Total Cost 2006 FY 4.2 million $89 million 2007 FY 7.6 million $150 million Total 11.8 million $239 million Remaining Authorization* $38 million (*) As of Dec. 28, 2007 11 TrueBlue™ | 2008 Annual Meeting |
|
|
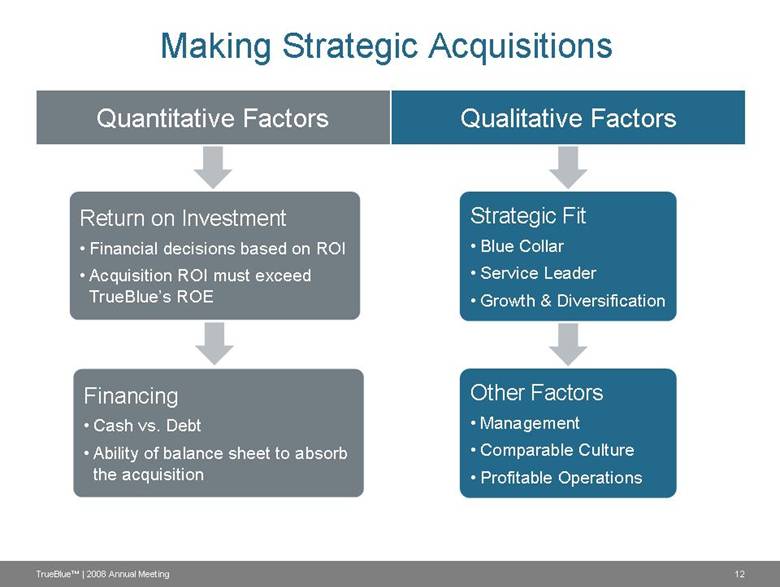
Making Strategic Acquisitions Qualitative Factors Quantitative Factors Other Factors Management Comparable Culture Profitable Operations Strategic Fit Blue Collar Service Leader Growth & Diversification Return on Investment Financial decisions based on ROI Acquisition ROI must exceed TrueBlue’s ROE Financing Cash vs. Debt Ability of balance sheet to absorb the acquisition 12 TrueBlue™ | 2008 Annual Meeting |
|
|
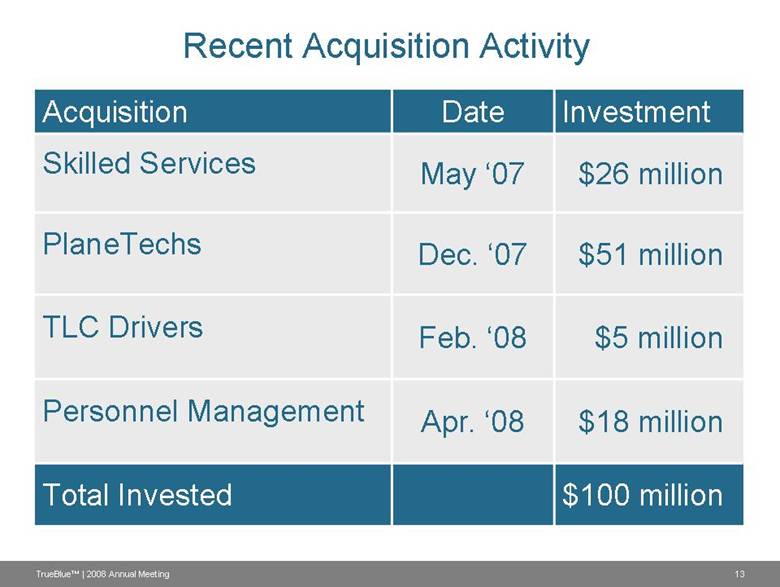
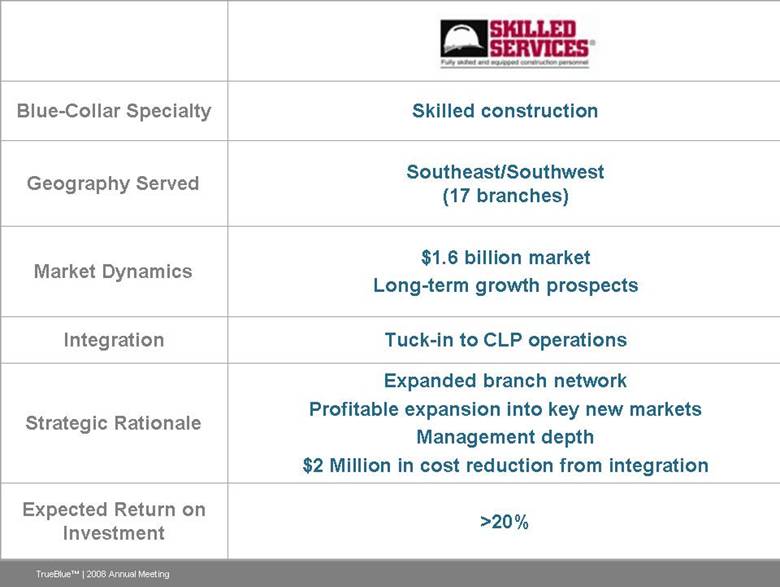
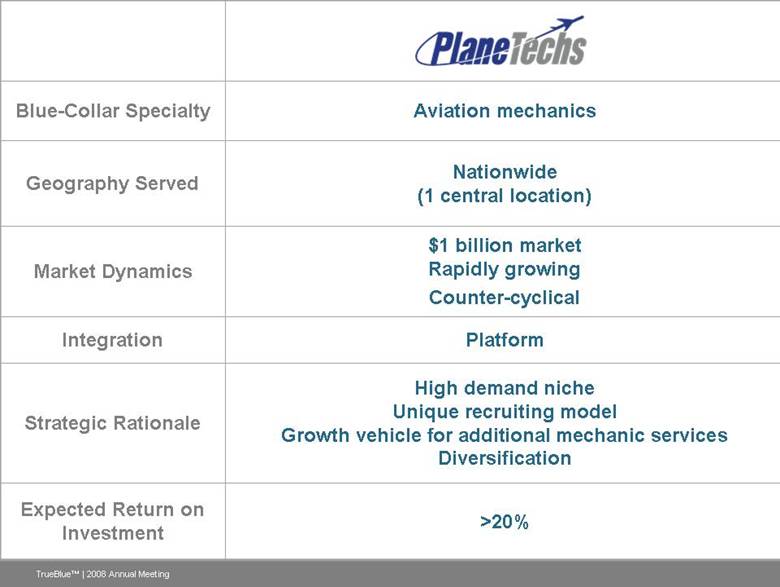
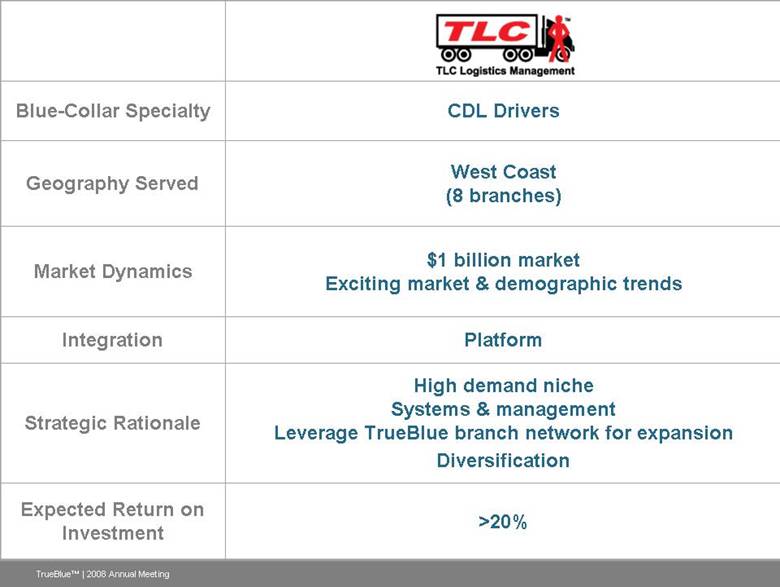
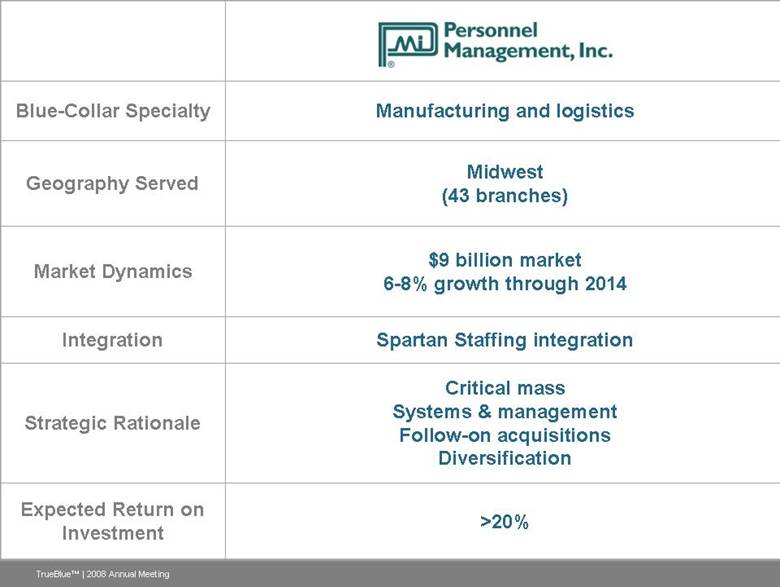
Recent Acquisition Activity Acquisition Date Investment Skilled Services May ‘07 $26 million PlaneTechs Dec. ‘07 $51 million TLC Drivers Feb. ‘08 $5 million Personnel Management Apr. ‘08 $18 million Total Invested $100 million 13 TrueBlue™ | 2008 Annual Meeting |
|
|
Blue-Collar Specialty Skilled construction Geography Served Southeast/Southwest (17 branches) Market Dynamics $1.6 billion market Long-term growth prospects Integration Tuck-in to CLP operations Strategic Rationale Expanded branch network Profitable expansion into key new markets Management depth $2 Million in cost reduction from integration Expected Return on Investment >20% TrueBlue™ | 2008 Annual Meeting |
|
|
Blue-Collar Specialty Aviation mechanics Geography Served Nationwide (1 central location) Market Dynamics $1 billion market Rapidly growing Counter-cyclical Integration Platform Strategic Rationale High demand niche Unique recruiting model Growth vehicle for additional mechanic services Diversification Expected Return on Investment >20% TrueBlue™ | 2008 Annual Meeting |
|
|
Blue-Collar Specialty CDL Drivers Geography Served West Coast (8 branches) Market Dynamics $1 billion market Exciting market & demographic trends Integration Platform Strategic Rationale High demand niche Systems & management Leverage TrueBlue branch network for expansion Diversification Expected Return on Investment >20% TrueBlue™ | 2008 Annual Meeting |
|
|
Blue-Collar Specialty Manufacturing and logistics Geography Served Midwest (43 branches) Market Dynamics $9 billion market 6-8% growth through 2014 Integration Spartan Staffing integration Strategic Rationale Critical mass Systems & management Follow-on acquisitions Diversification Expected Return on Investment >20% TrueBlue™ | 2008 Annual Meeting |
|
|
TrueBlue™ | 2008 Annual Meeting 18 Rounded to nearest five percent. Today’s business mix incorporates completed acquisitions for a full year. Acquisitions Create Shareholder Value Profitable entry to new blue-collar markets Management depth Best practice sharing Attractive investment returns Diversification and smoothing of cyclicality |
|
|
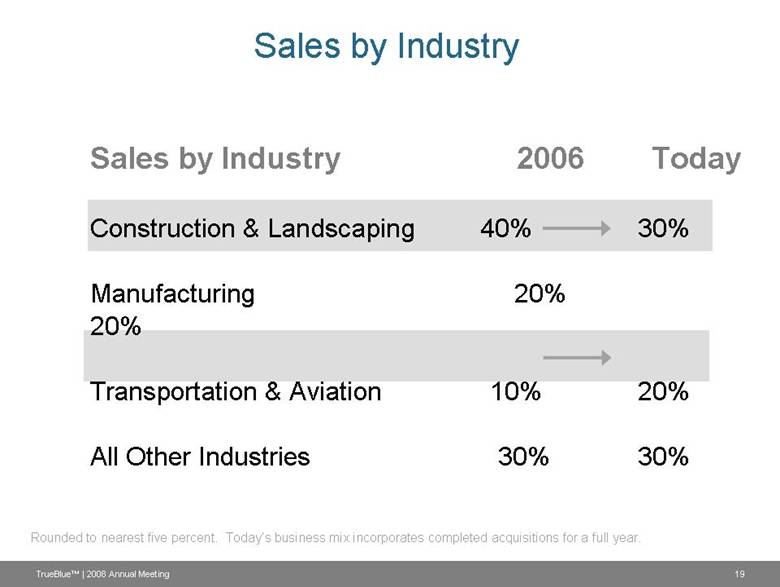
TrueBlue™ | 2008 Annual Meeting 19 Rounded to nearest five percent. Today’s business mix incorporates completed acquisitions for a full year. Sales by Industry Sales by Industry 2006 Today Construction & Landscaping 40% 30% Manufacturing 20% 20% Transportation & Aviation 10% 20% All Other Industries 30% 30% |
|
|
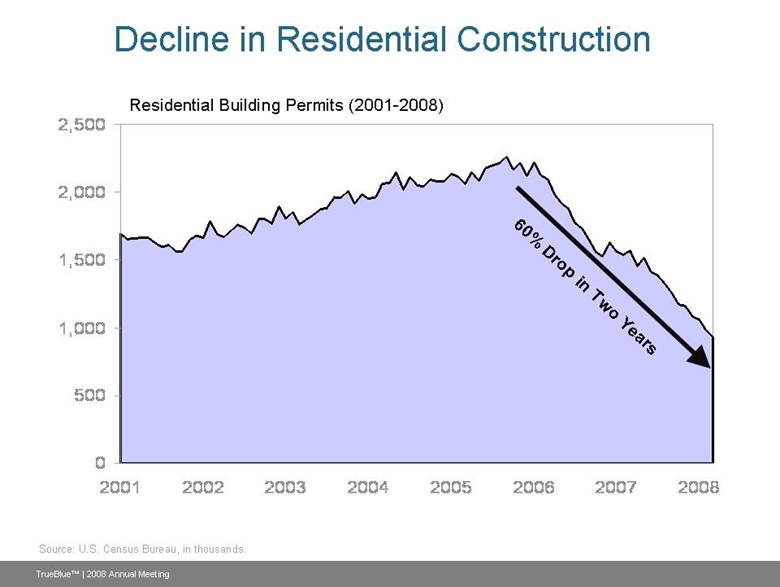
0 500 1,000 1,500 2,000 2,500 2001 2002 2003 2004 2005 2006 2007 2008 Residential Building Permits (2001-2008) Source: U.S. Census Bureau, in thousands. Decline in Residential Construction 60% Drop in Two Years TrueBlue™ | 2008 Annual Meeting |
|
|
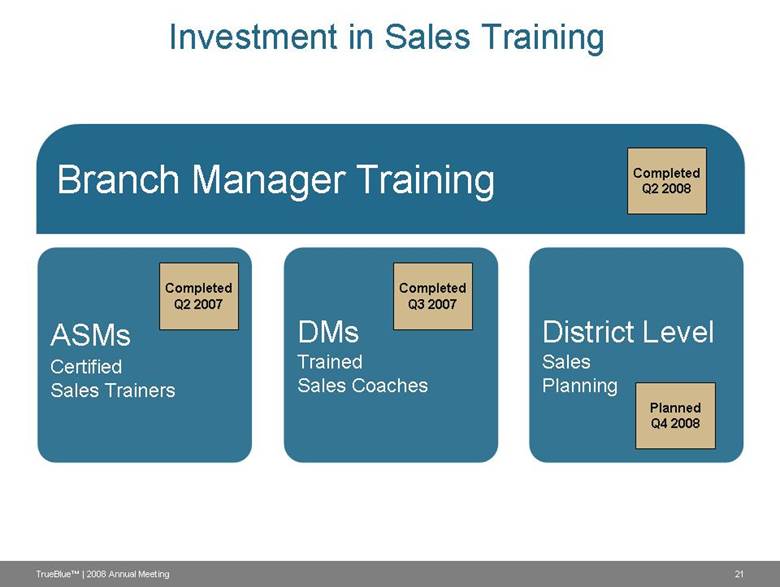
Investment in Sales Training TrueBlue™ | 2008 Annual Meeting 21 DMs Trained Sales Coaches District Level Sales Planning ASMs Certified Sales Trainers Branch Manager Training Completed Q2 2007 Completed Q3 2007 Completed Q2 2008 Planned Q4 2008 |
|
|
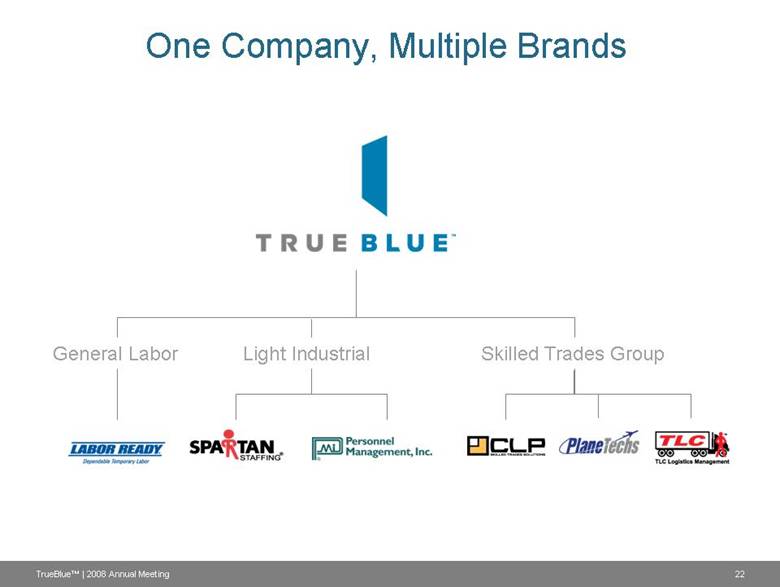
One Company, Multiple Brands 22 TrueBlue™ | 2008 Annual Meeting General Labor Light Industrial Skilled Trades Group |
|
|
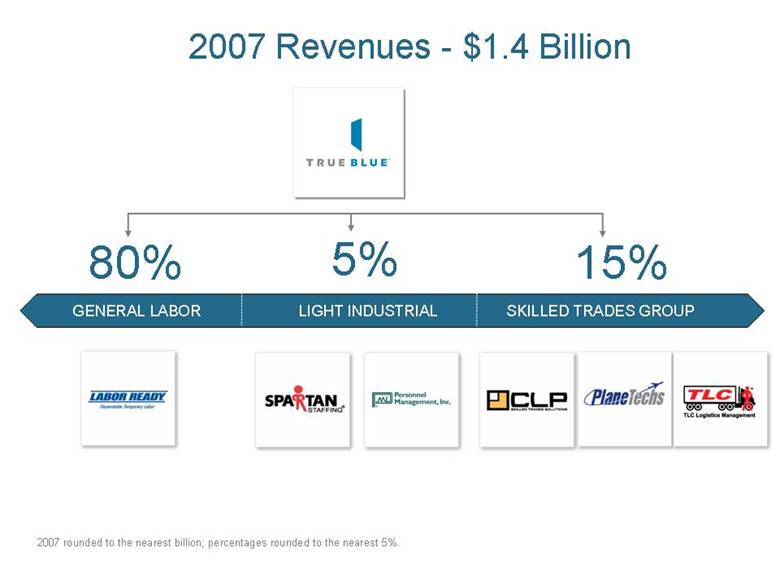
2007 Revenues - $1.4 Billion TrueBlue™ | 2008 Annual Meeting 23 GENERAL LABOR LIGHT INDUSTRIAL SKILLED TRADES GROUP 80% 5% 15% 2007 rounded to the nearest billion; percentages rounded to the nearest 5%. |
|
|
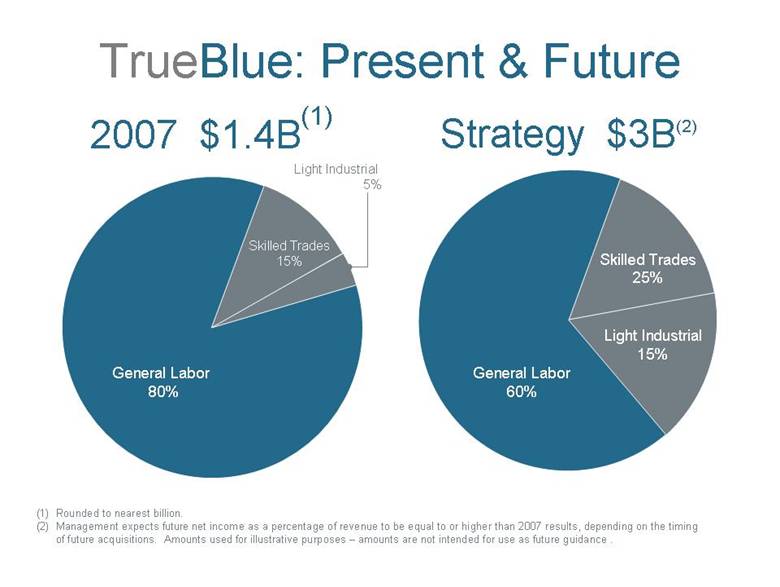
2007 $1.4B(1) General Labor 80% Light Industrial 5% Skilled Trades 15% General Labor 60% Skilled Trades 25% Light Industrial 15% Strategy $3B(2) TrueBlue: Present & Future TrueBlue™ | 2008 Annual Meeting 24 (1) Rounded to nearest billion. (2) Management expects future net income as a percentage of revenue to be equal to or higher than 2007 results, depending on the timing of future acquisitions. Amounts used for illustrative purposes – amounts are not intended for use as future guidance . |
|
|
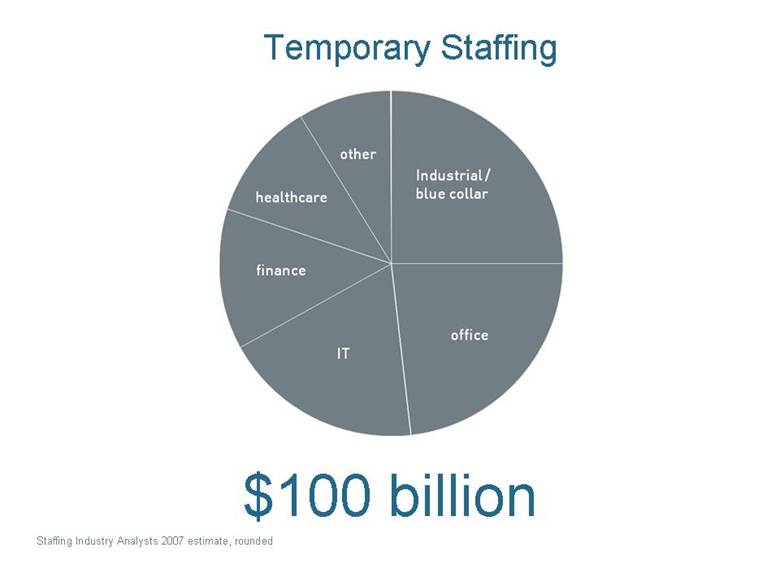
Temporary Staffing TrueBlue™ | 2008 Annual Meeting 25 $100 billion Staffing Industry Analysts 2007 estimate, rounded Industrial/blue collar office IT finance healthcare other |
|
|
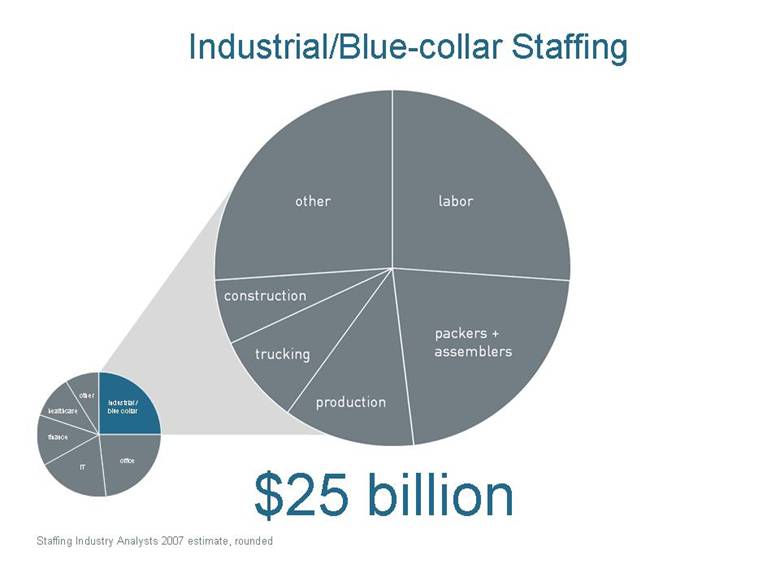
other finance healthcare office IT Industrial / blue collar Industrial/Blue-collar Staffing TrueBlue™ | 2008 Annual Meeting 26 other finance healthcare office IT Industrial / blue collar Staffing Industry Analysts 2007 estimate, rounded $25 billion construction trucking production packers + assemblers |
|
|
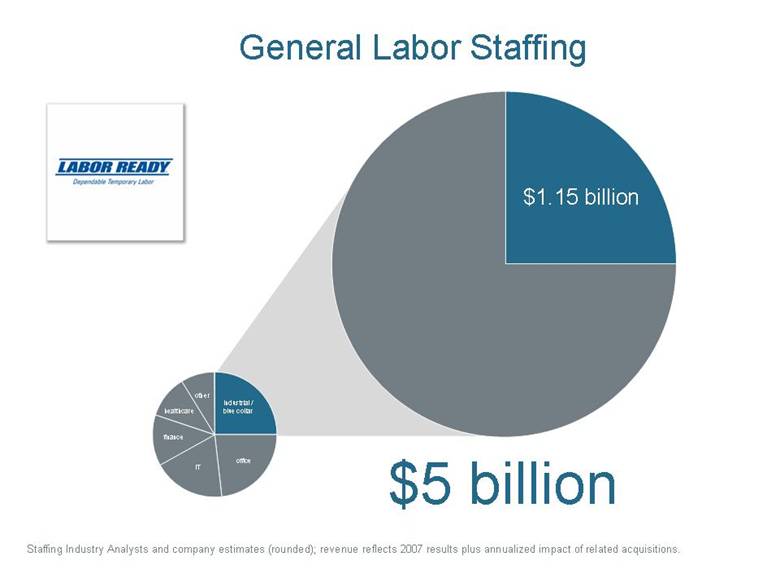
other finance healthcare office IT Industrial / blue collar General Labor Staffing $5 billion $1.15 billion Staffing Industry Analysts and company estimates (rounded); revenue reflects 2007 results plus annualized impact of related acquisitions. TrueBlue™ | 2008 Annual Meeting |
|
|
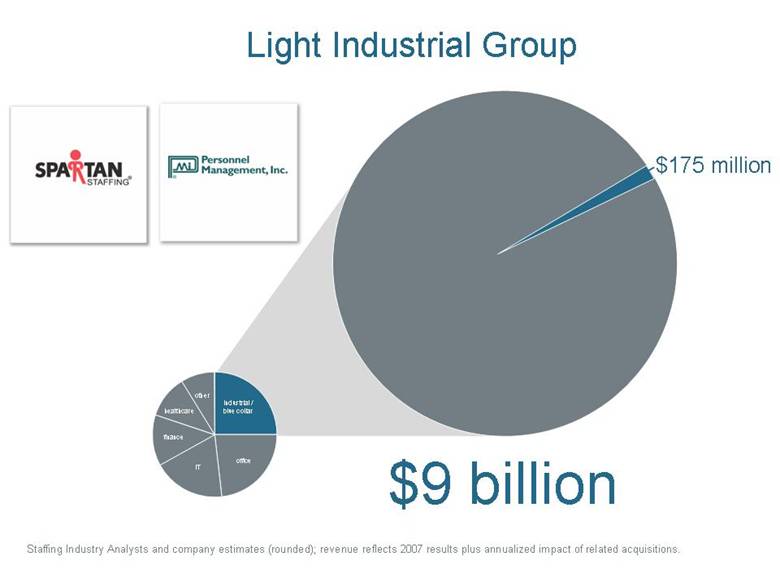
other finance healthcare office IT Industrial / blue collar Light Industrial Group $9 billion $175 million Staffing Industry Analysts and company estimates (rounded); revenue reflects 2007 results plus annualized impact of related acquisitions. TrueBlue™ | 2008 Annual Meeting |
|
|
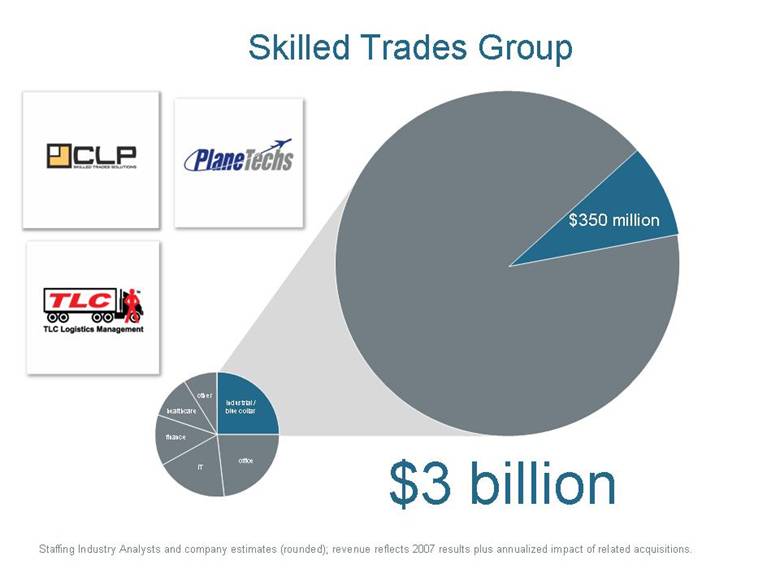
other finance healthcare office IT Industrial / blue collar Skilled Trades Group $3 billion $350 million Staffing Industry Analysts and company estimates (rounded); revenue reflects 2007 results plus annualized impact of related acquisitions. TrueBlue™ | 2008 Annual Meeting |
|
|
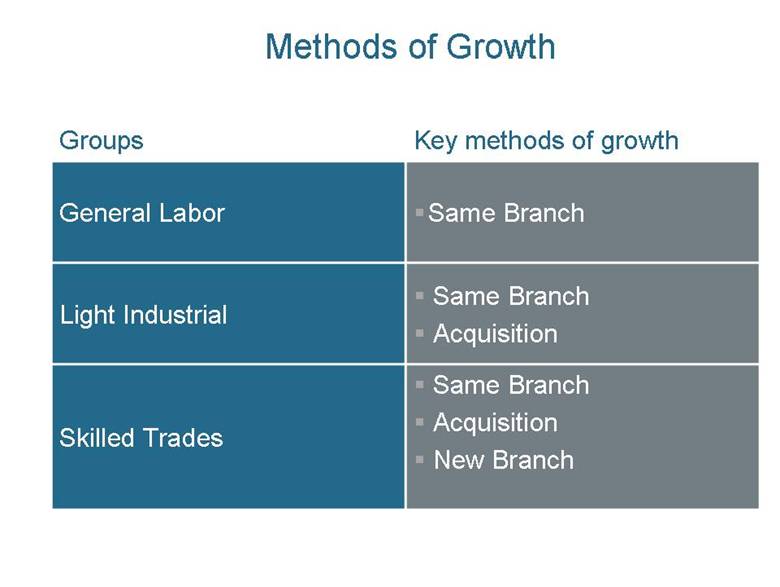
Methods of Growth TrueBlue™ | 2008 Annual Meeting 30 Groups Key methods of growth General Labor Same Branch Light Industrial Same Branch Acquisition Skilled Trades Same Branch Acquisition New Branch |
|
|
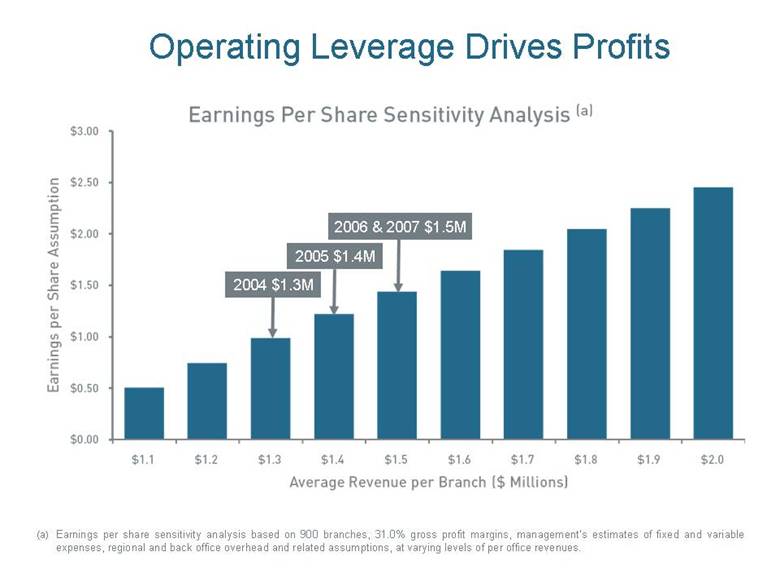
(a) Earnings per share sensitivity analysis based on 900 branches, 31.0% gross profit margins, management’s estimates of fixed and variable expenses, regional and back office overhead and related assumptions, at varying levels of per office revenues. 2004 $1.3M Operating Leverage Drives Profits TrueBlue™ | 2008 Annual Meeting 31 2005 $1.4M 2006 & 2007 $1.5M Earnings Per Share Sensitivity Analyis (a) $1.1 $1.2 $1.3 $1.4 $1.5 $1.6 $1.7 $1.8 $1.9 $2.0 Earnings per Share Assumption $0.00 $0.50 $1.00 $1.50 $2.00 $2.50 $3.00 |
|
|
Investment Highlights Service leader in blue-collar staffing Growth platforms in place for five business lines Strong operating leverage Industry-leading return on equity Significant share buyback program 32 TrueBlue™ | 2008 Annual Meeting |
|
|
Q & A 33 TrueBlue™ | 2008 Annual Meeting |