EXHIBIT 99.2
|
|
Steve Cooper, CEO | Derrek Gafford, CFO LABOR READY 5th Annual Analyst Day Nov. 14, 2007 |

EXHIBIT 99.2
|
|
Steve Cooper, CEO | Derrek Gafford, CFO LABOR READY 5th Annual Analyst Day Nov. 14, 2007 |
|
|
Safe Harbor Statement 2 TrueBlue™ Cautionary Note About Forward-Looking Statements: Certain statements made by us in this presentation that are not historical facts or that relate to future plans, events or performances are forward-looking statements within the meaning of the federal securities laws. Our actual results may differ materially from those expressed in any forward-looking statements made by us. Forward-looking statements involve a number of risks and uncertainties including, but not limited to, the risks described in the Company’s most recent 10-K and 10-Q filings. All forward-looking statements are qualified by those risk factors. |
|
|
Agenda INTRODUCTIONS STRATEGIC MILESTONES BUSINESS LINES INDUSTRY AND MARKET REVIEW STRATEGIES FINANCIAL REVIEW 3 TrueBlue™ |
|
|
4 Skilled Trades 15% General Labor 80% The largest supplier of general labor with 798 branch locations in the U.S., Canada and the U.K. Supplier of light industrial labor with 34 locations the U.S. Supplier of skilled trades people with 87 locations in the U.S. 2007 Revenue Approx. $1.4 billion Light Industrial 5% TrueBlue™ 2007 estimate, rounded to the nearest billion; percentages rounded to the nearest 5%; branch count as of Sept. 28, 2007 |
|
|
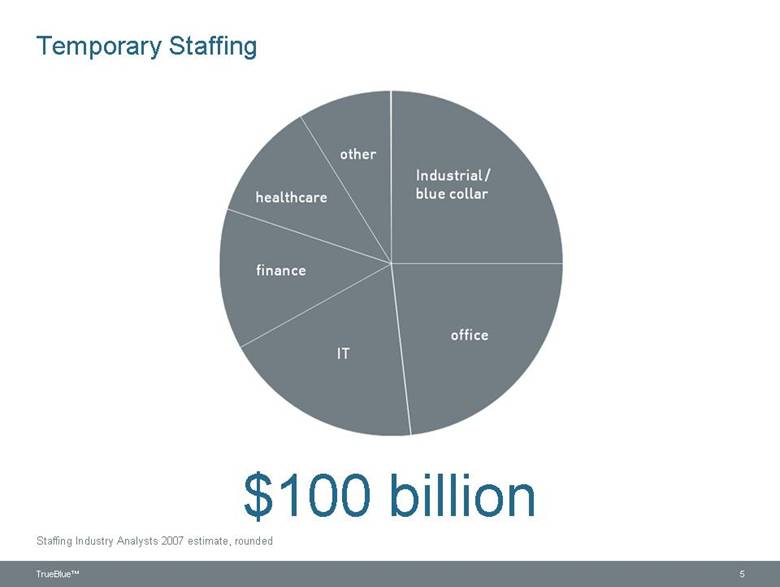
Temporary Staffing TrueBlue™ 5 $100 billion Staffing Industry Analysts 2007 estimate, rounded healthcare other Industrial / blue collar office IT finance |
|
|
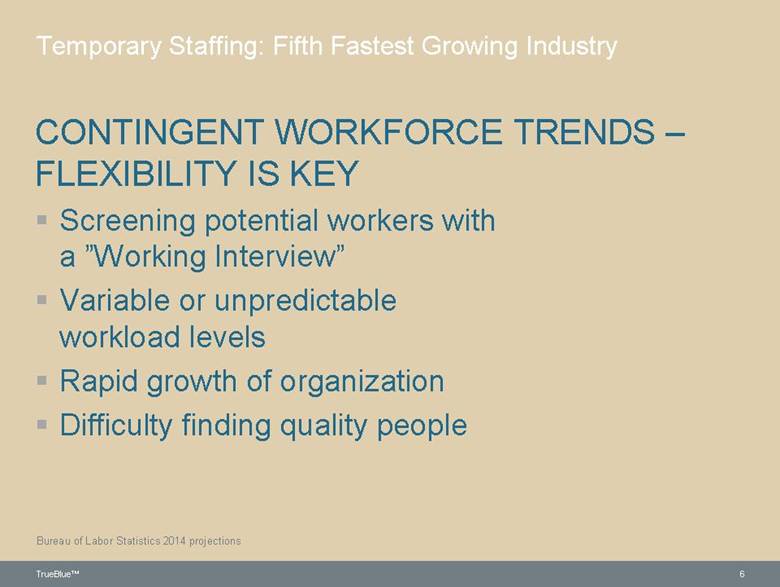
Temporary Staffing: Fifth Fastest Growing Industry CONTINGENT WORKFORCE TRENDS – FLEXIBILITY IS KEY Screening potential workers with a ”Working Interview” Variable or unpredictable workload levels Rapid growth of organization Difficulty finding quality people Bureau of Labor Statistics 2014 projections 6 TrueBlue™ |
|
|
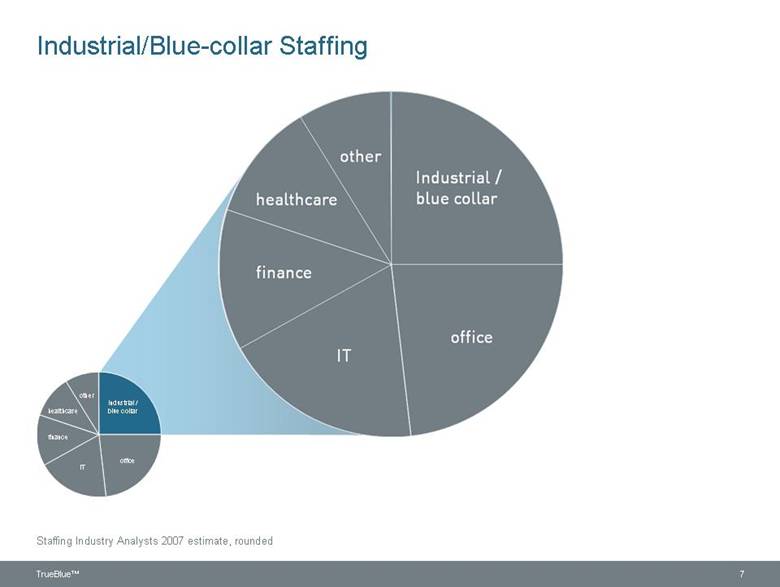
other finance healthcare office IT Industrial / blue collar Industrial / blue-collar Industrial/Blue-collar Staffing other finance healthcare office IT Industrial / blue collar 7 Staffing Industry Analysts 2007 estimate, rounded TrueBlue™ |
|
|
Perspectives in Blue-collar Staffing BLUE COLLAR PROJECTED TO GROW AT 6-7% OVER THE NEXT DECADE 70% of fastest growth jobs are unskilled Construction is the only durable goods industry projected for growth 50% OF THE MANPOWER HOTTEST JOBS FOR 2007 ARE BLUE COLLAR 8 TrueBlue™ Staffing Industry Analysts, Bureau of Labor Statistics Manpower |
|
|
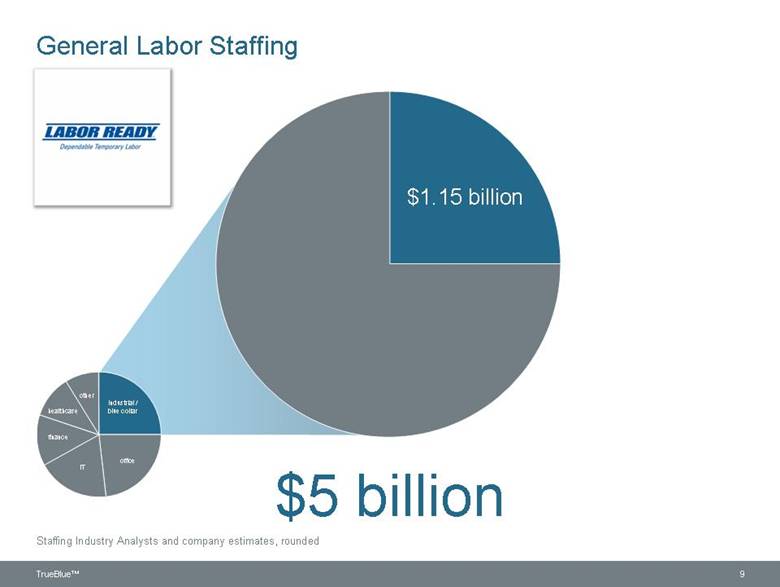
other finance healthcare office IT Industrial / blue collar General Labor Staffing $5 billion $1.15 billion 9 Staffing Industry Analysts and company estimates, rounded TrueBlue™ |
|
|
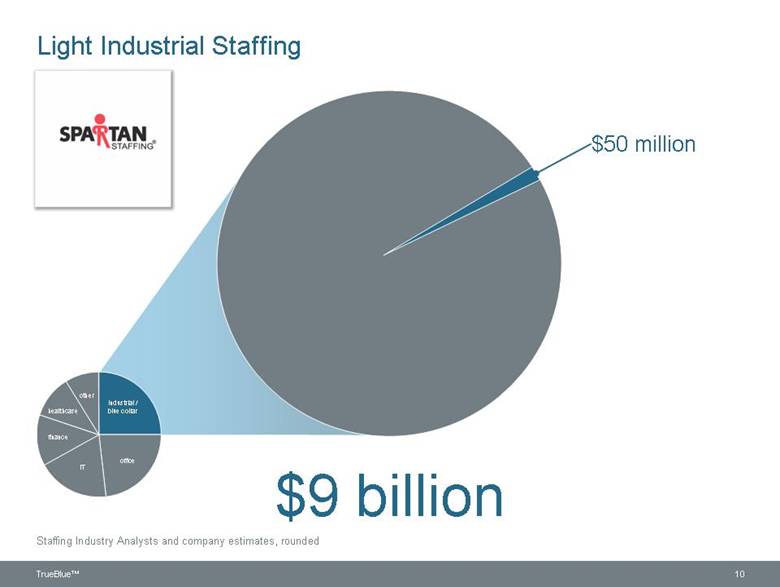
other finance healthcare office IT Industrial / blue collar Light Industrial Staffing $9 billion $50 million 10 Staffing Industry Analysts and company estimates, rounded TrueBlue™ |
|
|
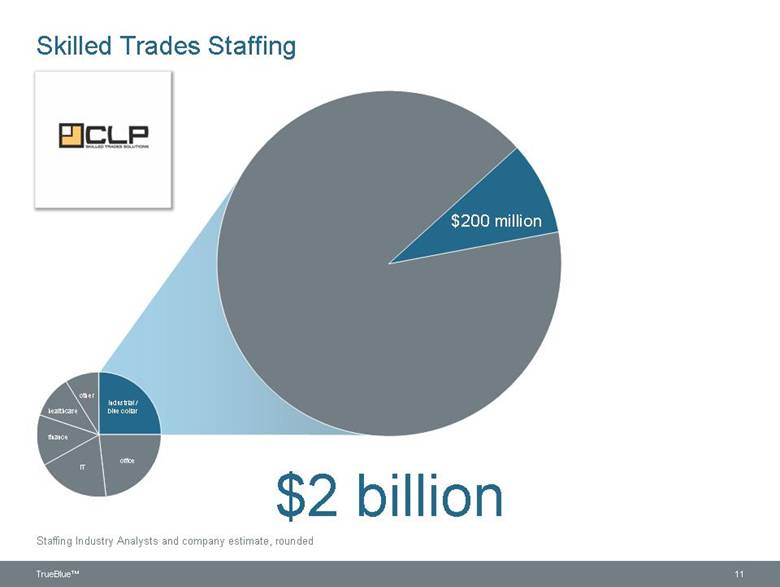
other finance healthcare office IT Industrial / blue collar Skilled Trades Staffing $2 billion $200 million 11 Staffing Industry Analysts and company estimate, rounded TrueBlue™ |
|
|
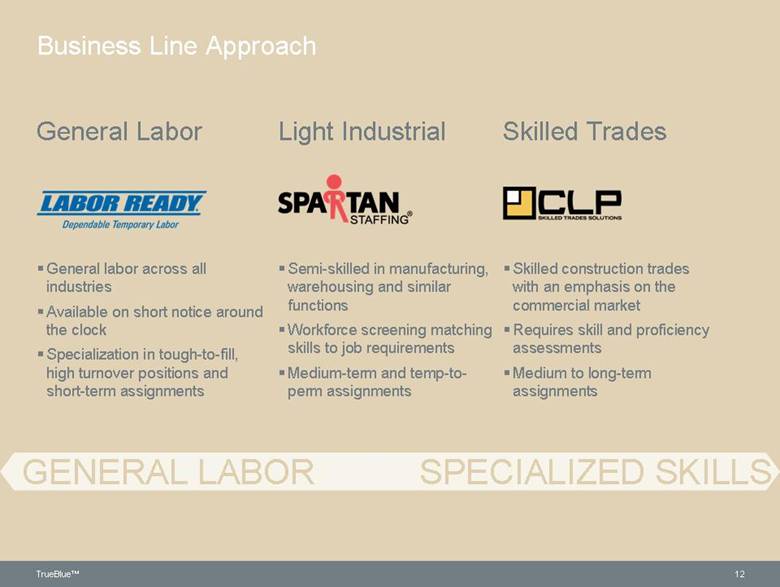
12 Business Line Approach General Labor Light Industrial Skilled Trades General labor across all industries Available on short notice around the clock Specialization in tough-to-fill, high turnover positions and short-term assignments Semi-skilled in manufacturing, warehousing and similar functions Workforce screening matching skills to job requirements Medium-term and temp-to-perm assignments Skilled construction trades with an emphasis on the commercial market Requires skill and proficiency assessments Medium to long-term assignments TrueBlue™ GENERAL LABOR SPECIALIZED SKILLS |
|
|
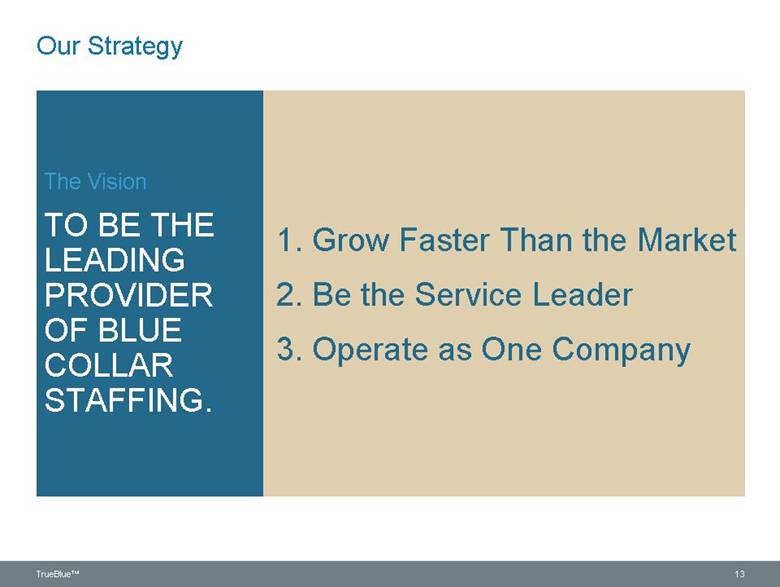
1. Grow Faster Than the Market 2. Be the Service Leader 3. Operate as One Company The Vision TO BE THE LEADING PROVIDER OF BLUE COLLAR STAFFING. Our Strategy 13 TrueBlue™ |
|
|
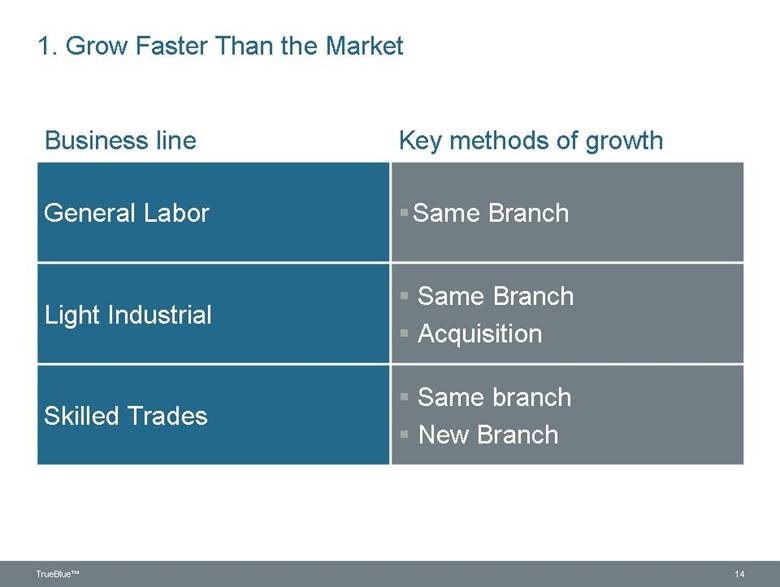
1. Grow Faster Than the Market Business line Key methods of growth General Labor Same Branch Light Industrial Same Branch Acquisition Skilled Trades Same branch New Branch 14 TrueBlue™ |
|
|
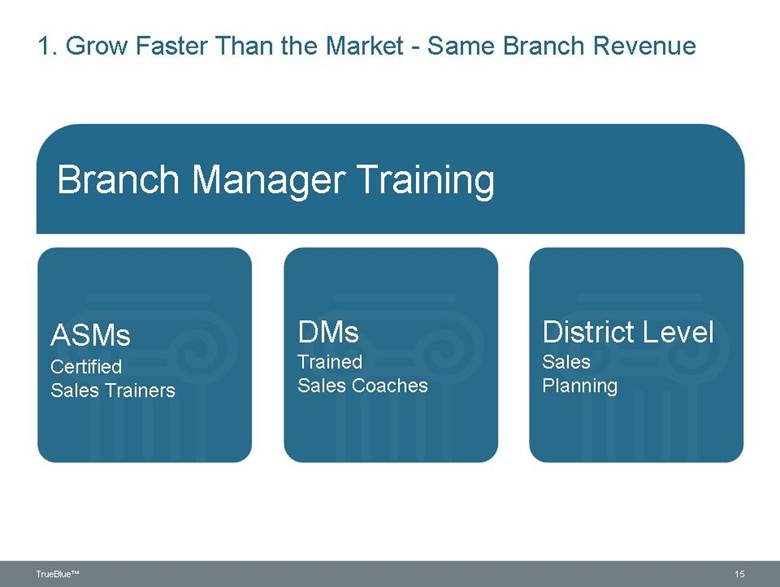
DMs Trained Sales Coaches District Level Sales Planning ASMs Certified Sales Trainers Branch Manager Training 1. Grow Faster Than the Market - Same Branch Revenue 15 TrueBlue™ |
|
|
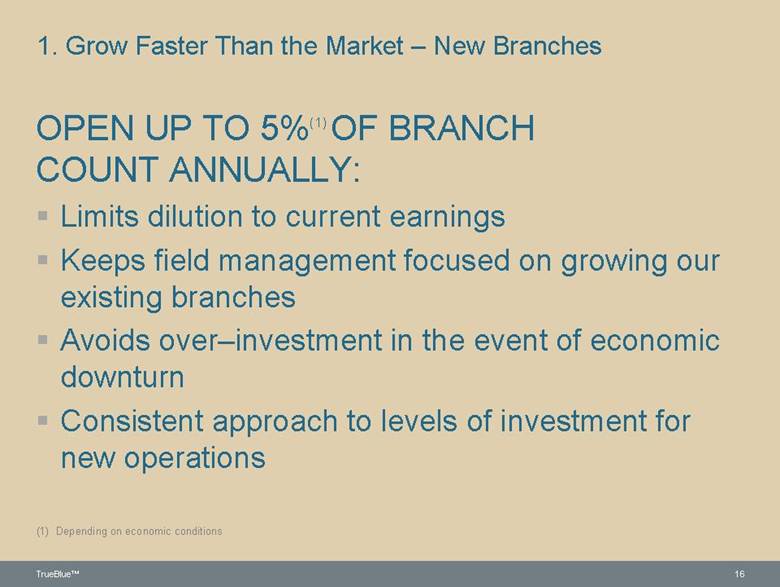
OPEN UP TO 5%(1) OF BRANCH COUNT ANNUALLY: Limits dilution to current earnings Keeps field management focused on growing our existing branches Avoids over–investment in the event of economic downturn Consistent approach to levels of investment for new operations 1. Grow Faster Than the Market – New Branches (1) Depending on economic conditions 16 TrueBlue™ |
|
|
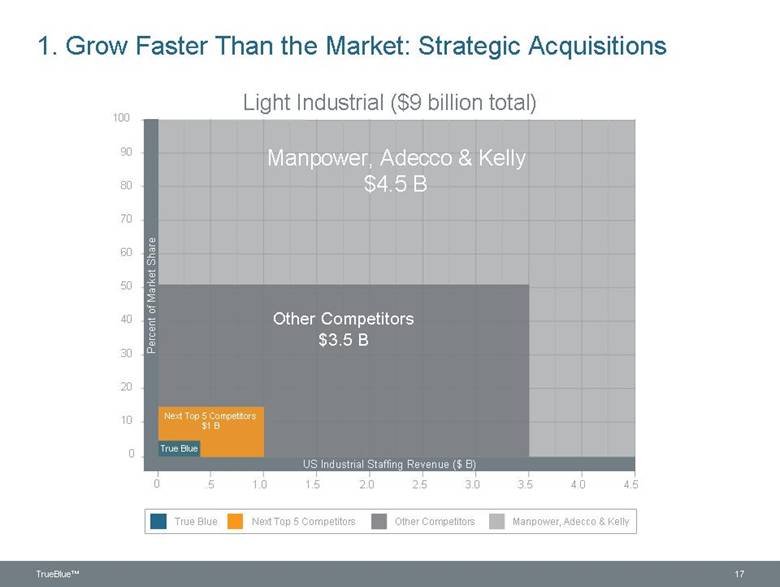
1. Grow Faster Than the Market: Strategic Acquisitions Light Industrial ($9 billion total) .5 1.0 1.5 2.0 2.5 3.0 3.5 4.0 4.5 US Industrial Staffing Revenue ($ B) Manpower, Adecco & Kelly $4.5 B Other Competitors $3.5 B Next Top 5 Competitors $1 B True Blue 10 20 30 40 50 60 70 80 90 100 0 0 Percent of Market Share True Blue Next Top 5 Competitors Other Competitors Manpower, Adecco & Kelly 17 TrueBlue™ |
|
|
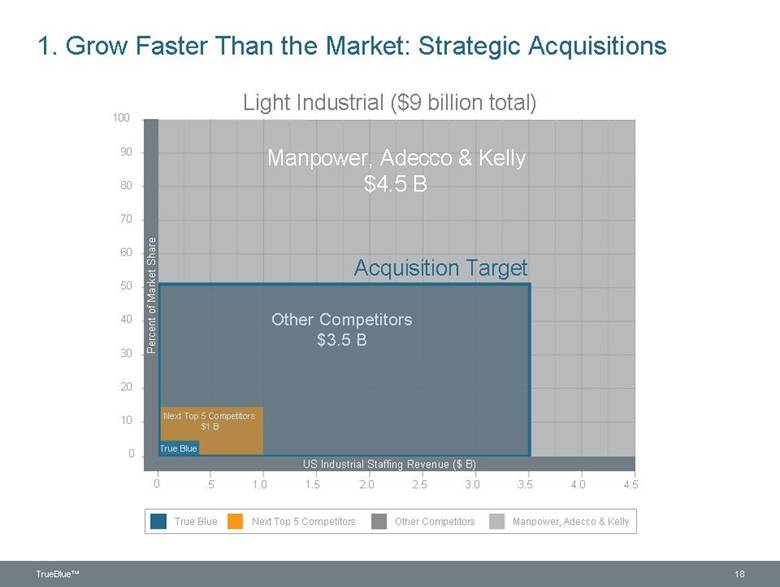
1. Grow Faster Than the Market: Strategic Acquisitions Light Industrial ($9 billion total) Manpower, Adecco & Kelly $4.5 B Other Competitors $3.5 B Next Top 5 Competitors $1 B True Blue 18 TrueBlue™ Acquisition Target .5 1.0 1.5 2.0 2.5 3.0 3.5 4.0 4.5 US Industrial Staffing Revenue ($ B) 10 20 30 40 50 60 70 80 90 100 0 0 Percent of Market Share True Blue Next Top 5 Competitors Other Competitors Manpower, Adecco & Kelly |
|
|
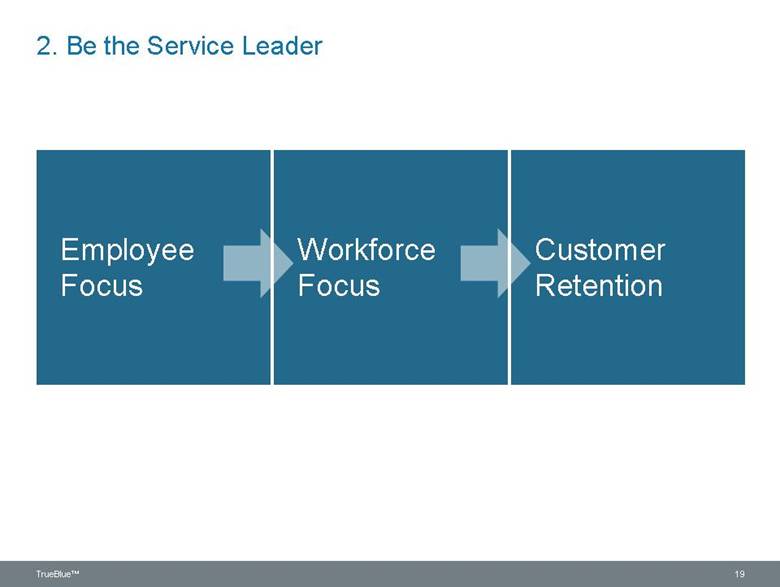
2. Be the Service Leader Workforce Focus Employee Focus Customer Retention 19 TrueBlue™ |
|
|
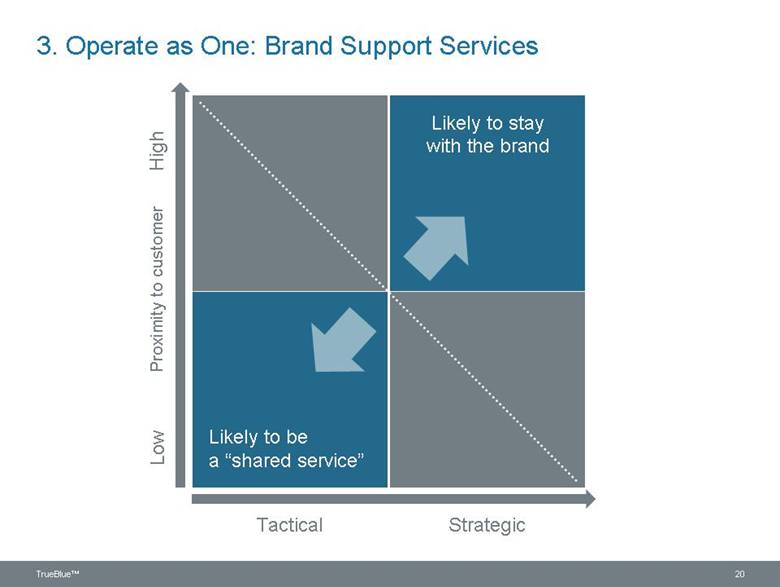
3. Operate as One: Brand Support Services Tactical Strategic Proximity to customer Low High Likely to stay with the brand Likely to be a “shared service” 20 TrueBlue™ |
|
|
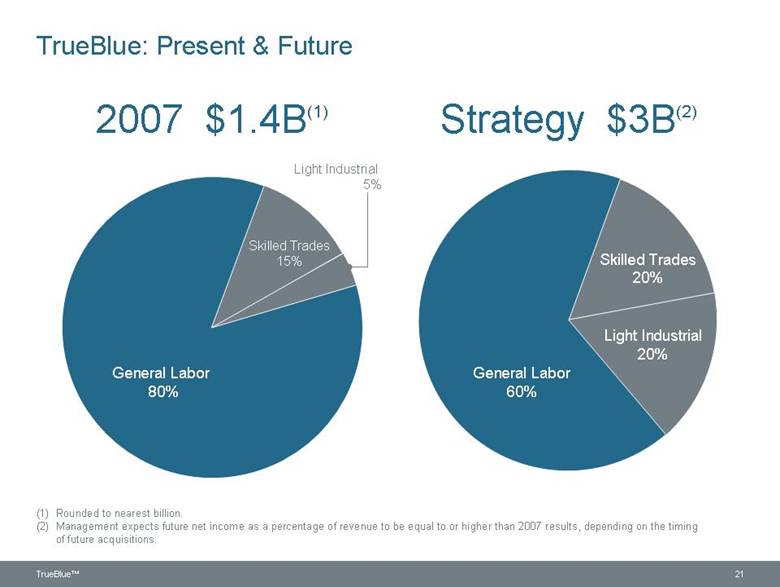
2007 $1.4B(1) General Labor 80% Light Industrial 5% Skilled Trades 15% General Labor 60% Skilled Trades 20% Light Industrial 20% Strategy $3B(2) TrueBlue: Present & Future 21 TrueBlue™ (1) Rounded to nearest billion. (2) Management expects future net income as a percentage of revenue to be equal to or higher than 2007 results, depending on the timing of future acquisitions. |
|
|
Financial Review 22 TrueBlue™ |
|
|
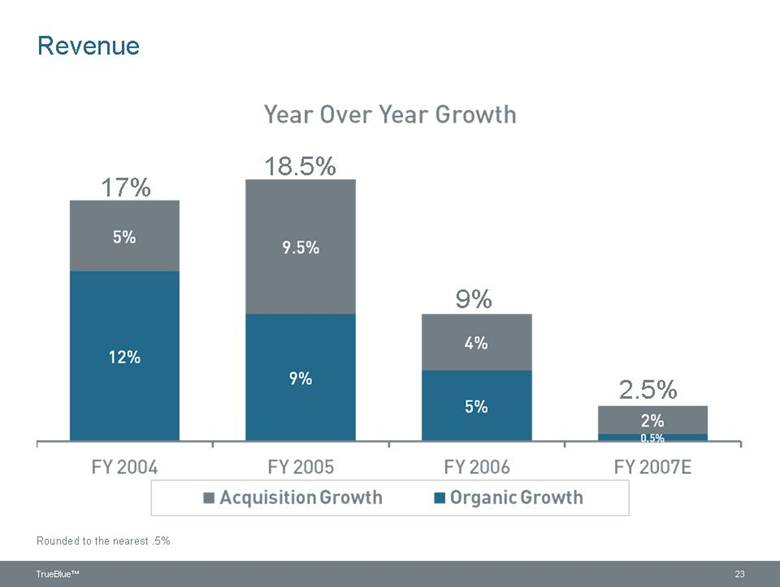
Revenue Rounded to the nearest .5% 23 TrueBlue™ Year Over Year Growth 17% 5% 12% 18.5% 9.5% 9% 9% 4% 5% 2.5% 2% 0.5% FY 2004 FY 2005 FY 2006 FY 2007E Acquisition Growth Organic Growth |
|
|
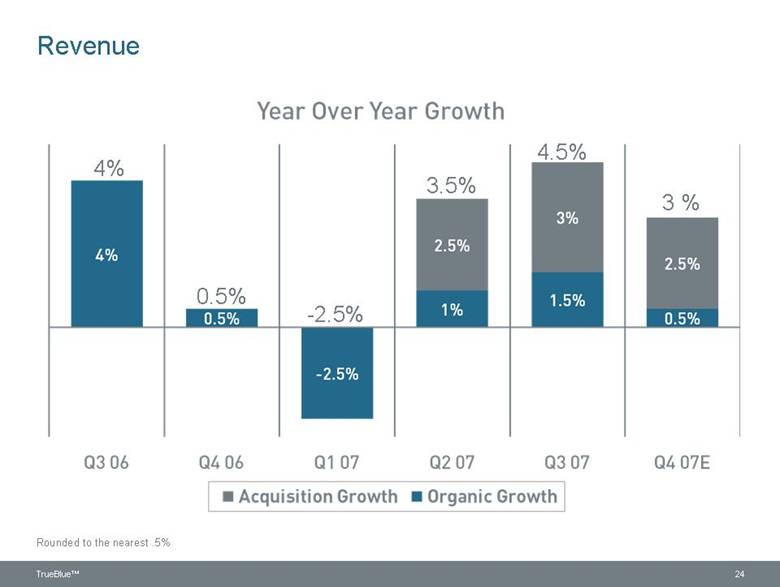
Revenue Rounded to the nearest .5% 24 TrueBlue™ Year Over Year Growth 4% 4% 0.5% 0.5% -2.5% -2.5% 3.5% 2.5% 1% 4.5% 3% 1.5% 3% 2.5% 0.5% Q3 06 Q4 06 Q1 07 Q2 07 Q3 07 Q4 07E Acquisition Growth Organic Growth |
|
|
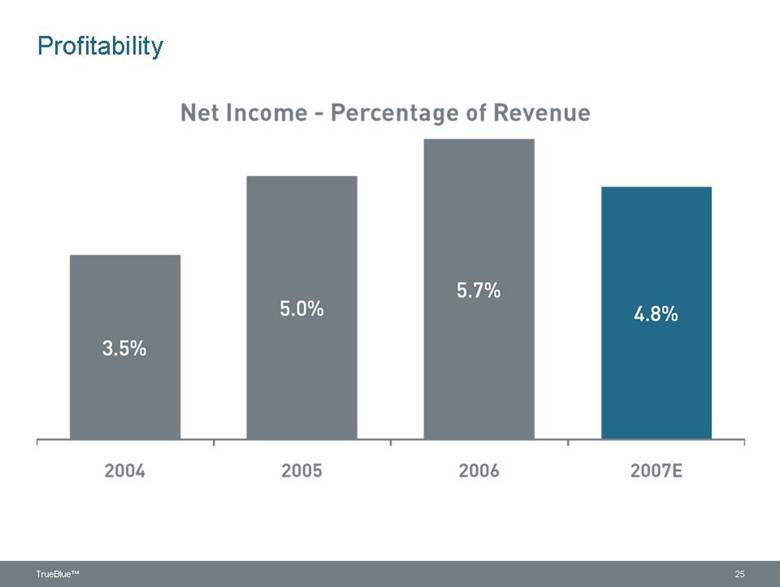
Profitability 25 TrueBlue™ Net Income – Percentage of Revenue 3.5% 5.0% 5.7% 4.8% 2004 2005 2006 2007E |
|
|
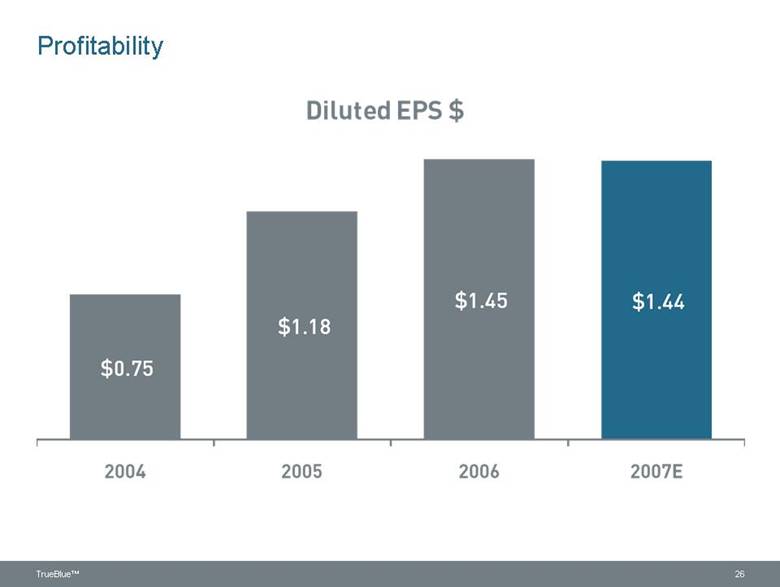
Profitability 26 TrueBlue™ Diluted EPS $ $0.75 $1.18 $1.45 $1.44 2004 2005 2006 2007E |
|
|
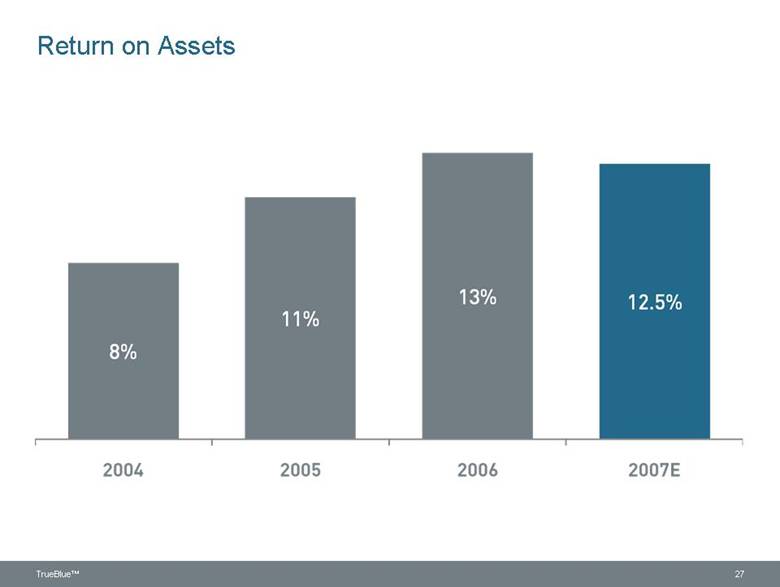
Return on Assets 27 TrueBlue™ 8% 11% 13% 12.5% 2004 2005 2006 2007E |
|
|
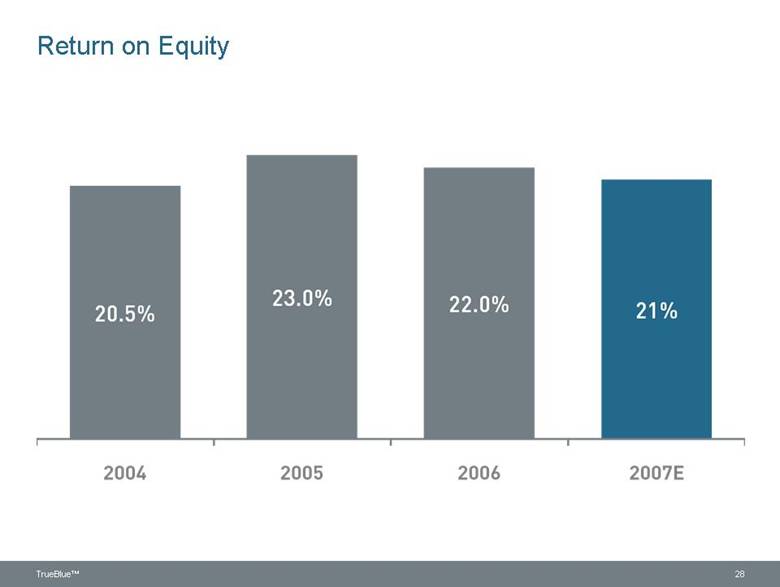
Return on Equity 28 TrueBlue™ 20.5% 23.0% 22.0% 21% 2004 2005 2006 2007E |
|
|
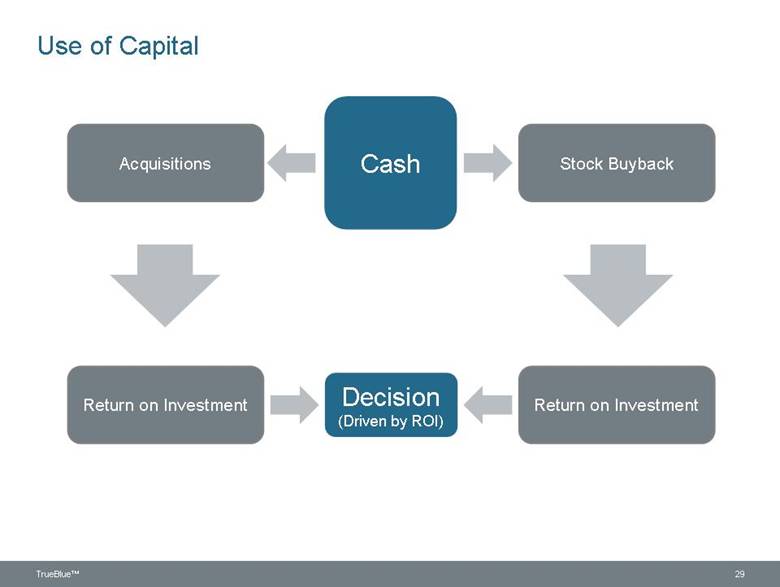
Use of Capital Cash Acquisitions Stock Buyback Return on Investment Return on Investment Decision (Driven by ROI) 29 TrueBlue™ |
|
|
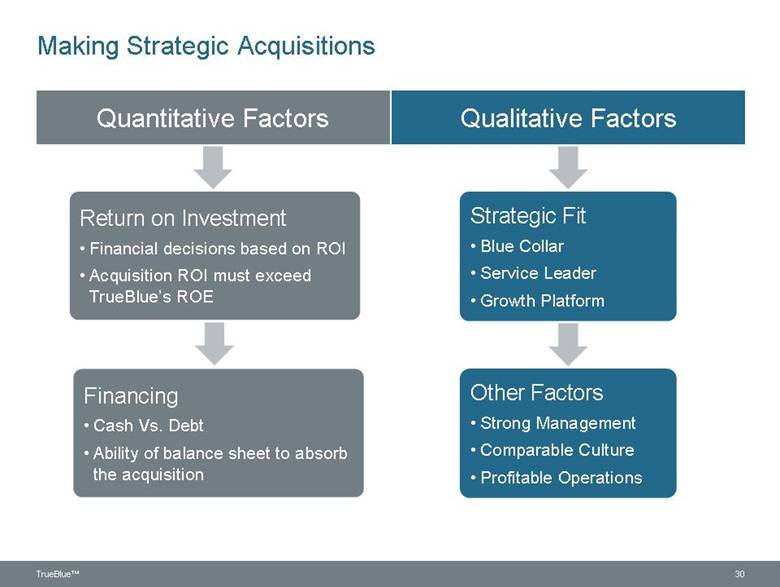
Making Strategic Acquisitions Qualitative Factors Quantitative Factors Other Factors Strong Management Comparable Culture Profitable Operations Strategic Fit Blue Collar Service Leader Growth Platform Return on Investment Financial decisions based on ROI Acquisition ROI must exceed TrueBlue’s ROE Financing Cash Vs. Debt Ability of balance sheet to absorb the acquisition 30 TrueBlue™ |
|
|
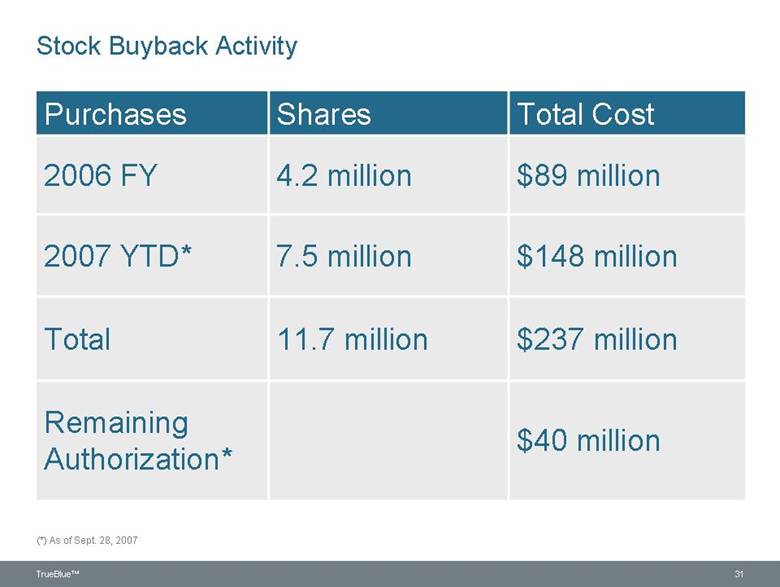
Stock Buyback Activity Purchases Shares Total Cost 2006 FY 4.2 million $89 million 2007 YTD* 7.5 million $148 million Total 11.7 million $237 million Remaining Authorization* $40 million (*) As of Sept. 28, 2007 31 TrueBlue™ |
|
|
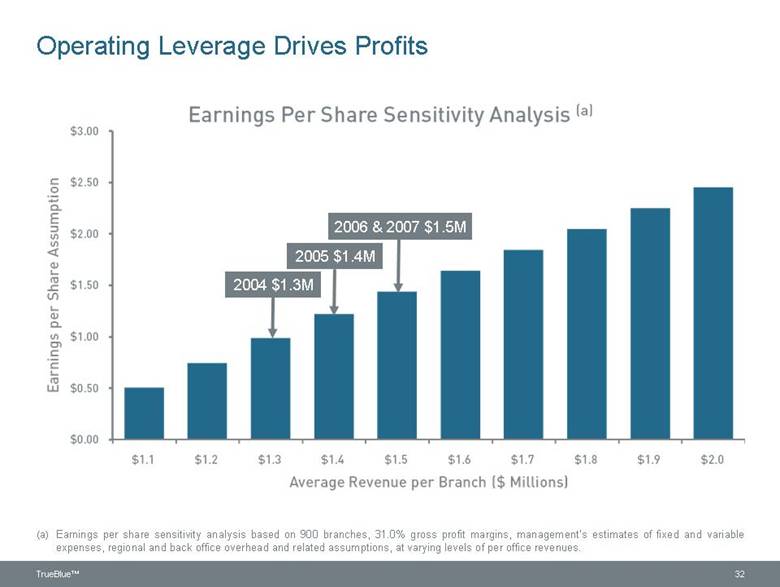
(a) Earnings per share sensitivity analysis based on 900 branches, 31.0% gross profit margins, management’s estimates of fixed and variable expenses, regional and back office overhead and related assumptions, at varying levels of per office revenues. 2004 $1.3M Operating Leverage Drives Profits 2005 $1.4M 2006 & 2007 $1.5M 32 TrueBlue™ Earnings Per Share Sensitivity Analysis (a) Earnings per Share Assumption $3.00 $2.50 $2.00 $1.50 $1.00 $0.50 $0.00 $1.1 $1.2 $1.3 $1.4 $1.5 $1.6 $1.7 $1.8 $1.9 $2.0 Average Revenue per Branch ($ Millions) |
|
|
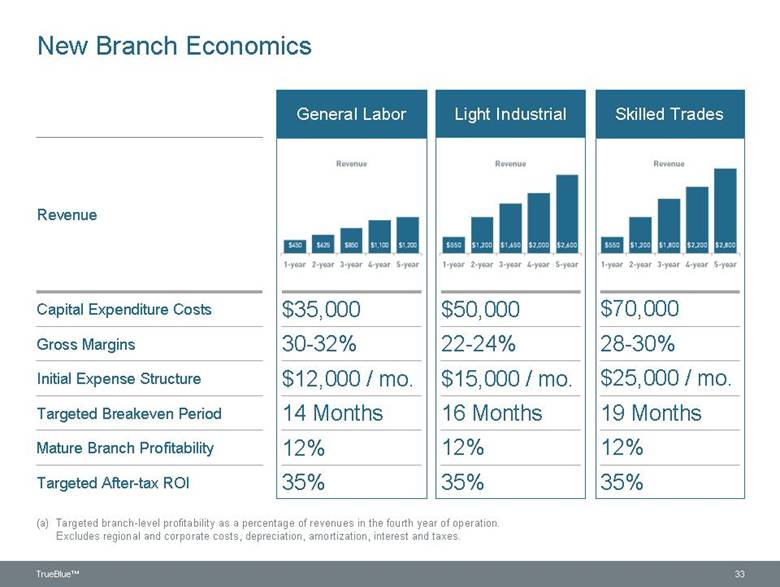
33 New Branch Economics (a) Targeted branch-level profitability as a percentage of revenues in the fourth year of operation. Excludes regional and corporate costs, depreciation, amortization, interest and taxes. Gross Margins Initial Expense Structure Targeted Breakeven Period Mature Branch Profitability Targeted After-tax ROI Capital Expenditure Costs General Labor Light Industrial Skilled Trades 30-32% 22-24% 28-30% $12,000 / mo. $15,000 / mo. $25,000 / mo. 14 Months 16 Months 19 Months 12% 12% 12% 35% 35% 35% $35,000 $50,000 $70,000 Revenue TrueBlue™ Revenue $450 $675 $860 $1100 $1200 1-year 2-year 3-year 4-year 5 year Revenue $550,$1,200 $1,650 $2,000 $2,600 1-year 2-year 3-year 4-year 5 year Revenue $550 $1,200 $1,800 $2,200 $2,800 1-year 2-year 3-year 4-year 5 year |
|
|
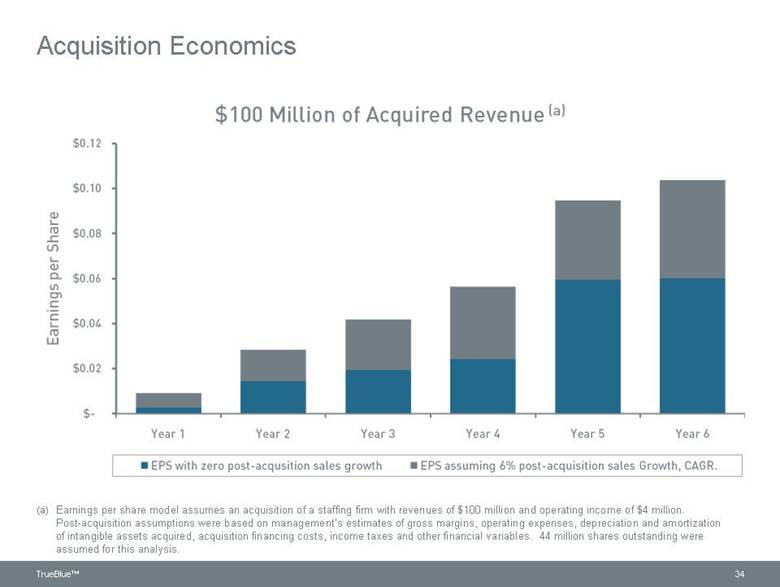
(a) Earnings per share model assumes an acquisition of a staffing firm with revenues of $100 million and operating income of $4 million. Post-acquisition assumptions were based on management’s estimates of gross margins, operating expenses, depreciation and amortization of intangible assets acquired, acquisition financing costs, income taxes and other financial variables. 44 million shares outstanding were assumed for this analysis. Acquisition Economics 34 TrueBlue™ $100 Million of Acquired Revenue (a) Earnings per Share $0.12 $0.10 $0.08 $0.06 $0.04 $0.02 $- Year 1 Year 2 Year 3 Year 4 Year 5 Year 6 EPS with zero post-acquisition sales growth EPS assuming 6% post-acquisition sales Growth, CAGR. |
|
|
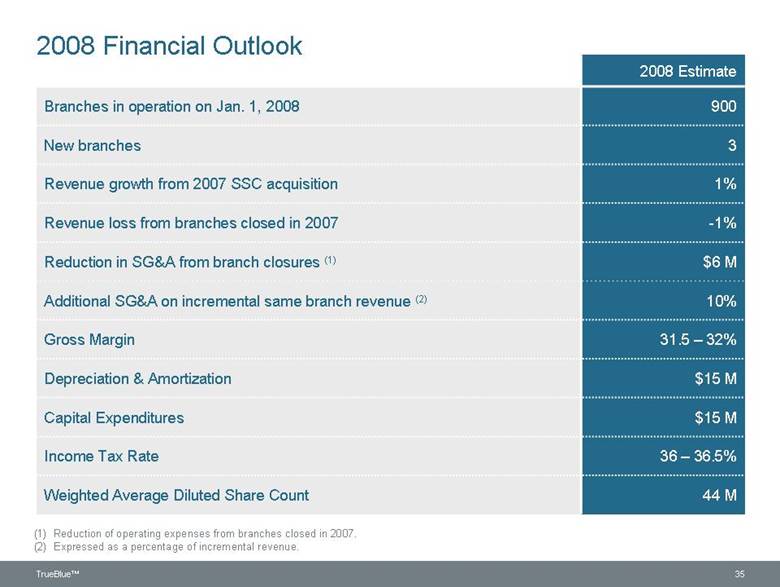
2008 Financial Outlook 2008 Estimate Branches in operation on Jan. 1, 2008 900 New branches 3 Revenue growth from 2007 SSC acquisition 1% Revenue loss from branches closed in 2007 -1% Reduction in SG&A from branch closures (1) $6 M Additional SG&A on incremental same branch revenue (2) 10% Gross Margin 31.5 – 32% Depreciation & Amortization $15 M Capital Expenditures $15 M Income Tax Rate 36 – 36.5% Weighted Average Diluted Share Count 44 M Reduction of operating expenses from branches closed in 2007. Expressed as a percentage of incremental revenue. 35 TrueBlue™ (1) (2) |
|
|
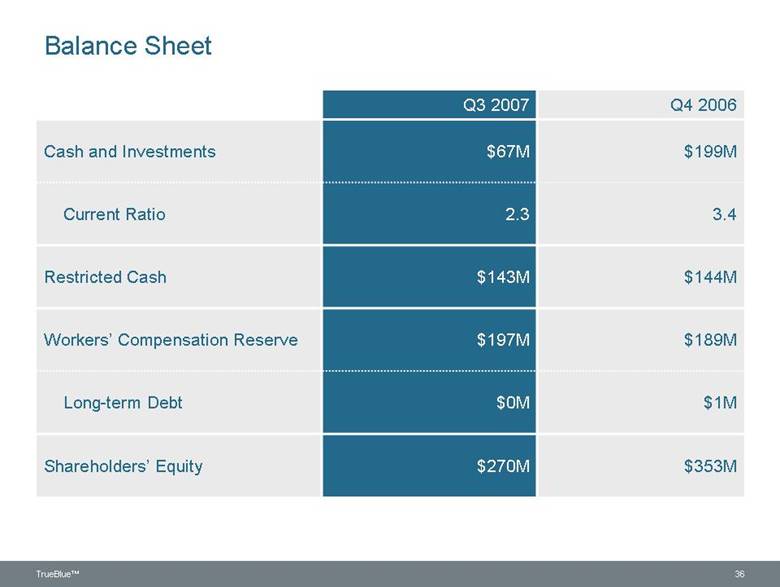
Balance Sheet Q3 2007 Q4 2006 Cash and Investments $67M $199M Current Ratio 2.3 3.4 Restricted Cash $143M $144M Workers’ Compensation Reserve $197M $189M Long-term Debt $0M $1M Shareholders’ Equity $270M $353M 36 TrueBlue™ |
|
|
Investment Highlights Service leader in blue-collar staffing Growth platforms in place for two business lines Strong operating leverage Industry-leading return on assets and equity Available resources to invest in additional growth platforms Significant share buyback program 37 TrueBlue™ |