Exhibit 99.2
|
|
|
Exhibit 99.2
|
|
|
|
|
Safe Harbor Statement Cautionary Note about Forward–Looking StatementsCertain statements made by us in this presentation that are not historical facts or that relate to future plans, events or performances are forward–looking statements within the meaning of the federal securities laws. Our actual results may differ materially from those expressed in any forward–looking statements made by us. Forward-looking statements involve a number of risks and uncertainties including, but not limited to, the risks described in the Company’s most recent 10–K and 10–Q filings. All forward-looking statements are qualified by those risk factors. 2 |
|
|
Agenda Introductions Industry and Market Review Brand Fundamentals Business Strategies Financial Update and Outlook 3 |
|
|
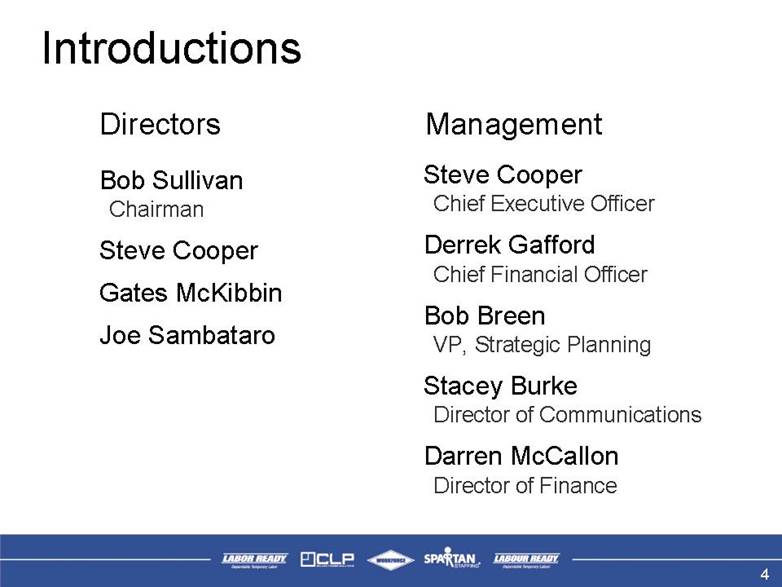
Introductions Bob Sullivan Chairman Steve Cooper Gates McKibbin Joe Sambataro Directors Steve Cooper Chief Executive Officer Derrek Gafford Chief Financial Officer Bob Breen VP, Strategic Planning Stacey Burke Director of Communications Darren McCallon Director of Finance Management 4 |
|
|
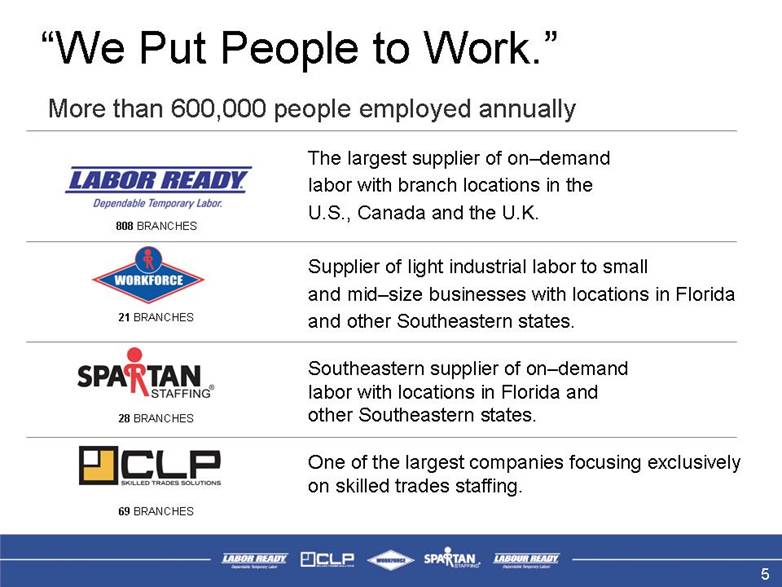
“We Put People to Work.” The largest supplier of on–demand labor with branch locations in the U.S., Canada and the U.K. Supplier of light industrial labor to small and mid–size businesses with locations in Florida and other Southeastern states. Southeastern supplier of on–demand labor with locations in Florida and other Southeastern states. One of the largest companies focusing exclusively on skilled trades staffing. More than 600,000 people employed annually 808 BRANCHES 21 BRANCHES 28 BRANCHES 69 BRANCHES 5 |
|
|
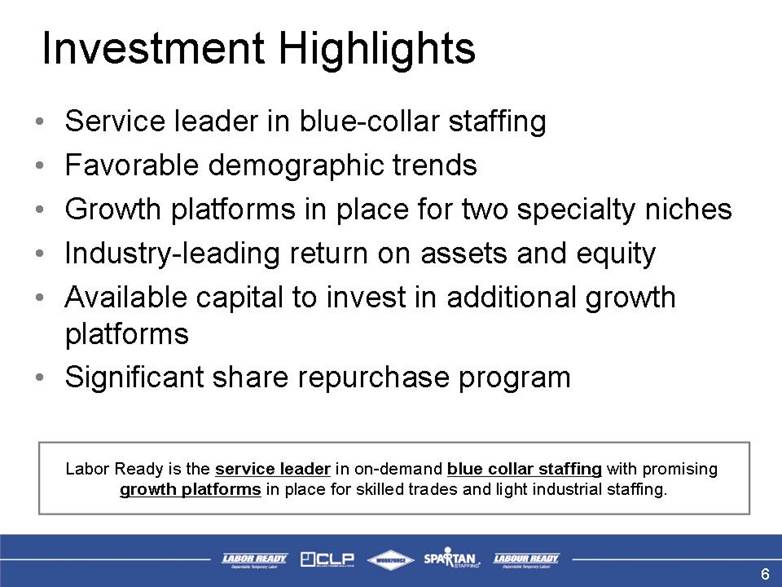
Investment Highlights Service leader in blue-collar staffing Favorable demographic trends Growth platforms in place for two specialty niches Industry-leading return on assets and equity Available capital to invest in additional growth platforms Significant share repurchase program Labor Ready is the service leader in on-demand blue collar staffing with promising growth platforms in place for skilled trades and light industrial staffing. 6 |
|
|
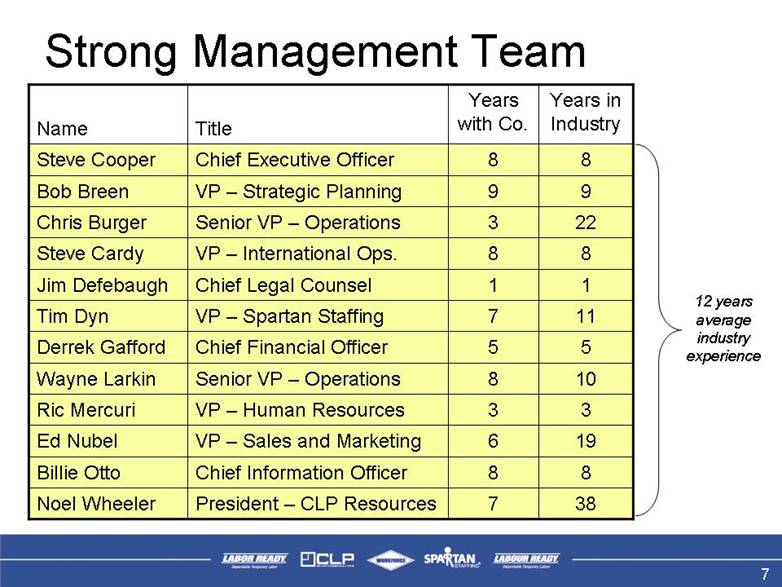
Strong Management Team 38 7 President – CLP Resources Noel Wheeler 8 8 Chief Information Officer Billie Otto 19 6 VP – Sales and Marketing Ed Nubel 3 3 VP – Human Resources Ric Mercuri 10 8 Senior VP – Operations Wayne Larkin 5 5 Chief Financial Officer Derrek Gafford 11 7 VP – Spartan Staffing Tim Dyn 1 1 Chief Legal Counsel Jim Defebaugh 8 8 VP – International Ops. Steve Cardy 22 3 Senior VP – Operations Chris Burger 9 9 VP – Strategic Planning Bob Breen 8 8 Chief Executive Officer Steve Cooper Years in Industry Years with Co. Title Name 12 years average industry experience 7 |
|
|
|
|
|
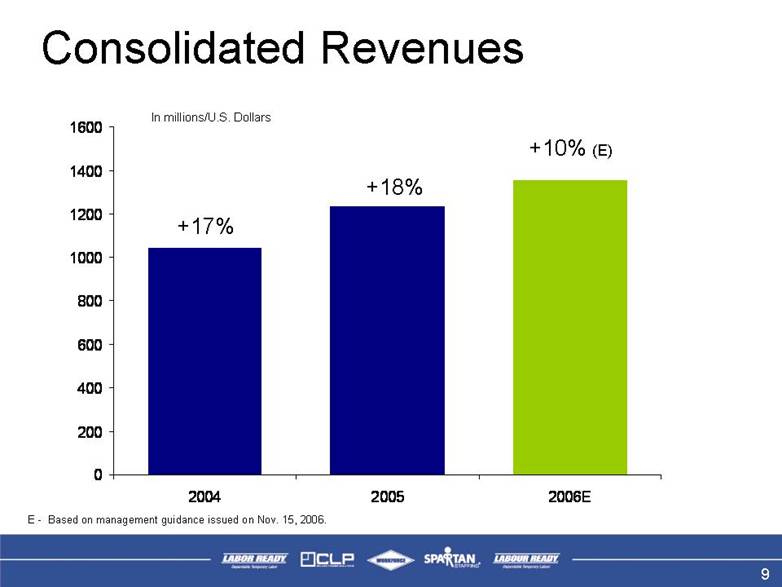
In millions/U.S. Dollars Consolidated Revenues +17% +18% +10% (E) 9 E - Based on management guidance issued on Nov. 15, 2006. 02004006008001000120014001600200420052006E |
|
|
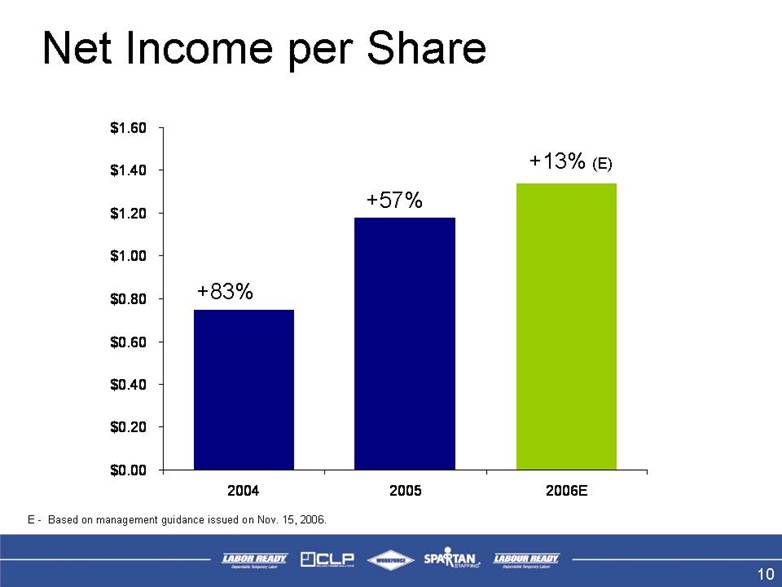
Net Income per Share E - Based on management guidance issued on Nov. 15, 2006. +83% +57% +13% (E) 10 $0.00$0.20$0.40$0.60$0.80$1.00$1.20$1.40$1.60200420052006E |
|
|
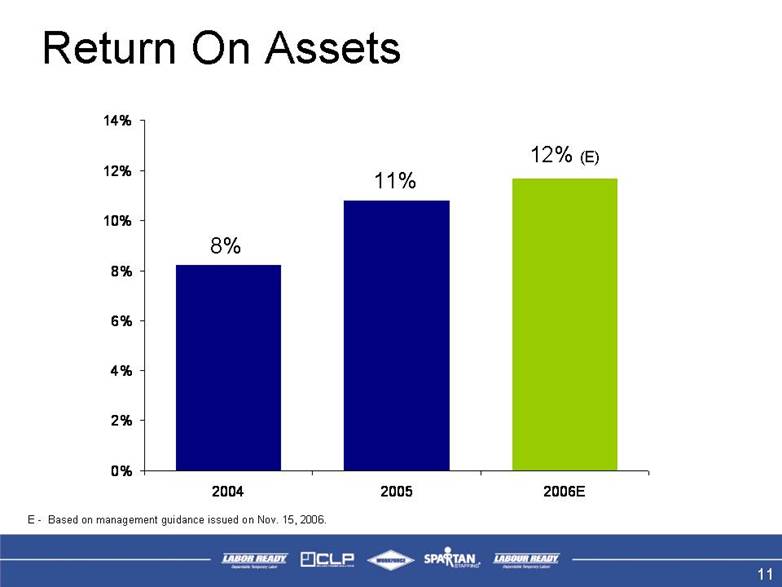
Return On Assets 8% 11% 12% (E) 11 E - Based on management guidance issued on Nov. 15, 2006. 0%2%4%6%8%10%12%14%200420052006E |
|
|
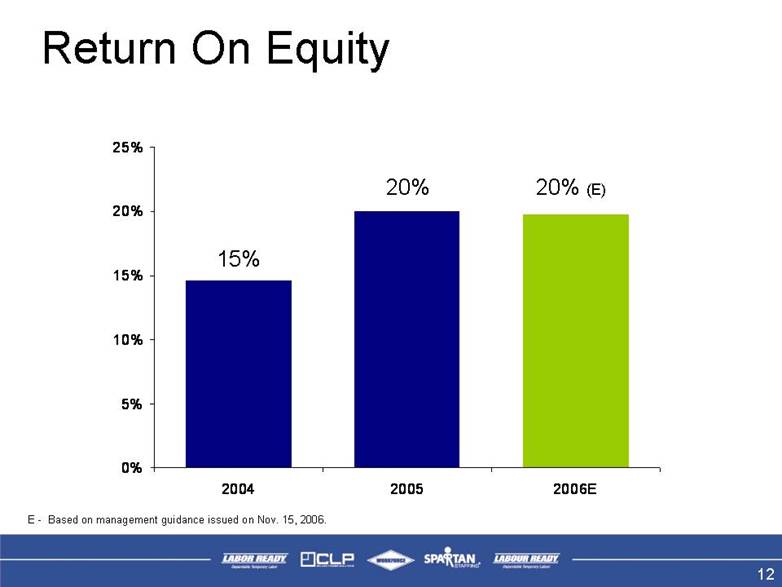
Return On Equity E - Based on management guidance issued on Nov. 15, 2006. 15% 20% 20% (E) 12 0%5%10%15%20%25%200420052006E |
|
|
|
|
|
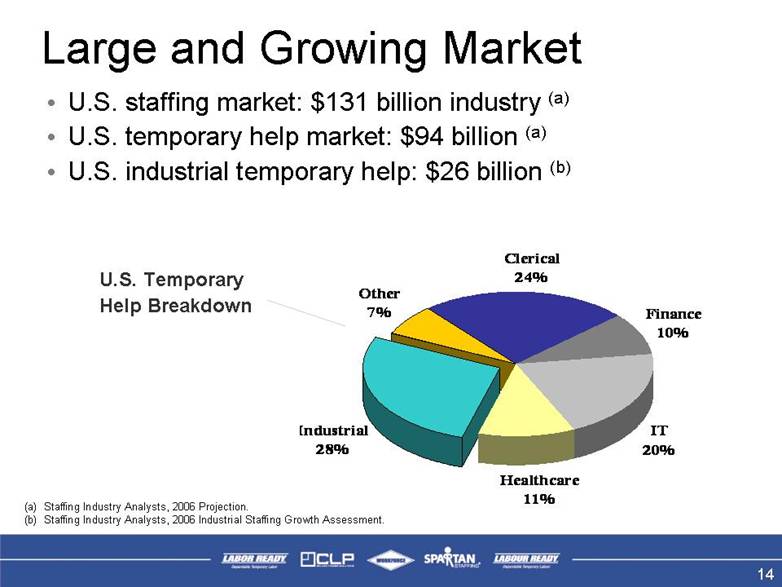
U.S. Temporary Help Breakdown Staffing Industry Analysts, 2006 Projection. Staffing Industry Analysts, 2006 Industrial Staffing Growth Assessment. Large and Growing Market U.S. staffing market: $131 billion industry (a) U.S. temporary help market: $94 billion (a) U.S. industrial temporary help: $26 billion (b) 14 Clerical24%Finance10%IT20%Healthcare11%Industrial28%Other7% |
|
|
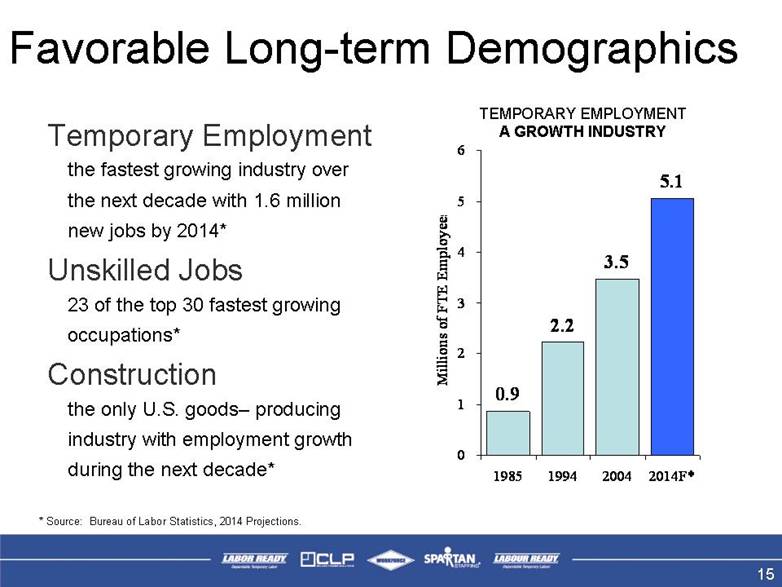
* Source: Bureau of Labor Statistics, 2014 Projections. Favorable Long-term Demographics Temporary Employment the fastest growing industry over the next decade with 1.6 million new jobs by 2014* Unskilled Jobs 23 of the top 30 fastest growing occupations* Construction the only U.S. goods– producing industry with employment growth during the next decade* TEMPORARY EMPLOYMENT A GROWTH INDUSTRY15 0.92.23.55.101234561985199420042014F*Millions of FTE Employees |
|
|
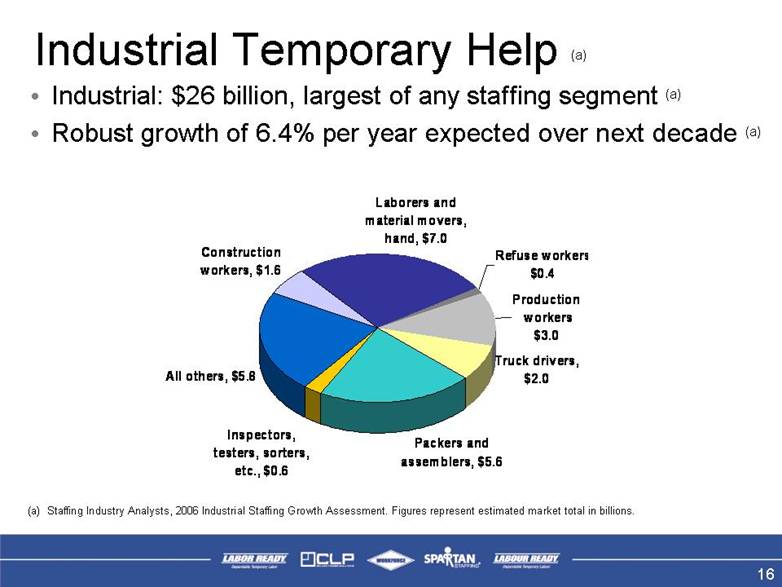
Staffing Industry Analysts, 2006 Industrial Staffing Growth Assessment. Figures represent estimated market total in billions. Industrial Temporary Help (a)Industrial: $26 billion, largest of any staffing segment (a) Robust growth of 6.4% per year expected over next decade (a)16 Inspectors, testers, sorters, etc., $0.6 All others, $5.8 Construction workers, $1.6 Refuse workers$0.4 Productionworkers$3.0 Packers and assemblers, $5.6 Truck drivers, $2.0 Laborers and material movers, hand, $7.0 |
|
|
|
|
|
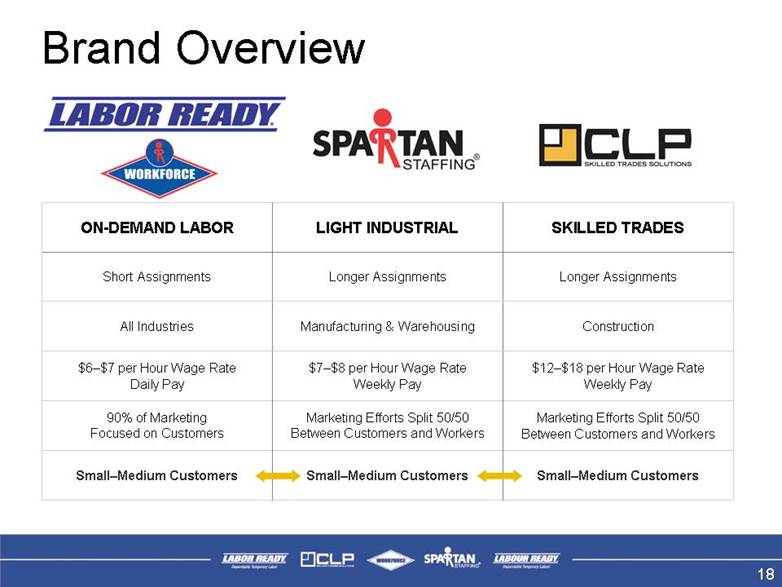
Brand Overview Small–Medium Customers Small–Medium Customers Small–Medium Customers Marketing Efforts Split 50/50 Between Customers and Workers Marketing Efforts Split 50/50 Between Customers and Workers 90% of Marketing Focused on Customers $12–$18 per Hour Wage Rate Weekly Pay $7–$8 per Hour Wage Rate Weekly Pay $6–$7 per Hour Wage Rate Daily Pay Construction Manufacturing & Warehousing All Industries Longer Assignments Longer Assignments Short Assignments SKILLED TRADESLIGHT INDUSTRIAL ON-DEMAND LABOR 18 |
|
|
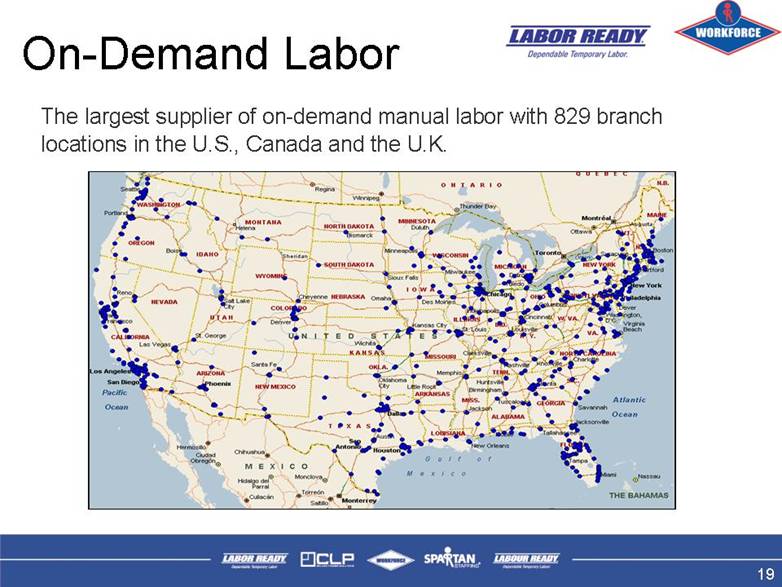
On-Demand Labor The largest supplier of on-demand manual labor with 829 branch locations in the U.S., Canada and the U.K. 19 |
|
|
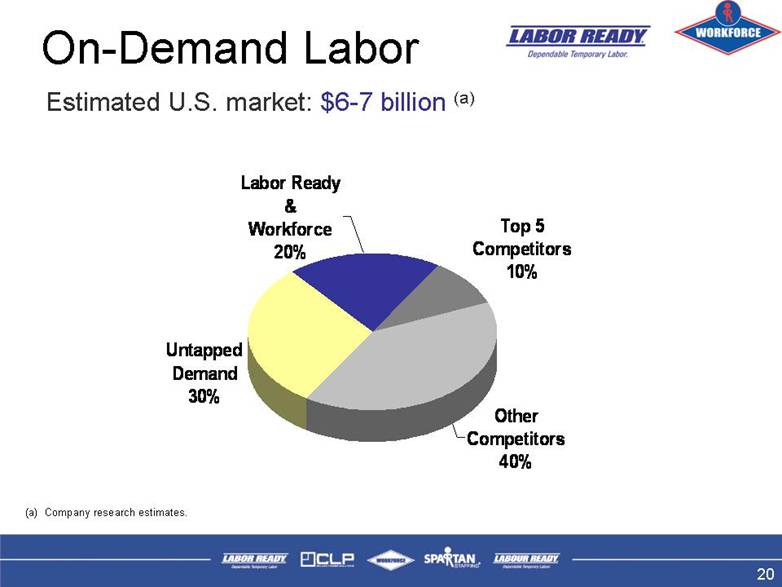
Company research estimates. On-Demand Labor Estimated U.S. market: $6-7 billion (a) 20 Labor Ready &Workforce20%Top 5 Competitors10%Untapped Demand30%Other Competitors 40% |
|
|
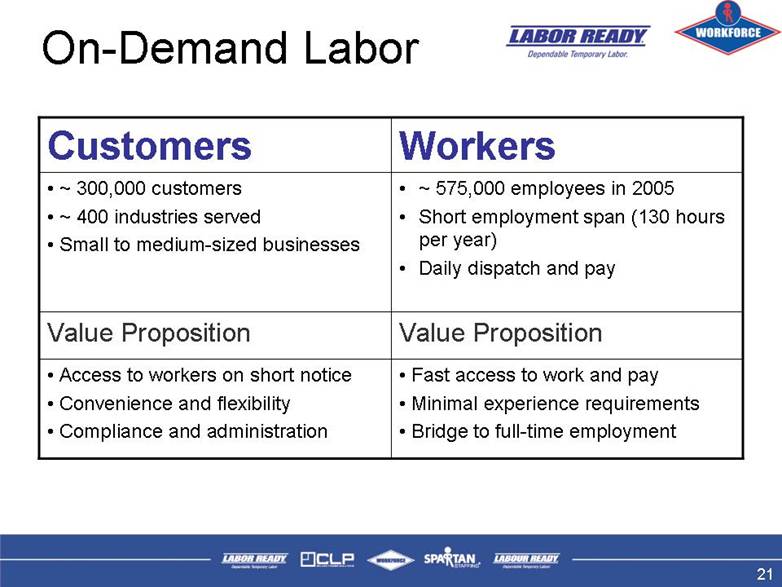
On-Demand Labor Fast access to work and pay Minimal experience requirements Bridge to full-time employmentAccess to workers on short notice Convenience and flexibility Compliance and administration Value Proposition Value Proposition ~ 575,000 employees in 2005 Short employment span (130 hours per year) Daily dispatch and pay ~ 300,000 customers ~ 400 industries served Small to medium-sized businesses Workers Customers 21 |
|
|
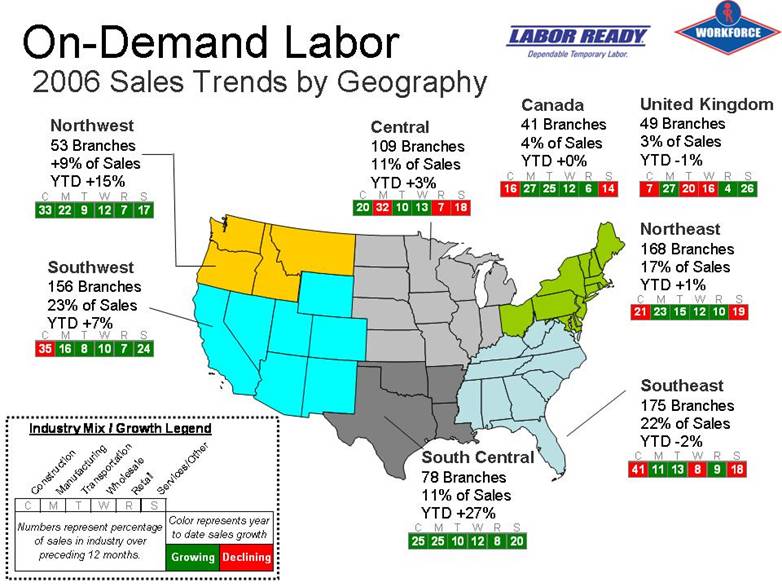
Southeast175 Branches 22% of Sales YTD -2% Northeast168 Branches 17% of Sales YTD +1% Northwest53 Branches +9% of Sales YTD +15% Southwest 156 Branches 23% of Sales YTD +7% Canada41 Branches 4% of Sales YTD +0% United Kingdom 49 Branches 3% of Sales YTD -1% South Central78 Branches 11% of Sales YTD +27% Central109 Branches 11% of Sales YTD +3% On-Demand Labor 2006 Sales Trends by Geography 29 CMTWRS20321013718CMTWRS3322912717CMTWRS4111138918CMTWRS16272512614ConstructionManufacturingTransportationWholesaleRetailServices/OtherCMTWRSNumbers represent percentage of sales in industry over preceding 12 months.Color represents year to date sales growthGrowingDecliningCMTWRS212315121019CMTWRS3516810724Industry Mix / Growth Legend |
|
|
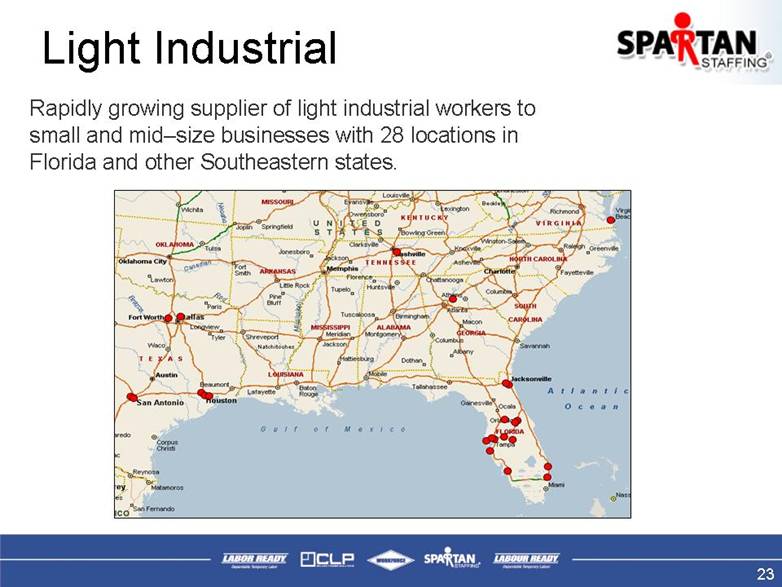
Light Industrial Rapidly growing supplier of light industrial workers to small and mid–size businesses with 28 locations in Florida and other Southeastern states. 23 |
|
|
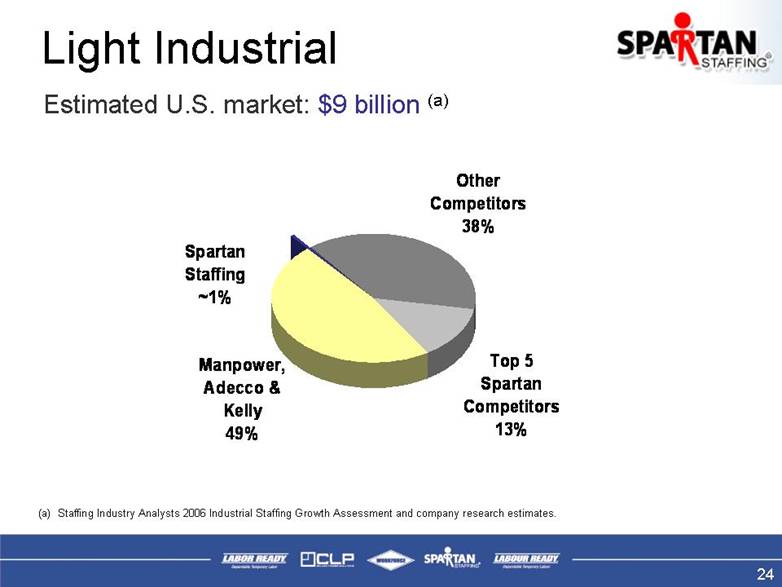
Light Industrial Estimated U.S. market: $9 billion (a) Staffing Industry Analysts 2006 Industrial Staffing Growth Assessment and company research estimates. 24 Spartan Staffing~1%Other Competitors38%Manpower, Adecco & Kelly49%Top 5 Spartan Competitors13% |
|
|
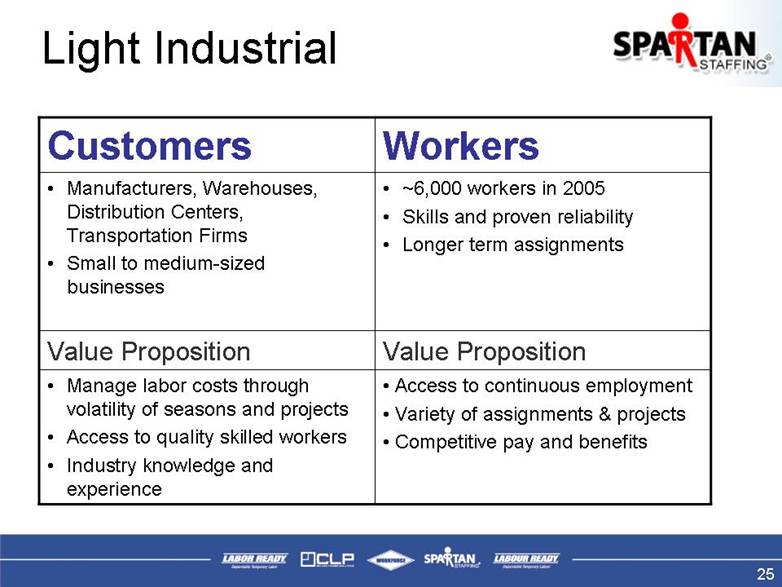
Light Industrial Access to continuous employment Variety of assignments & projects Competitive pay and benefitsManage labor costs through volatility of seasons and projects Access to quality skilled workers Industry knowledge and experience Value Proposition Value Proposition ~6,000 workers in 2005 Skills and proven reliability Longer term assignments Manufacturers, Warehouses, Distribution Centers, Transportation Firms Small to medium-sized businesses Workers Customers 25 |
|
|
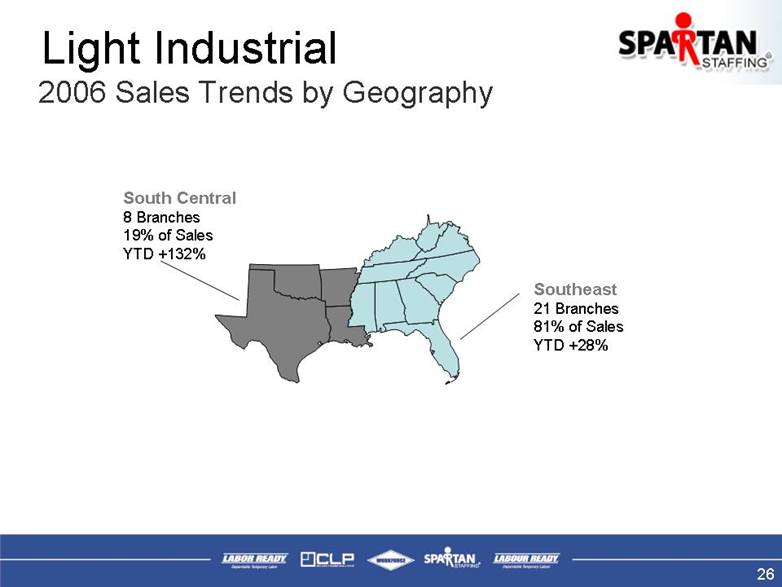
Light Industrial Southeast21 Branches 81% of Sales YTD +28% South Central8 Branches 19% of Sales YTD +132% 2006 Sales Trends by Geography 26 |
|
|
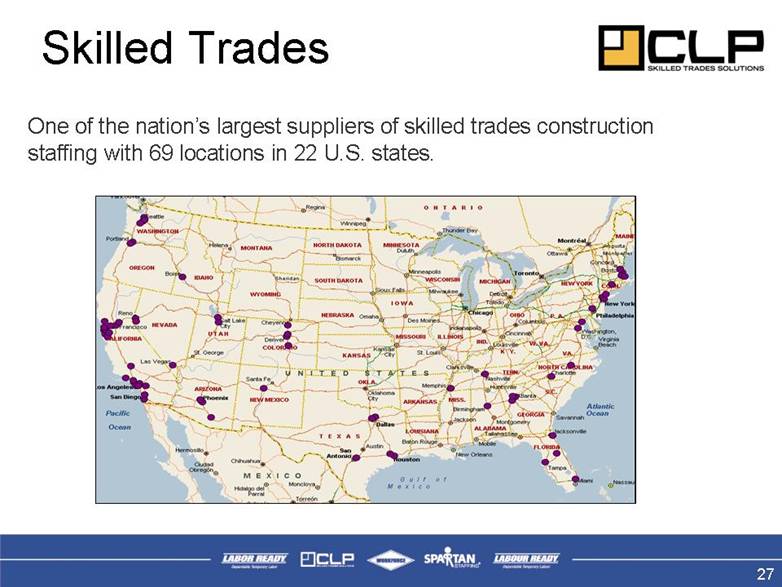
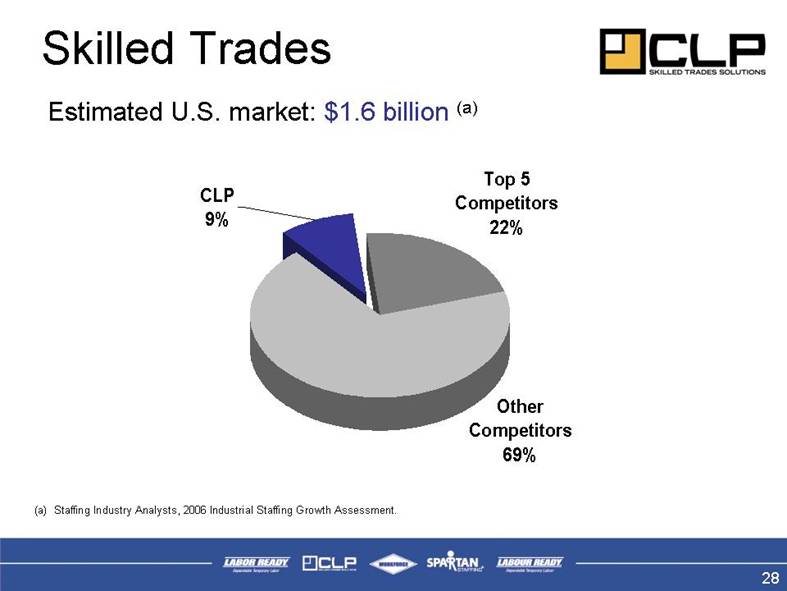
Skilled Trades One of the nation’s largest suppliers of skilled trades construction staffing with 69 locations in 22 U.S. states. 27 |
|
|
Skilled Trades Estimated U.S. market: $1.6 billion (a) Staffing Industry Analysts, 2006 Industrial Staffing Growth Assessment. Company research estimates. 28 CLP9%Top 5 Competitors22%Other Competitors 69% |
|
|
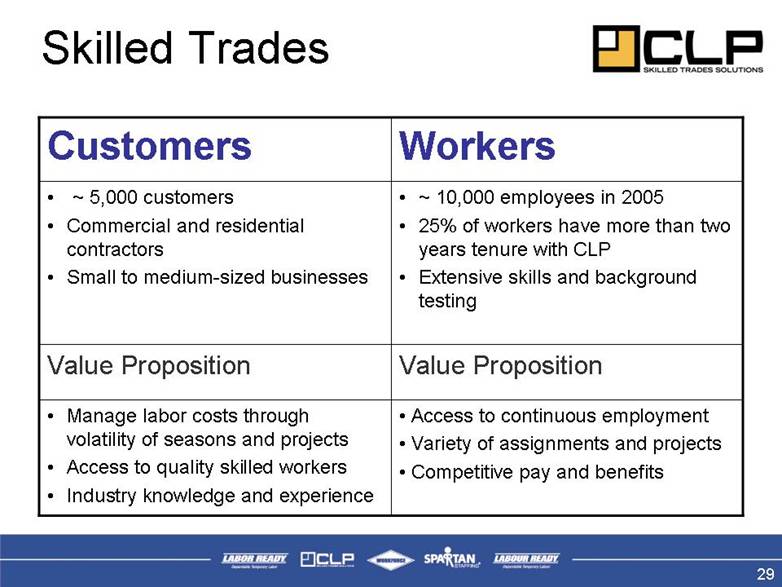
Skilled Trades Access to continuous employment Variety of assignments and projects Competitive pay and benefitsManage labor costs through volatility of seasons and projects Access to quality skilled workers Industry knowledge and experience Value Proposition Value Proposition ~ 10,000 employees in 2005 25% of workers have more than two years tenure with CLP Extensive skills and background testing ~ 5,000 customers Commercial and residential contractors Small to medium-sized businesses Workers Customers 29 |
|
|
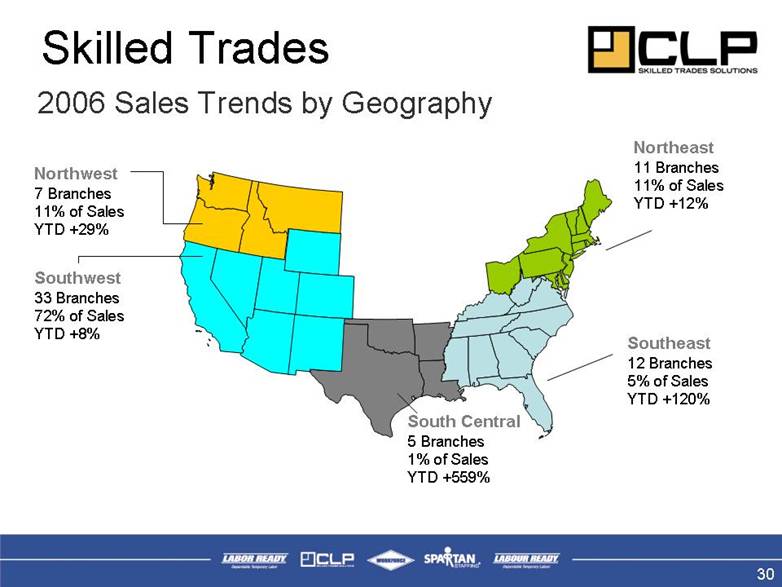
Skilled Trades Southeast12 Branches 5% of Sales YTD +120% Northeast11 Branches 11% of Sales YTD +12% Northwest7 Branches 11% of Sales YTD +29% Southwest 33 Branches 72% of Sales YTD +8% South Central5 Branches 1% of Sales YTD +559% 2006 Sales Trends by Geography 30 |
|
|
|
|
|
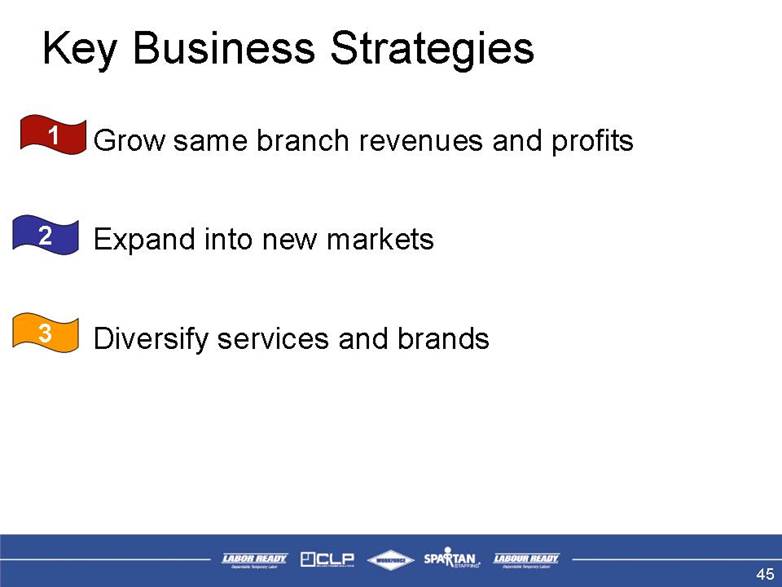
Key Business Strategies Grow same branch revenues and profits Expand into new markets Diversify services and brands 3 2 1 32 |
|
|
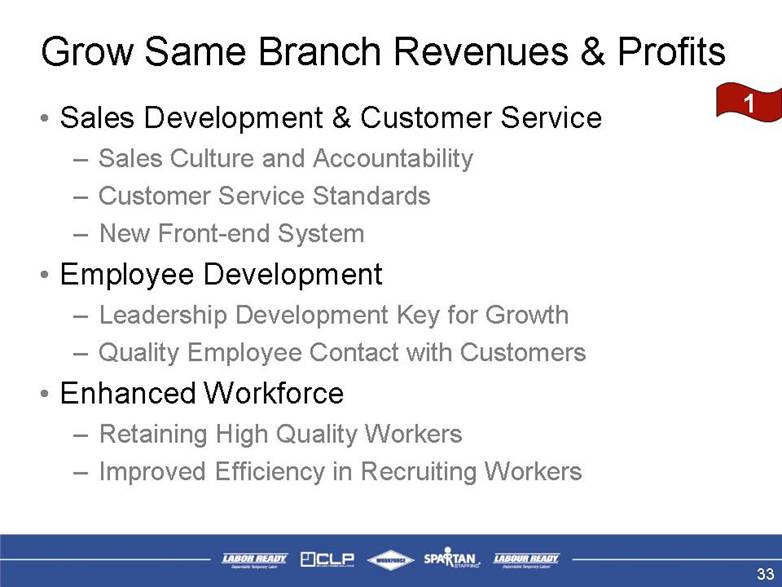
Grow Same Branch Revenues & Profits Sales Development & Customer Service Sales Culture and Accountability Customer Service Standards New Front-end System Employee Development Leadership Development Key for Growth Quality Employee Contact with Customers Enhanced Workforce Retaining High Quality Workers Improved Efficiency in Recruiting Workers 33 1 |
|
|
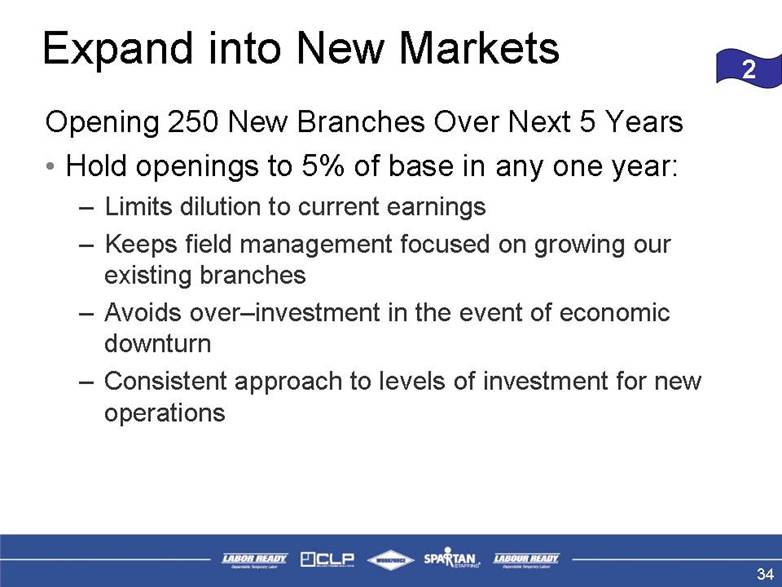
Expand into New Markets Opening 250 New Branches Over Next 5 Years Hold openings to 5% of base in any one year: Limits dilution to current earnings Keeps field management focused on growing our existing branches Avoids over–investment in the event of economic downturn Consistent approach to levels of investment for new operations 34 2 |
|
|
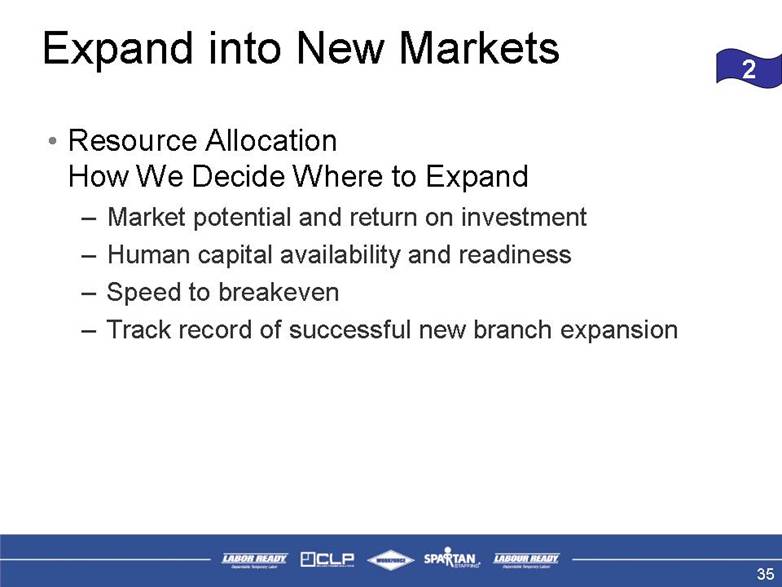
Expand into New Markets Resource Allocation How We Decide Where to Expand Market potential and return on investment Human capital availability and readiness Speed to breakeven Track record of successful new branch expansion 35 2 |
|
|
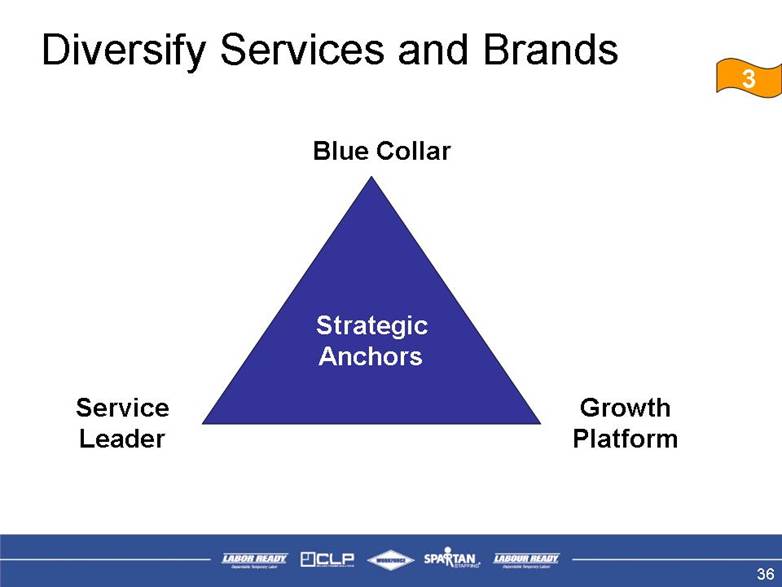
Diversify Services and BrandsStrategic Anchors Blue Collar Growth Platform Service Leader 36 3 |
|
|
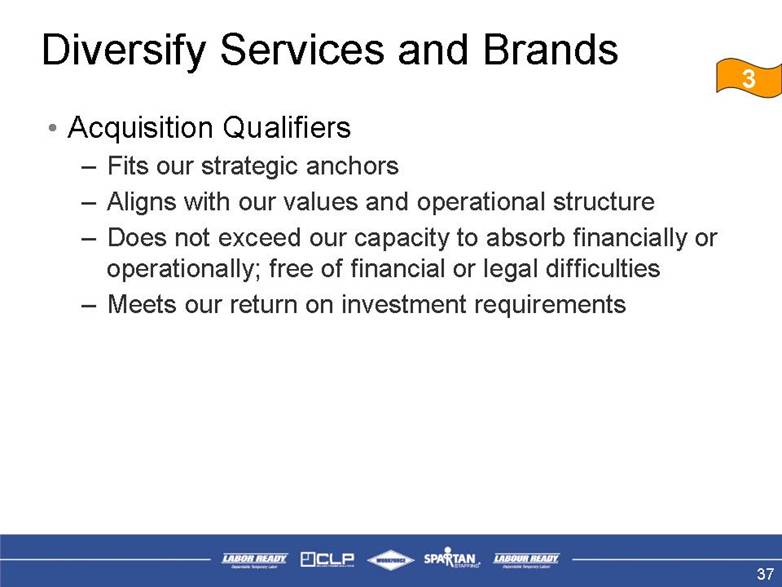
Diversify Services and BrandsAcquisition Qualifiers Fits our strategic anchors Aligns with our values and operational structure Does not exceed our capacity to absorb financially or operationally; free of financial or legal difficulties Meets our return on investment requirements 37 3 |
|
|
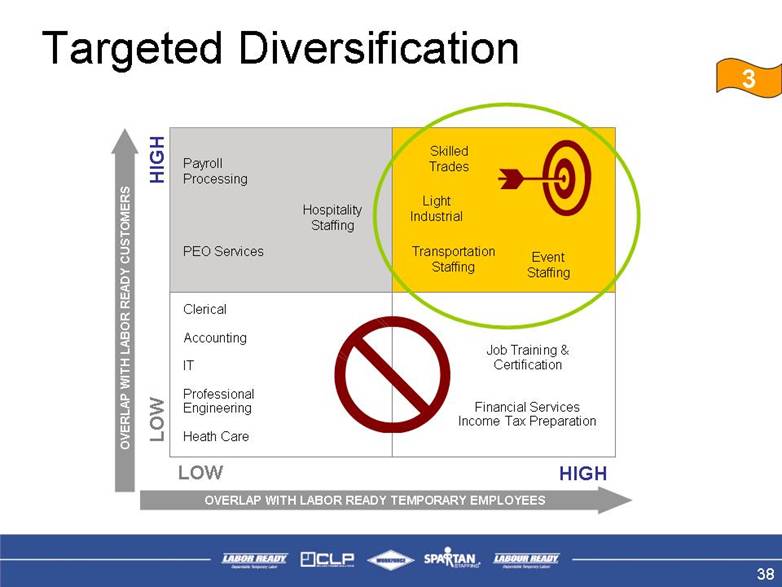
OVERLAP WITH LABOR READY CUSTOMERS OVERLAP WITH LABOR READY TEMPORARY EMPLOYEES LOW HIGH LOW HIGH Clerical Accounting IT Professional Engineering Heath Care Skilled Trades Light Industrial Event Staffing Transportation Staffing Job Training & Certification Financial Services Income Tax Preparation Payroll Processing PEO Services Hospitality Staffing Targeted Diversification 38 3 |
|
|
|
|
|
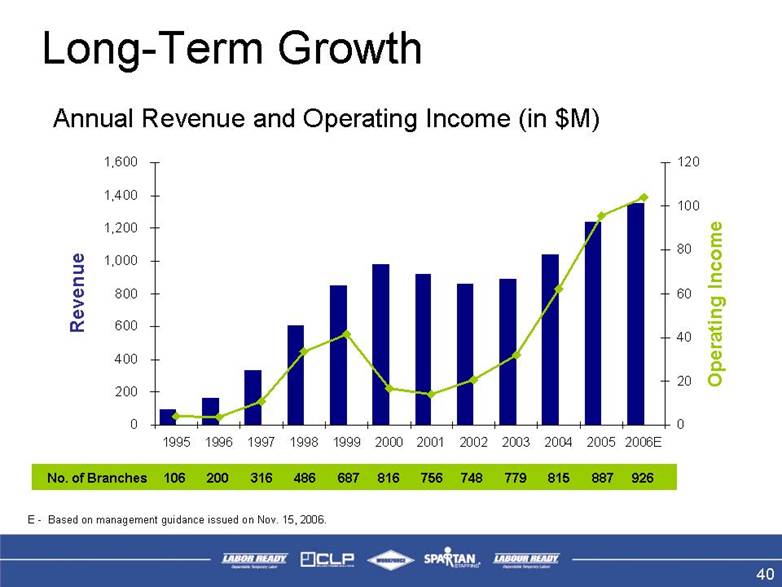
Annual Revenue and Operating Income (in $M) Revenue Operating Income No. of Branches106 200 316 486 687 816 756 748 779 815 887 926 Long-Term Growth 40 E - Based on management guidance issued on Nov. 15, 2006. 02004006008001,0001,2001,4001,600199519961997199819992000200120022003200420052006E020406080100120 |
|
|
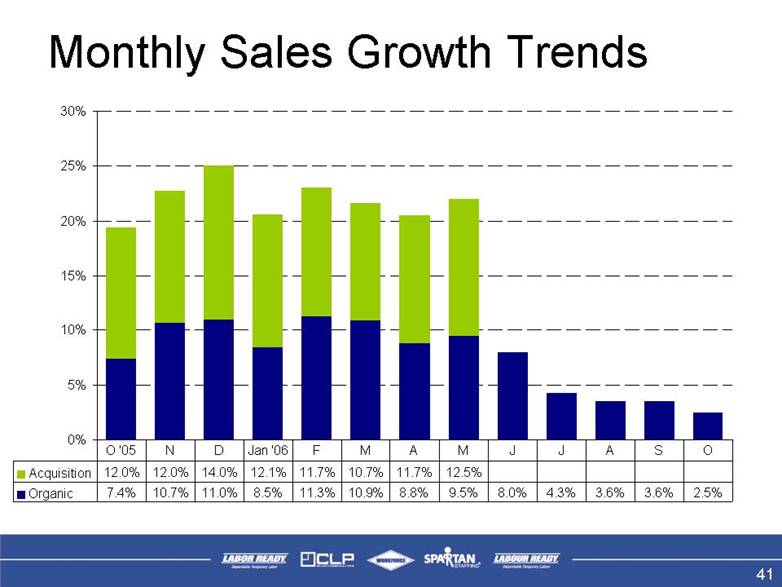
Monthly Sales Growth Trends 41 0%5%10%15%20%25%30%Acquisition12.0%12.0%14.0%12.1%11.7%10.7%11.7%12.5%Organic7.4%10.7%11.0%8.5%11.3%10.9%8.8%9.5%8.0%4.3%3.6%3.6%2.5%O '05NDJan '06FMAMJJASO |
|
|
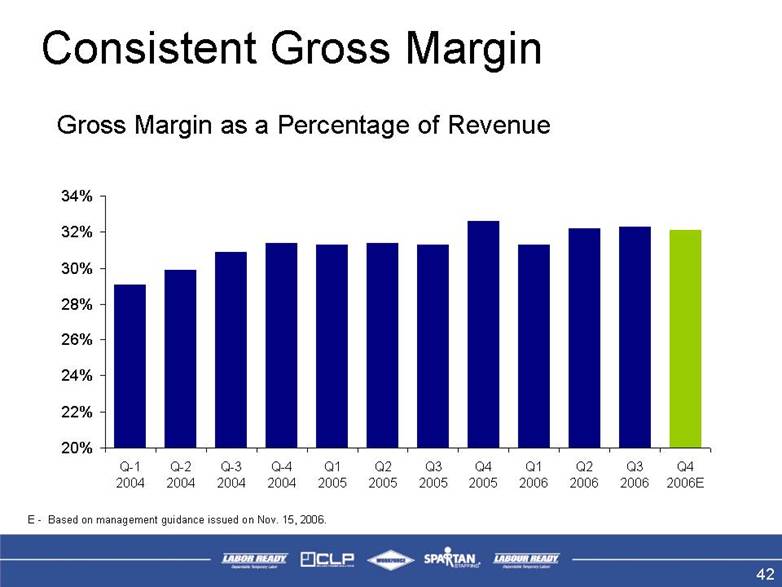
Consistent Gross Margin Gross Margin as a Percentage of Revenue 42 E - Based on management guidance issued on Nov. 15, 2006. 20%22%24%26%28%30%32%34%Q-12004Q-22004Q-32004Q-42004Q12005Q22005Q32005Q42005Q12006Q22006Q32006Q42006E |
|
|
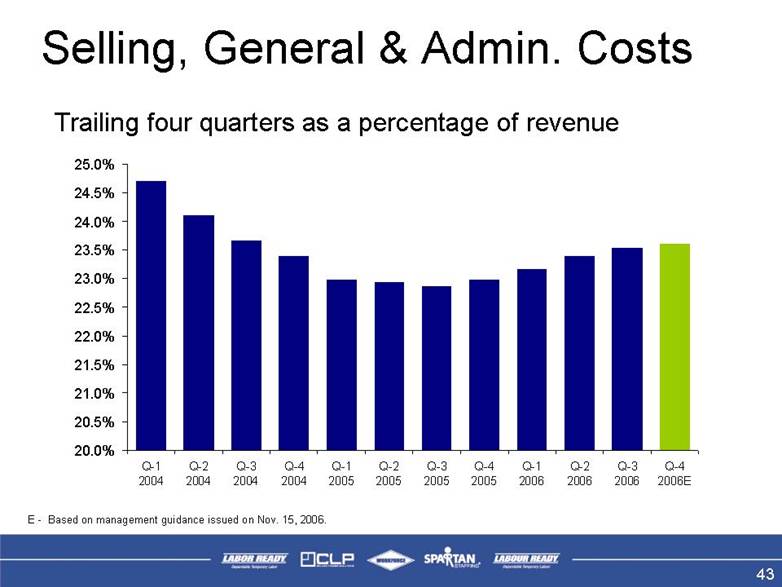
Selling, General & Admin. Costs Trailing four quarters as a percentage of revenue 43 E - Based on management guidance issued on Nov. 15, 2006. 20.0%20.5%21.0%21.5%22.0%22.5%23.0%23.5%24.0%24.5%25.0%Q-12004Q-22004Q-32004Q-42004Q-12005Q-22005Q-32005Q-42005Q-12006Q-22006Q-32006Q-42006E |
|
|
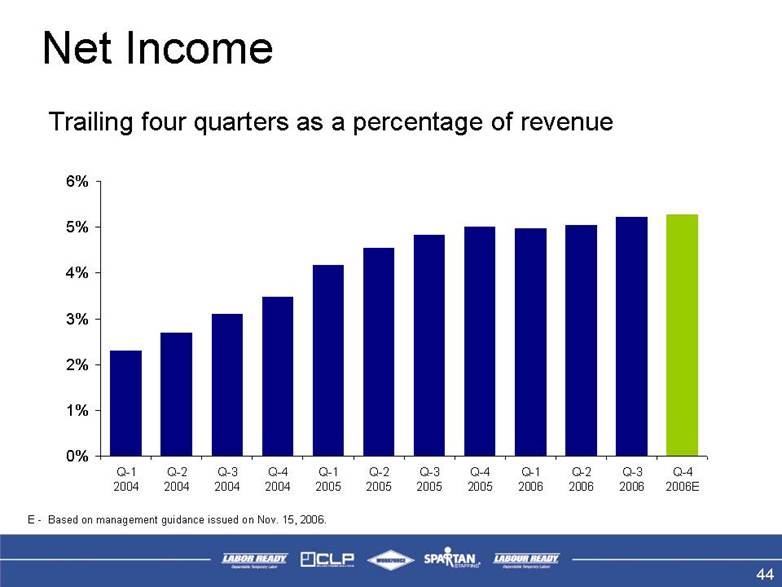
Net Income Trailing four quarters as a percentage of revenue 44 E - Based on management guidance issued on Nov. 15, 2006. 0%1%2%3%4%5%6%Q-12004Q-22004Q-32004Q-42004Q-12005Q-22005Q-32005Q-42005Q-12006Q-22006Q-32006Q-42006E |
|
|
Key Business Strategies Grow same branch revenues and profits Expand into new markets Diversify services and brands 3 2 1 45 |
|
|
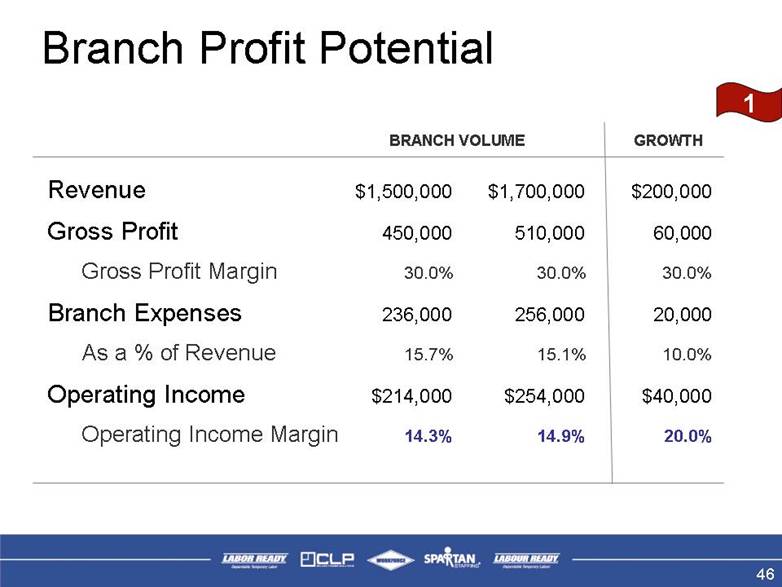
BRANCH VOLUME Branch Profit Potential Revenue $1,500,000 $1,700,000 $200,000 Gross Profit450,000 510,000 60,000 Gross Profit Margin30.0% 30.0% 30.0% Branch Expenses236,000 256,000 20,000 As a % of Revenue15.7% 15.1% 10.0% Operating Income$214,000 $254,000 $40,000Operating Income Margin14.3% 14.9% 20.0% 46 GROWTH 1 |
|
|
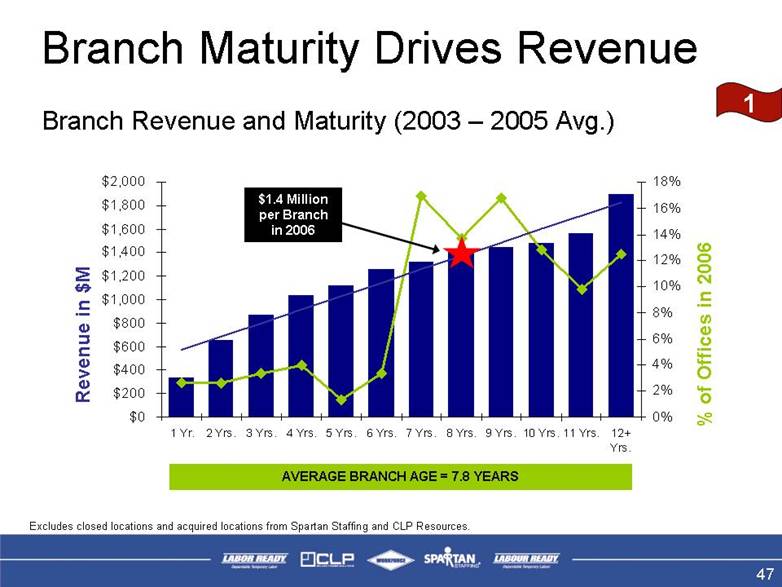
AVERAGE BRANCH AGE = 7.8 YEARS Revenue in $M % of Offices in 2006 $1.4 Million per Branch in 2006 Excludes closed locations and acquired locations from Spartan Staffing and CLP Resources. Branch Maturity Drives Revenue Branch Revenue and Maturity (2003 – 2005 Avg.) 47 1 $0$200$400$600$800$1,000$1,200$1,400$1,600$1,800$2,0001 Yr. 2 Yrs. 3 Yrs. 4 Yrs. 5 Yrs. 6 Yrs. 7 Yrs. 8 Yrs. 9 Yrs.10 Yrs.11 Yrs.12+Yrs.0%2%4%6%8%10%12%14%16%18% |
|
|
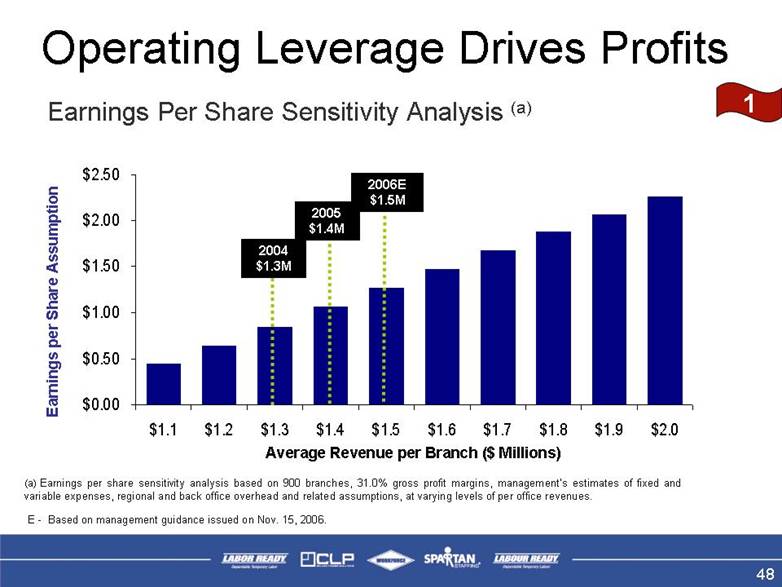
(a) Earnings per share sensitivity analysis based on 900 branches, 31.0% gross profit margins, management’s estimates of fixed and variable expenses, regional and back office overhead and related assumptions, at varying levels of per office revenues. 2004 $1.3M Earnings per Share Assumption Average Revenue per Branch ($ Millions) Operating Leverage Drives Profits Earnings Per Share Sensitivity Analysis (a) 2005 $1.4M 2006E $1.5M 48 1 E - Based on management guidance issued on Nov. 15, 2006. $0.00$0.50$1.00$1.50$2.00$2.50$1.1$1.2$1.3$1.4$1.5$1.6$1.7$1.8$1.9$2.0 |
|
|
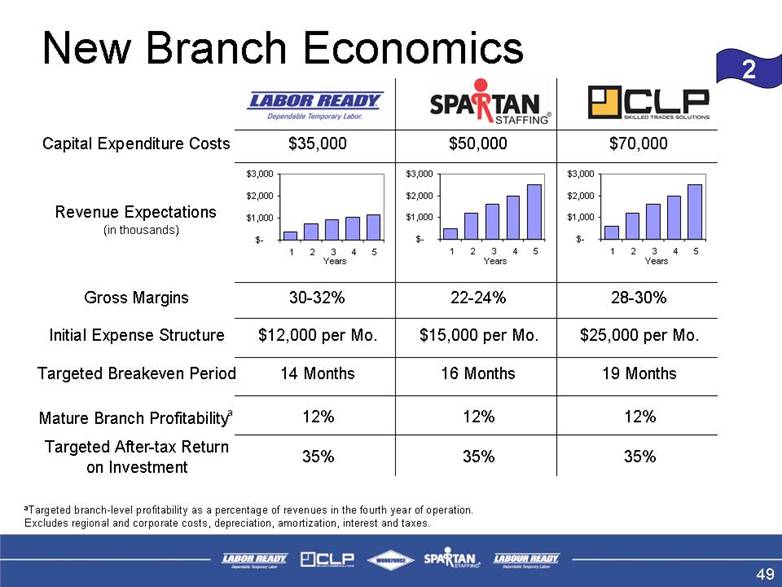
New Branch Economics aTargeted branch-level profitability as a percentage of revenues in the fourth year of operation. Excludes regional and corporate costs, depreciation, amortization, interest and taxes.Capital Expenditure Costs$35,000$50,000$70,000Revenue Expectations(in thousands)Gross Margins30-32%22-24%28-30%Initial Expense Structure$12,000 per Mo.$15,000 per Mo.$25,000 per Mo.Targeted Breakeven Period14 Months16 Months19 MonthsMature Branch Profitabilitya12%12%12%Targeted After-tax Return on Investment35%35%35%$-$1,000$2,000$3,00012345Years$-$1,000$2,000$3,00012345Years$-$1,000$2,000$3,00012345Years49 2 |
|
|
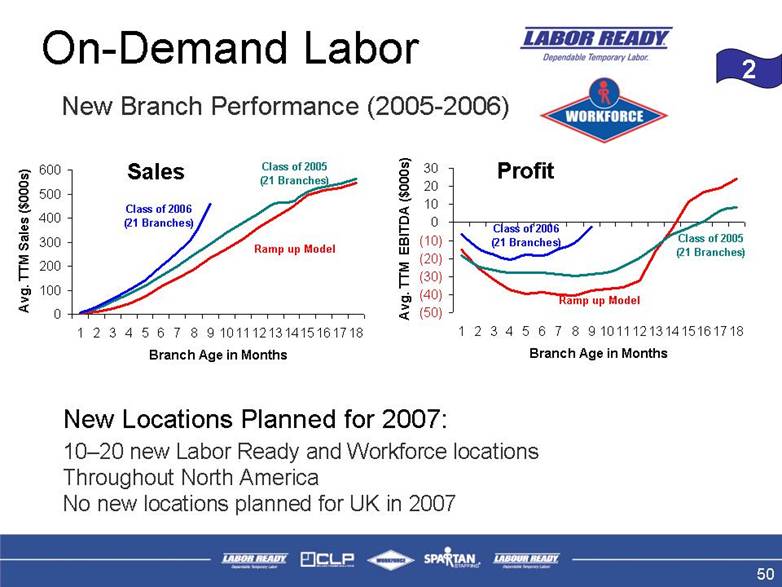
On-Demand Labor New Locations Planned for 2007: 10–20 new Labor Ready and Workforce locations Throughout North America No new locations planned for UK in 2007 New Branch Performance (2005-2006) Sales Profit 50 2 0100200300400500600123456789101112131415161718Branch Age in MonthsAvg. TTM Sales ($000s)Class of 2006(21 Branches)Class of 2005(21 Branches)Ramp up Model(50)(40)(30)(20)(10)0102030123456789101112131415161718Branch Age in MonthsAvg. TTM EBITDA ($000s)Class of 2006(21 Branches)Class of 2005(21 Branches)Ramp up Model |
|
|
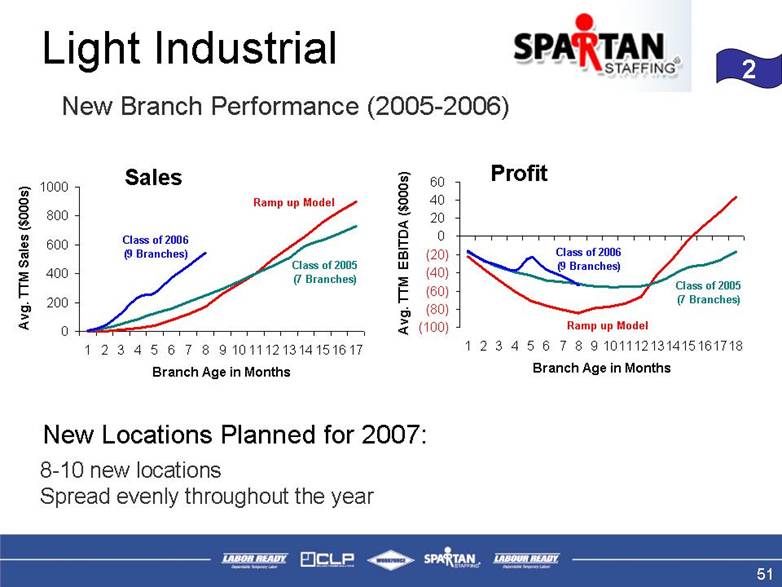
Light Industrial New Locations Planned for 2007: 8-10 new locations Spread evenly throughout the year Sales Profit 51 2 New Branch Performance (2005-2006) 020040060080010001234567891011121314151617Branch Age in MonthsAvg. TTM Sales ($000s)Class of 2006(9 Branches)Class of 2005(7 Branches)Ramp up Model(100)(80)(60)(40)(20)0204060123456789101112131415161718Branch Age in MonthsAvg. TTM EBITDA ($000s)Class of 2006(9 Branches)Class of 2005(7 Branches)Ramp up Model |
|
|
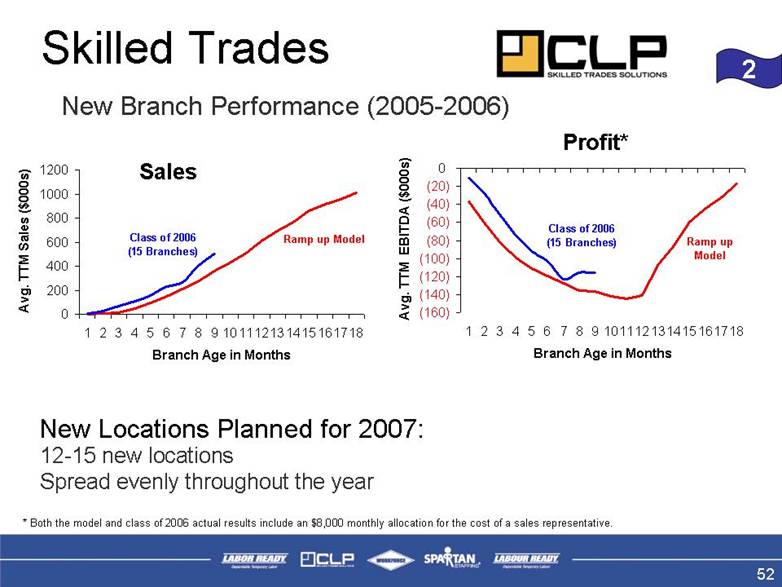
Skilled Trades 12-15 new locations Spread evenly throughout the year New Locations Planned for 2007: Sales Profit* * Both the model and class of 2006 actual results include an $8,000 monthly allocation for the cost of a sales representative. 52 2 New Branch Performance (2005-2006) 020040060080010001200123456789101112131415161718Branch Age in MonthsAvg. TTM Sales ($000s)Class of 2006(15 Branches)Ramp up Model(160)(140)(120)(100)(80)(60)(40)(20)0123456789101112131415161718Branch Age in MonthsAvg. TTM EBITDA ($000s)Class of 2006(15 Branches)Ramp up Model |
|
|
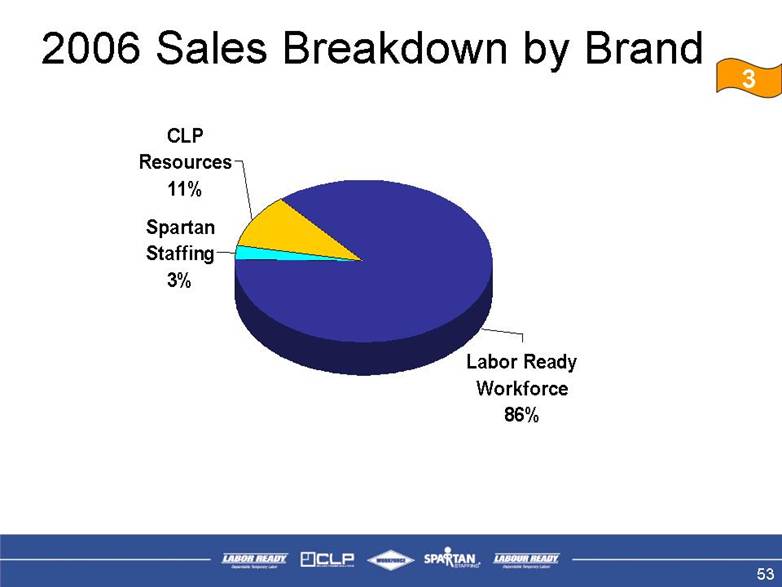
2006 Sales Breakdown by Brand 53 3 Spartan Staffing3%CLP Resources11%Labor Ready Workforce86% |
|
|
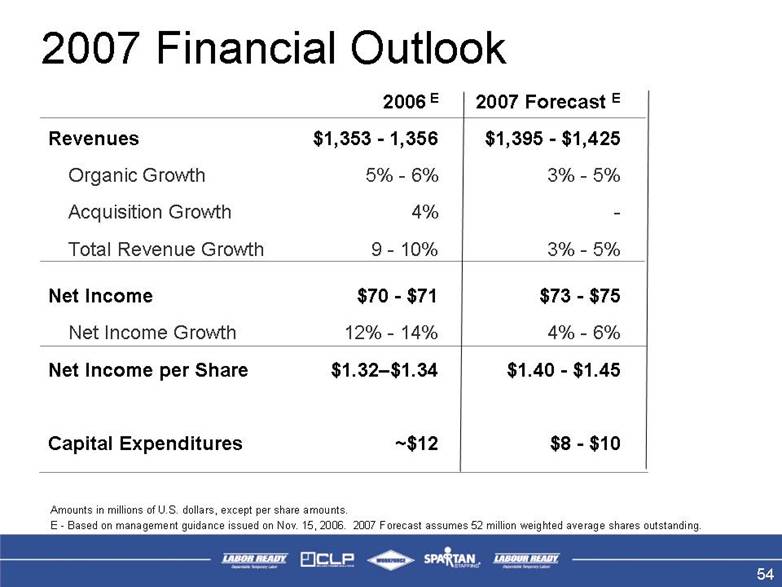
2007 Financial Outlook 2006 E2007 Forecast E Revenues $1,353 - 1,356 $1,395 - $1,425 Organic Growth 5% - 6% 3% - 5% Acquisition Growth 4% - Total Revenue Growth 9 - 10% 3% - 5% Net Income $70 - $71 $73 - $75 Net Income Growth 12% - 14% 4% - 6% Net Income per Share $1.32–$1.34 $1.40 - $1.45 Capital Expenditures ~$12 $8 - $10 Amounts in millions of U.S. dollars, except per share amounts. E - Based on management guidance issued on Nov. 15, 2006. 2007 Forecast assumes 52 million weighted average shares outstanding. 54 |
|
|
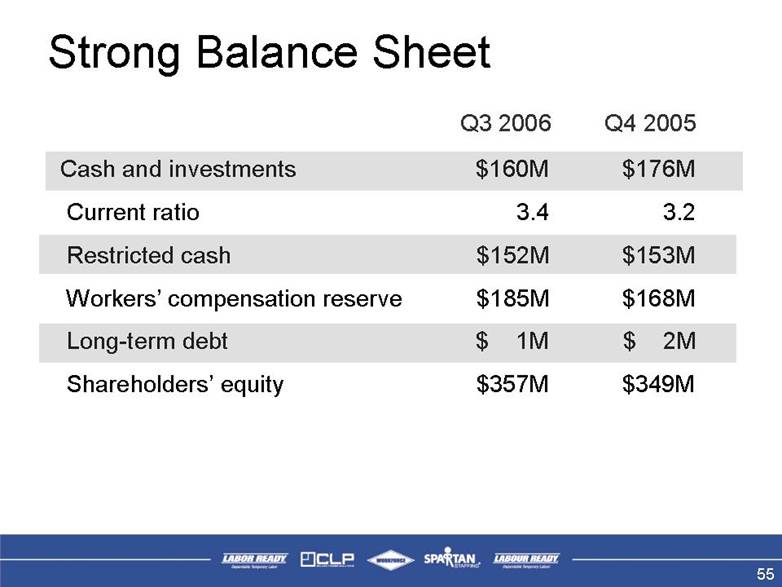
Strong Balance Sheet Cash and investments $160M $176M Current ratio 3.4 3.2 Restricted cash $152M $153M Workers’ compensation reserve $185M $168M Long-term debt $ 1M $ 2M Shareholders’ equity $357M $349M Q3 2006 Q4 2005 55 |
|
|
Investment Highlights Service leader in blue-collar staffing Favorable demographic trends Growth platforms in place for two specialty niches Industry-leading return on assets and equity Available capital to invest in additional growth platforms Significant share repurchase program Labor Ready is the service leader in on-demand blue collar staffing with promising growth platforms in place for skilled trades and light industrial staffing. 56 |