Exhibit 99.2

Link to searchable text of slide shown above
Link to searchable text of slide shown above

Link to searchable text of slide shown above
Link to searchable text of slide shown above
Link to searchable text of slide shown above
Link to searchable text of slide shown above
Link to searchable text of slide shown above
Link to searchable text of slide shown above
Link to searchable text of slide shown above
Link to searchable text of slide shown above
Link to searchable text of slide shown above
Link to searchable text of slide shown above
Link to searchable text of slide shown above
Link to searchable text of slide shown above
Link to searchable text of slide shown above
Link to searchable text of slide shown above
Link to searchable text of slide shown above
Link to searchable text of slide shown above
Link to searchable text of slide shown above
Link to searchable text of slide shown above
Link to searchable text of slide shown above
Link to searchable text of slide shown above
Link to searchable text of slide shown above
Link to searchable text of slide shown above
Link to searchable text of slide shown above

Link to searchable text of slide shown above
Link to searchable text of slide shown above
Link to searchable text of slide shown above
Link to searchable text of slide shown above
Link to searchable text of slide shown above
Link to searchable text of slide shown above
Link to searchable text of slide shown above
Link to searchable text of slide shown above
Link to searchable text of slide shown above
Link to searchable text of slide shown above
Link to searchable text of slide shown above
Link to searchable text of slide shown above
Link to searchable text of slide shown above
Link to searchable text of slide shown above
Link to searchable text of slide shown above
Link to searchable text of slide shown above
Link to searchable text of slide shown above
Link to searchable text of slide shown above
Link to searchable text of slide shown above
Link to searchable text of slide shown above
Link to searchable text of slide shown above
Link to searchable text of slide shown above
Link to searchable text of slide shown above
Link to searchable text of slide shown above
Link to searchable text of slide shown above
Link to searchable text of slide shown above
Link to searchable text of slide shown above
Link to searchable text of slide shown above
Link to searchable text of slide shown above
Link to searchable text of slide shown above
Link to searchable text of slide shown above
Searchable text section of graphics shown above
Labor Ready Analyst Day
[GRAPHIC]
LABOR READY WE PUT PEOPLE TO WORK
Safe Harbor Statement
Cautionary Note about Forward–Looking Statements
Certain statements made by us in this presentation that are not historical facts or that relate to future plans, events or performances are forward–looking statements within the meaning of the federal securities laws. Our actual results may differ materially from those expressed in any forward–looking statements made by us. Forward-looking statements involve a number of risks and uncertainties including, but not limited to, the risks described in the Company’s most recent 10–K and 10–Q filings. All forward-looking statements are qualified by those risk factors.
1
Introduction to Directors
Bob Sullivan
Chairman
Keith Grinstein
Gates McKibbin
Joe Sambataro
Bill Steele
2
Management Team
Joe Sambataro
CEO
Steve Cooper
President & CFO
Bob Breen
VP, Strategic Planning
Chris Burger
Regional VP, Operations
Jim Defebaugh
VP & General Counsel
Derrek Gafford
VP, Finance
Yolanda Hubbard
VP, National Sales & Marketing
Wayne Larkin
Regional VP, Operations
Gary North
Regional VP, Operations
Billie Otto
VP, Chief Information Officer
Noel Wheeler
President & CEO, CLP Resources
3
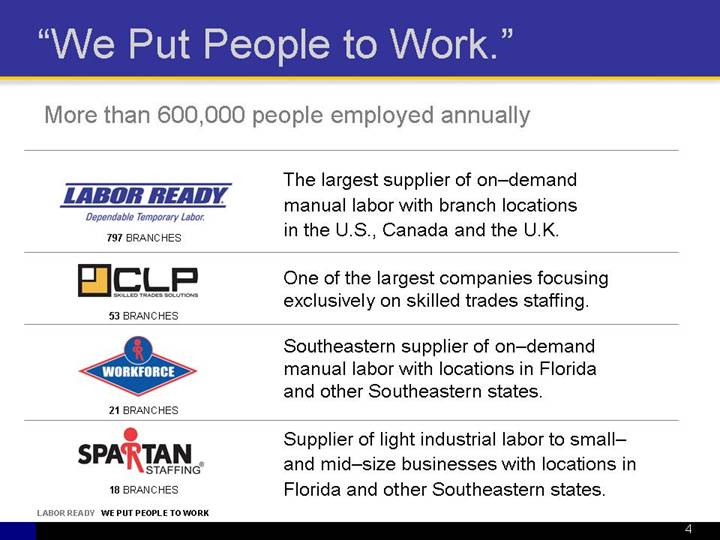
“We Put People to Work.”
More than 600,000 people employed annually
|
[LOGO] |
|
The largest supplier of on–demand manual labor with branch locations in the U.S., Canada and the U.K. |
|
|
|
|
|
[LOGO] |
|
One of the largest companies focusing exclusively on skilled trades staffing. |
|
|
|
|
|
[LOGO] |
|
Southeastern supplier of on–demand manual labor with locations in Florida and other Southeastern states. |
|
|
|
|
|
[LOGO] |
|
Supplier of light industrial labor to small– and mid–size businesses with locations in Florida and other Southeastern states. |
4
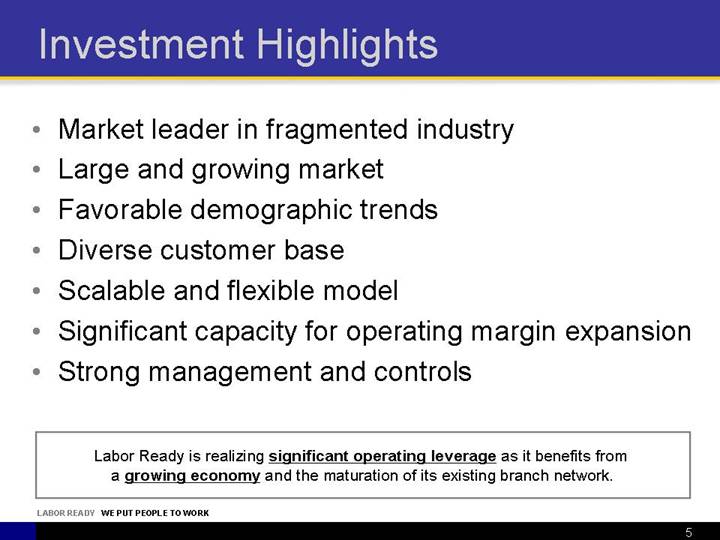
Investment Highlights
• Market leader in fragmented industry
• Large and growing market
• Favorable demographic trends
• Diverse customer base
• Scalable and flexible model
• Significant capacity for operating margin expansion
• Strong management and controls
Labor Ready is realizing significant operating leverage as it benefits from a growing economy and the maturation of its existing branch network.
5
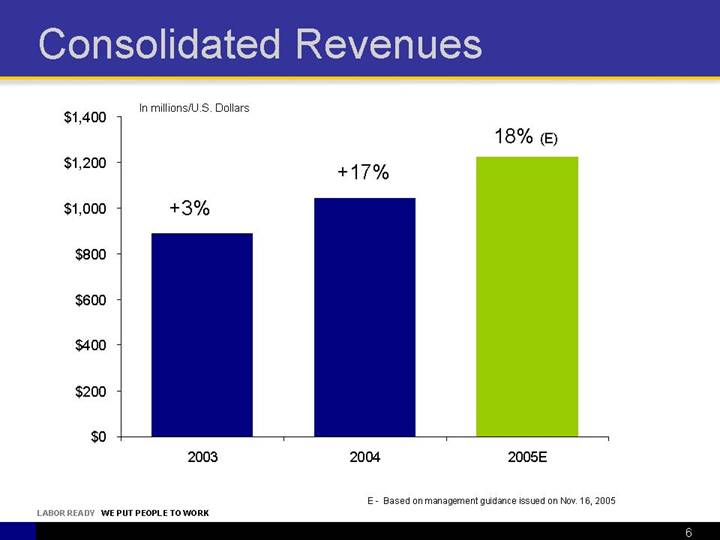
Consolidated Revenues
[CHART]
(E) - Based on management guidance issued on Nov. 16, 2005
6
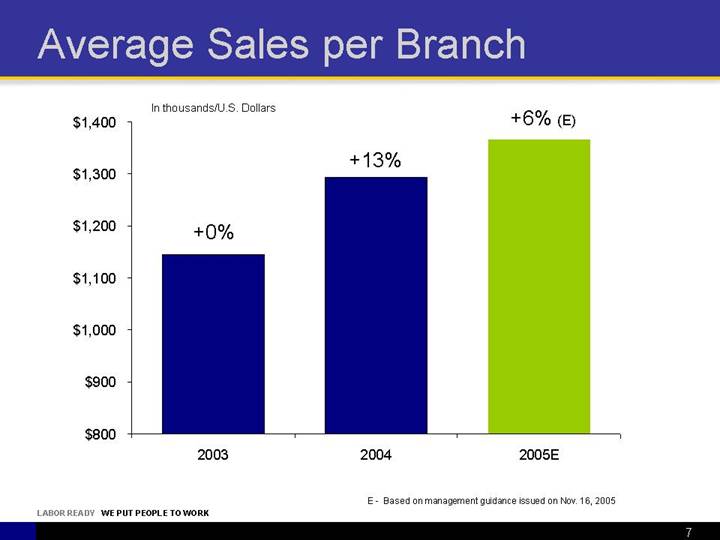
Average Sales per Branch
[CHART]
(E) - Based on management guidance issued on Nov. 16, 2005
7
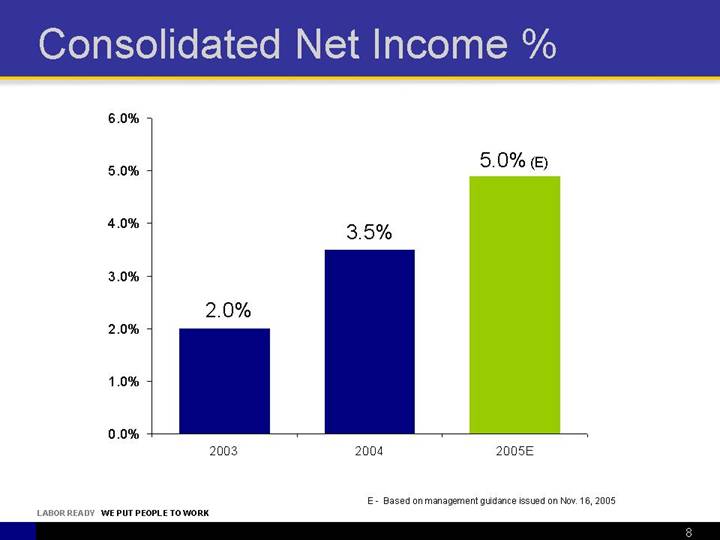
Consolidated Net Income %
[CHART]
(E) - Based on management guidance issued on Nov. 16, 2005
8
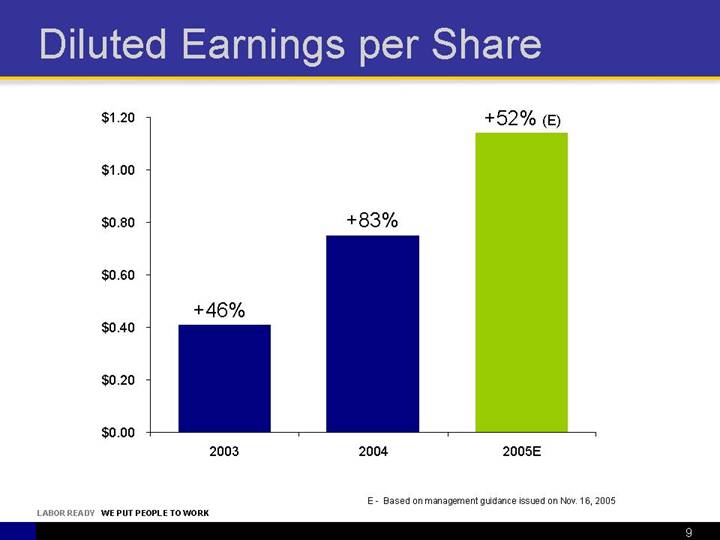
Diluted Earnings per Share
[CHART]
(E) - Based on management guidance issued on Nov. 16, 2005
9
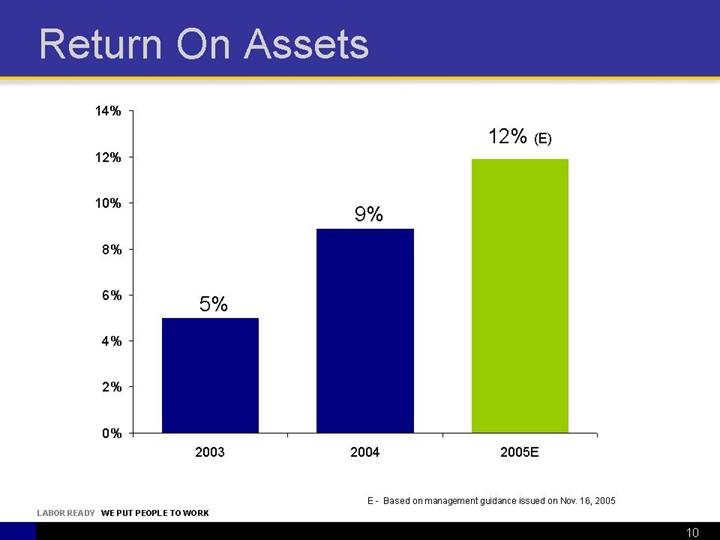
Return On Assets
[CHART]
(E) - Based on management guidance issued on Nov. 16, 2005
10
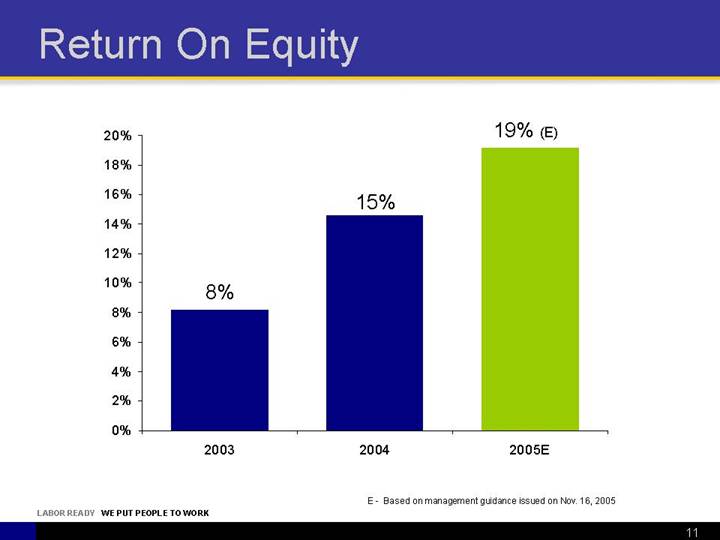
Return On Equity
[CHART]
(E) - Based on management guidance issued on Nov. 16, 2005
11
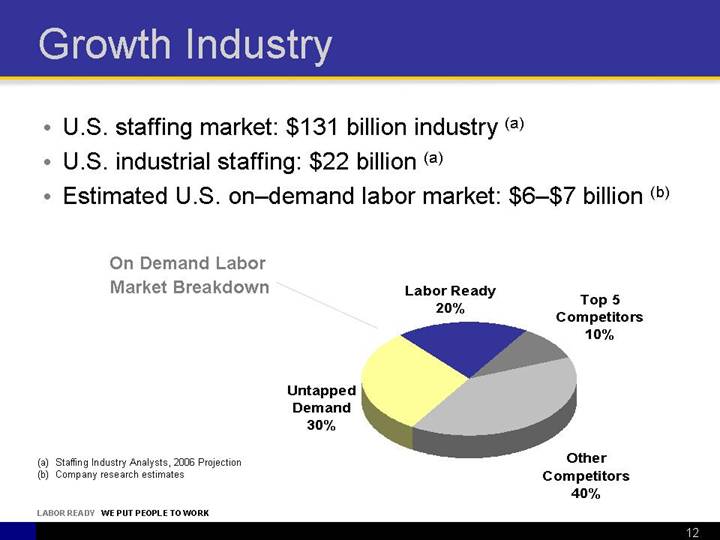
Growth Industry
• U.S. staffing market: $131 billion industry (a)
• U.S. industrial staffing: $22 billion (a)
• Estimated U.S. on–demand labor market: $6–$7 billion (b)
On Demand
Labor
Market Breakdown
[CHART]
(a) Staffing Industry Analysts, 2006 Projection
(b) Company research estimates
12
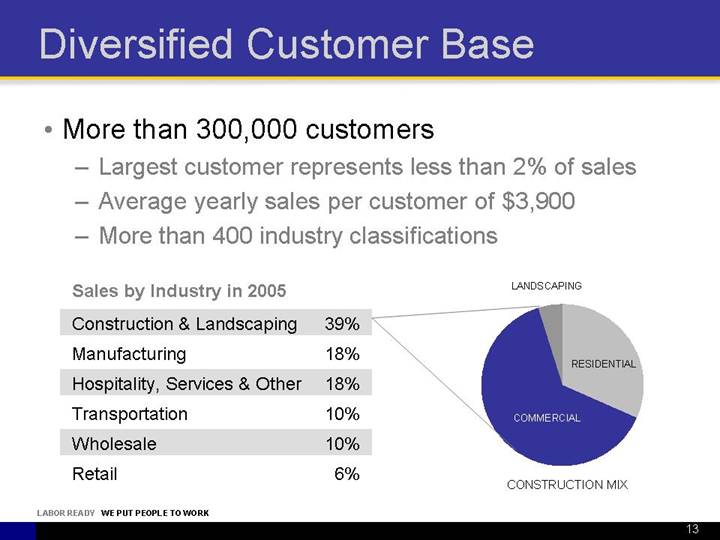
Diversified Customer Base
• More than 300,000 customers
• Largest customer represents less than 2% of sales
• Average yearly sales per customer of $3,900
• More than 400 industry classifications
Sales by Industry in 2005
|
Construction & Landscaping |
|
39 |
% |
|
Manufacturing |
|
18 |
% |
|
Hospitality, Services & Other |
|
18 |
% |
|
Transportation |
|
10 |
% |
|
Wholesale |
|
10 |
% |
|
Retail |
|
6 |
% |
[CHART]
13
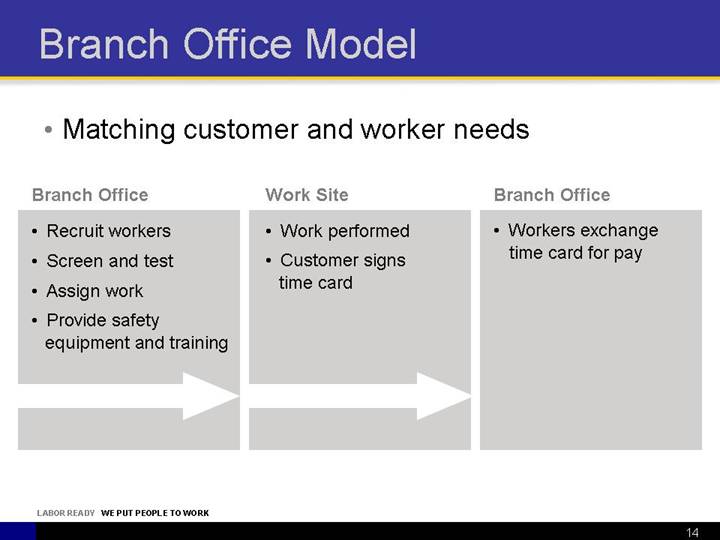
Branch Office Model
• Matching customer and worker needs
|
Branch Office |
|
Work Site |
|
Branch Office |
|
• Recruit workers |
|
• Work performed |
|
• Workers exchange time card for pay |
|
• Screen and test |
|
• Customer signs time card |
|
|
|
• Assign work |
|
|
|
|
|
• Provide safety equipment and training |
|
|
|
|
14
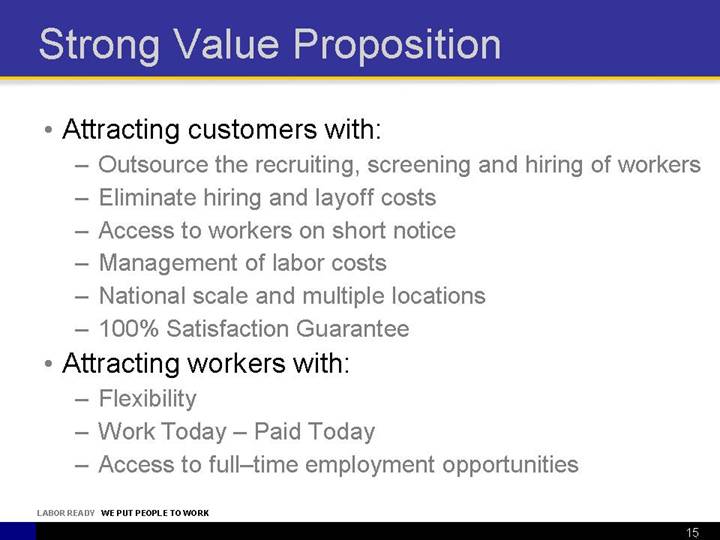
Strong Value Proposition
• Attracting customers with:
• Outsource the recruiting, screening and hiring of workers
• Eliminate hiring and layoff costs
• Access to workers on short notice
• Management of labor costs
• National scale and multiple locations
• 100% Satisfaction Guarantee
• Attracting workers with:
• Flexibility
• Work Today – Paid Today
• Access to full–time employment opportunities
15
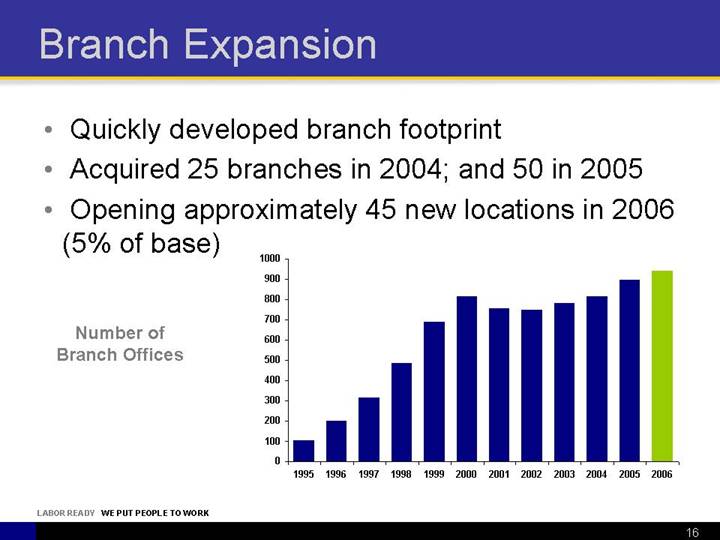
Branch Expansion
• Quickly developed branch footprint
• Acquired 25 branches in 2004; and 50 in 2005
• Opening approximately 45 new locations in 2006 (5% of base)
Number of Branch Offices
[CHART]
16
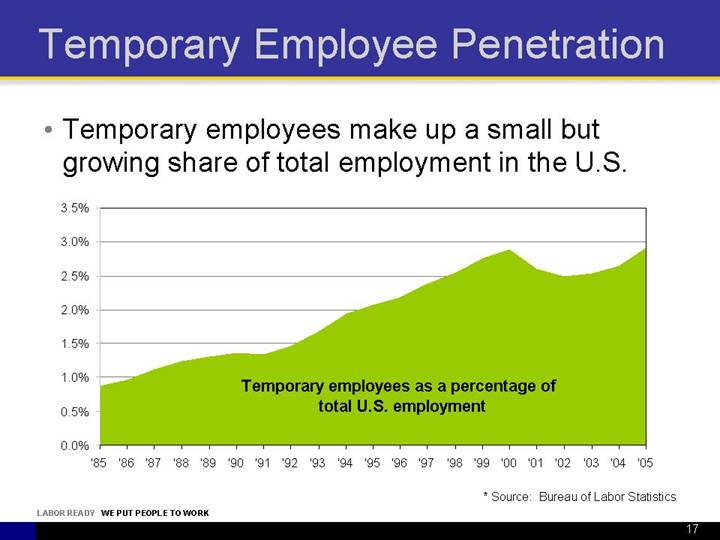
Temporary Employee Penetration
• Temporary employees make up a small but growing share of total employment in the U.S.
[CHART]
* Source: Bureau of Labor Statistics
17
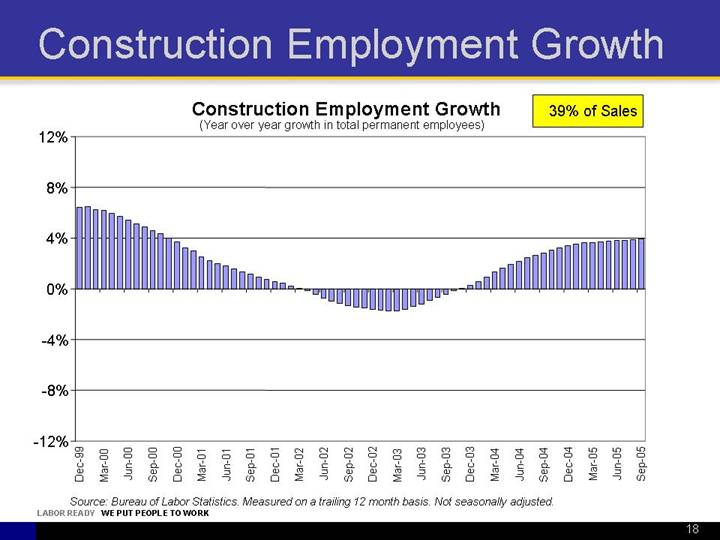
Construction Employment Growth
Construction Employment Growth
(Year over year growth in total permanent employees)
39% of Sales
[CHART]
Source: Bureau of Labor Statistics. Measured on a trailing 12 month basis. Not seasonally adjusted.
18
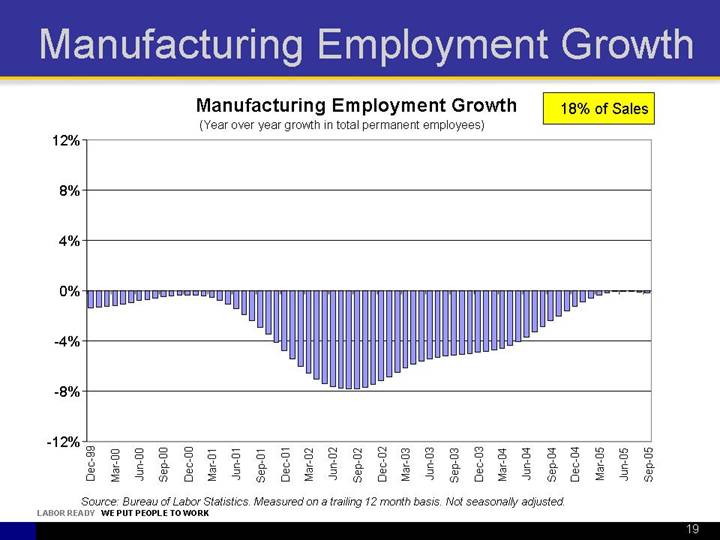
Manufacturing Employment Growth
Manufacturing Employment Growth
(Year over year growth in total permanent employees)
18% of Sales
[CHART]
Source: Bureau of Labor Statistics. Measured on a trailing 12 month basis. Not seasonally adjusted.
19
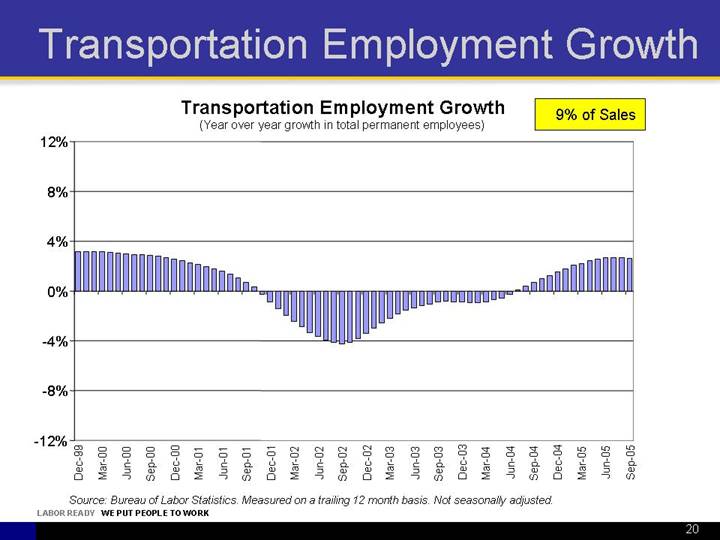
Transportation Employment Growth
Transportation Employment Growth
(Year over year growth in total permanent employees)
9% of Sales
[CHART]
Source: Bureau of Labor Statistics. Measured on a trailing 12 month basis. Not seasonally adjusted.
20
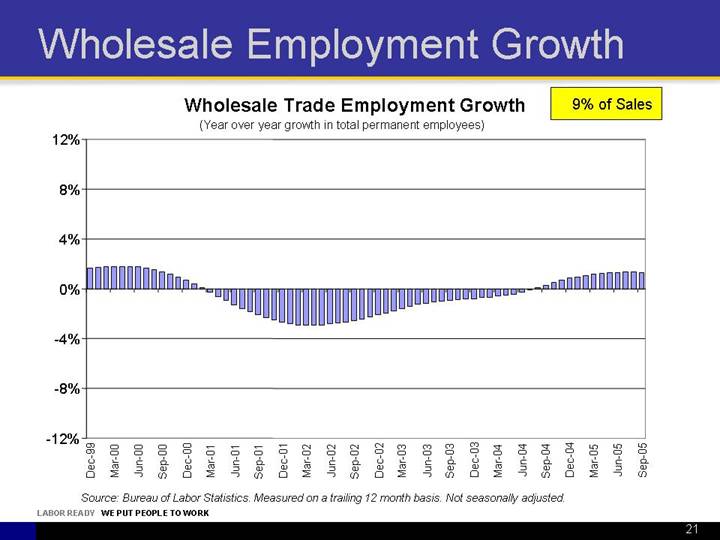
Wholesale Employment Growth
Wholesale Trade Employment Growth
(Year over year growth in total permanent employees)
9% of Sales
[CHART]
Source: Bureau of Labor Statistics. Measured on a trailing 12 month basis. Not seasonally adjusted.
21
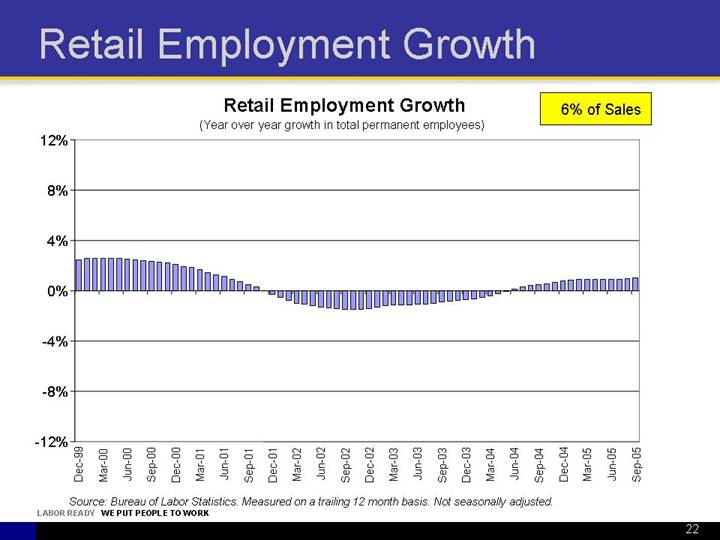
Retail Employment Growth
Retail Employment Growth
(Year over year growth in total permanent employees)
6% of Sales
[CHART]
Source: Bureau of Labor Statistics. Measured on a trailing 12 month basis. Not seasonally adjusted.
22
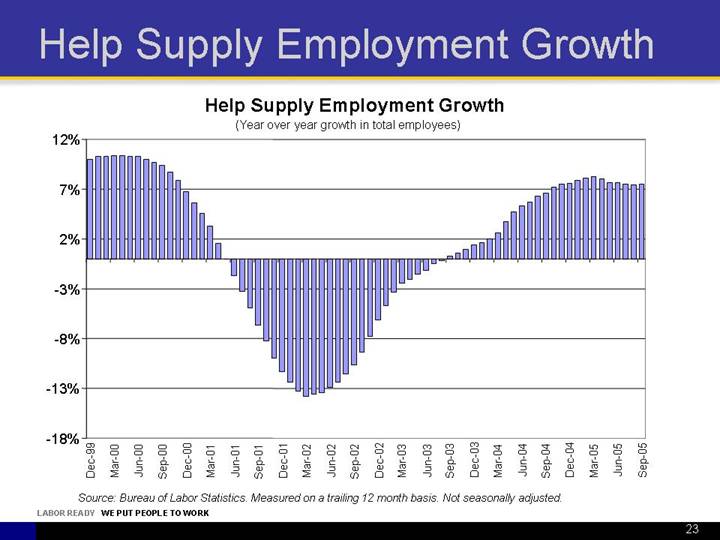
Help Supply Employment Growth
Help Supply Employment Growth
(Year over year growth in total employees)
[CHART]
Source: Bureau of Labor Statistics. Measured on a trailing 12 month basis. Not seasonally adjusted.
23
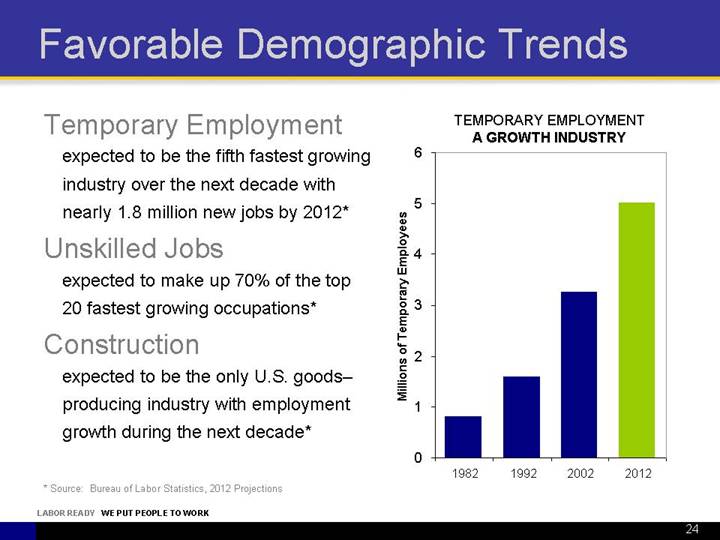
Favorable Demographic Trends
Temporary Employment
expected to be the fifth fastest growing industry over the next decade with nearly 1.8 million new jobs by 2012*
Unskilled Jobs
expected to make up 70% of the top 20 fastest growing occupations*
Construction
expected to be the only U.S. goods–producing industry with employment growth during the next decade*
TEMPORARY EMPLOYMENT
A GROWTH INDUSTRY
[CHART]
* Source: Bureau of Labor Statistics, 2012 Projections
24
Business
Strategies
and
Financial Update
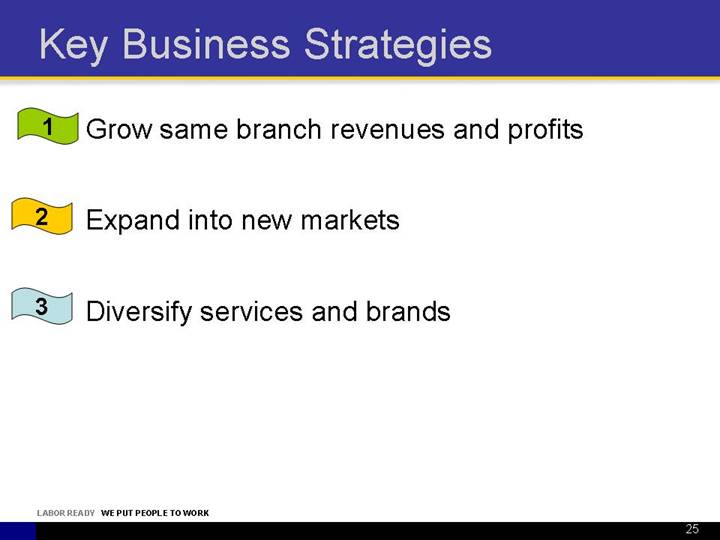
Key Business Strategies
|
|
Grow same branch revenues and profits |
|
|
|
|
|
Expand into new markets |
|
|
|
|
|
Diversify services and brands |
25
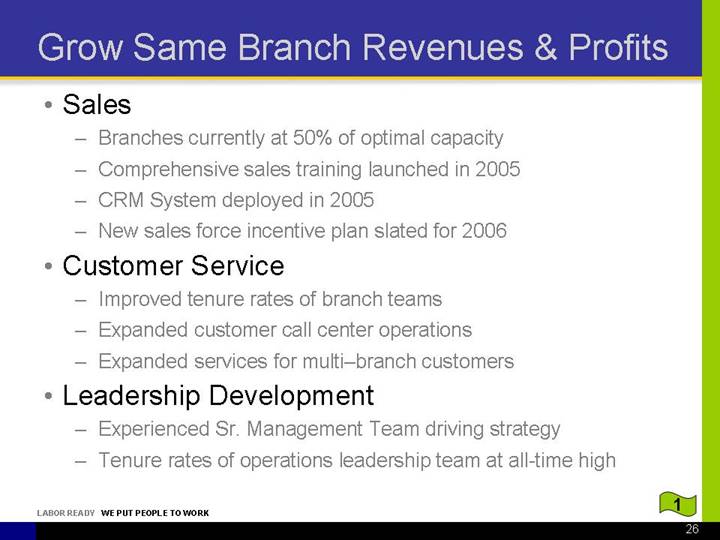
Grow Same Branch Revenues & Profits
• Sales
• Branches currently at 50% of optimal capacity
• Comprehensive sales training launched in 2005
• CRM System deployed in 2005
• New sales force incentive plan slated for 2006
• Customer Service
• Improved tenure rates of branch teams
• Expanded customer call center operations
• Expanded services for multi–branch customers
• Leadership Development
• Experienced Sr. Management Team driving strategy
• Tenure rates of operations leadership team at all-time high
![]()
26
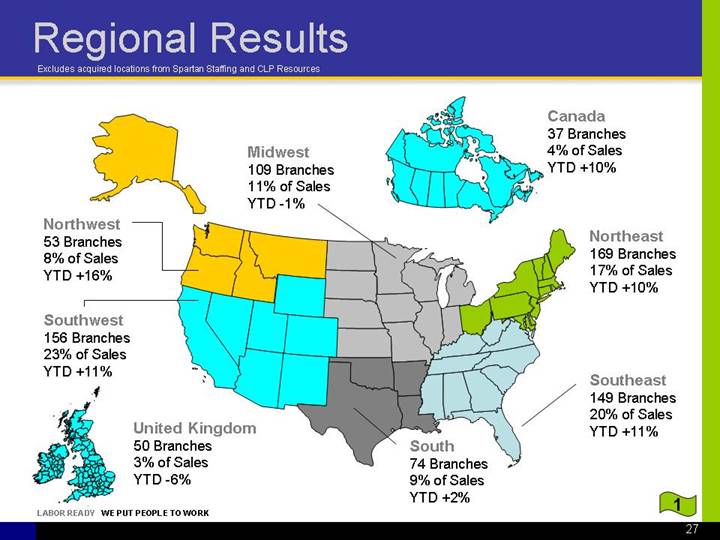
Regional Results
Excludes acquired locations from Spartan Staffing and CLP Resources
[GRAPHIC]
![]()
27
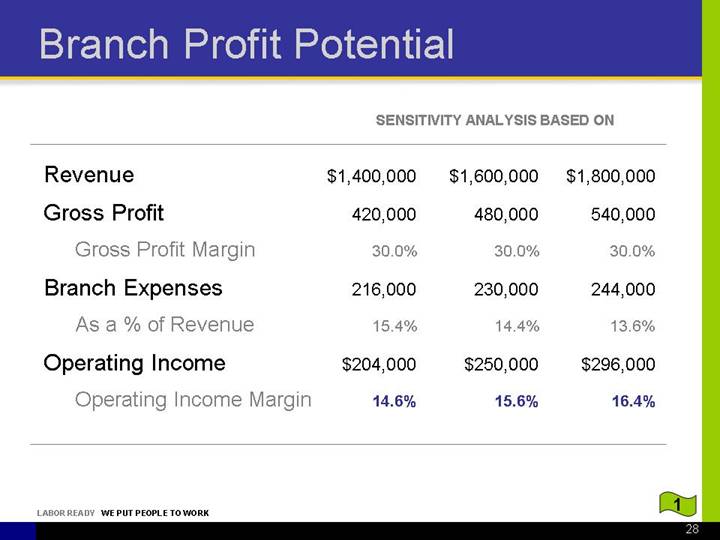
Branch Profit Potential
|
|
|
SENSITIVITY ANALYSIS BASED ON |
|
|||||||
|
|
|
|
|
|
|
|
|
|||
|
Revenue |
|
$ |
1,400,000 |
|
$ |
1,600,000 |
|
$ |
1,800,000 |
|
|
|
|
|
|
|
|
|
|
|||
|
Gross Profit |
|
420,000 |
|
480,000 |
|
540,000 |
|
|||
|
Gross Profit Margin |
|
30.0 |
% |
30.0 |
% |
30.0 |
% |
|||
|
|
|
|
|
|
|
|
|
|||
|
Branch Expenses |
|
216,000 |
|
230,000 |
|
244,000 |
|
|||
|
As a % of Revenue |
|
15.4 |
% |
14.4 |
% |
13.6 |
% |
|||
|
|
|
|
|
|
|
|
|
|||
|
Operating Income |
|
$ |
204,000 |
|
$ |
250,000 |
|
$ |
296,000 |
|
|
Operating Income Margin |
|
14.6 |
% |
15.6 |
% |
16.4 |
% |
|||
![]()
28
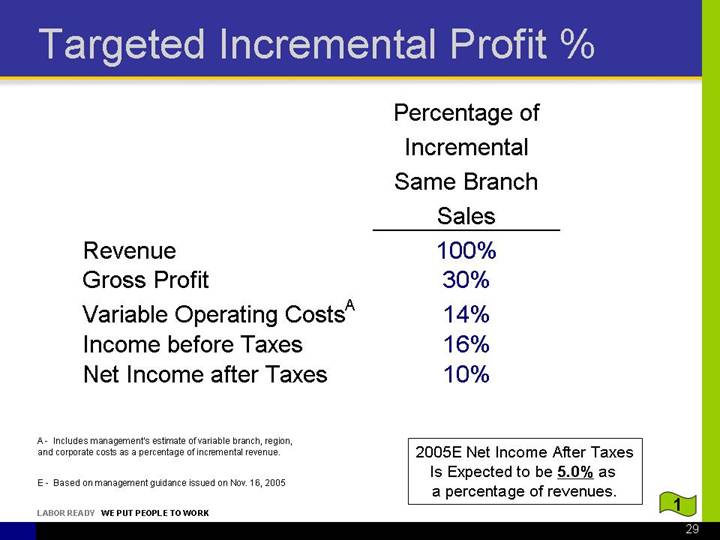
Targeted Incremental Profit %
|
|
|
Percentage of |
|
|
|
|
Incremental |
|
|
|
|
Same Branch |
|
|
|
|
Sales |
|
|
Revenue |
|
100 |
% |
|
Gross Profit |
|
30 |
% |
|
Variable Operating Costs(A) |
|
14 |
% |
|
Income before Taxes |
|
16 |
% |
|
Net Income after Taxes |
|
10 |
% |
2005(E) Net Income After Taxes Is Expected to be 5.0% as a percentage of revenues.
(A) - Includes management’s estimate of variable branch, region, and corporate costs as a percentage of incremental revenue.
(E) - Based on management guidance issued on Nov. 16, 2005
![]()
29
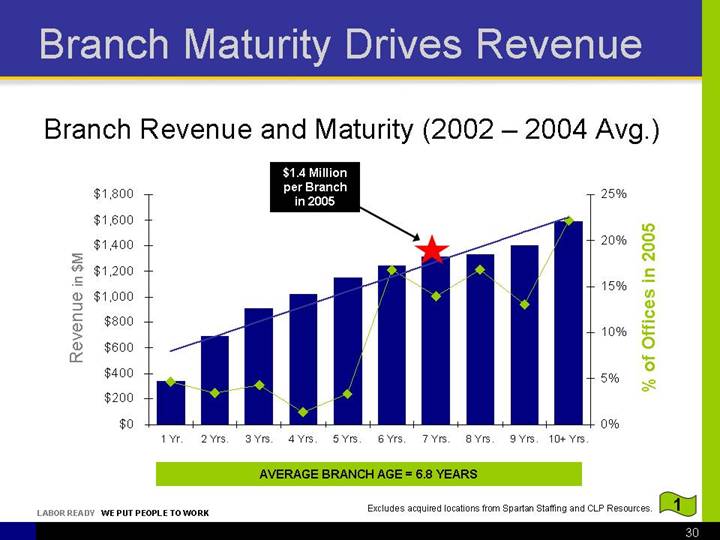
Branch Maturity Drives Revenue
Branch Revenue and Maturity (2002 – 2004 Avg.)
[CHART]
AVERAGE BRANCH AGE = 6.8 YEARS
Excludes acquired locations from Spartan Staffing and CLP Resources.
![]()
30
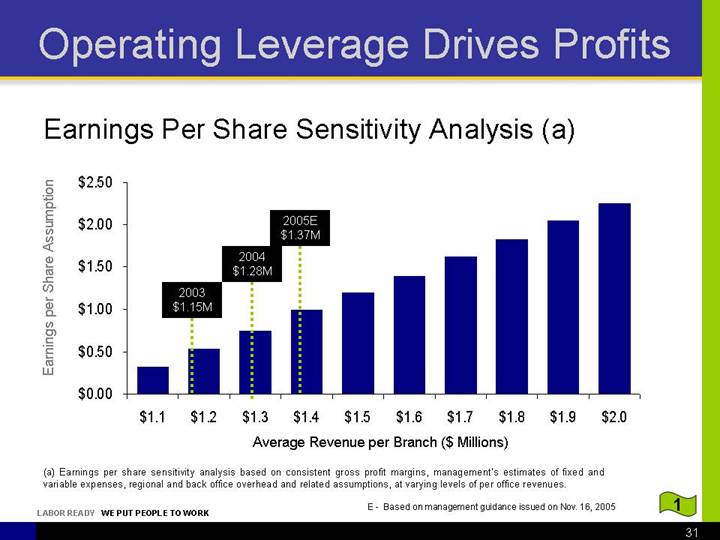
Operating Leverage Drives Profits
Earnings Per Share Sensitivity Analysis (a)
[CHART]
(a) Earnings per share sensitivity analysis based on consistent gross profit margins, management’s estimates of fixed and variable expenses, regional and back office overhead and related assumptions, at varying levels of per office revenues.
(E) - - Based on management guidance issued on Nov. 16, 2005
![]()
31
Expand into New Markets
• Holding New Branch Openings to 5% of Base
• Limits dilution to current earnings
• Modest number of new branch openings keeps field management focused on growing our existing branches
• Avoids over–investment in the event of economic downturn
• Consistent approach to levels of investment for new operations
![]()
32
• Resource Allocation:
How We Decide Where to Expand
• Market potential and return on investment
• Human capital availability and readiness
• Speed to breakeven
• Track record of successful new branch expansion
![]()
33
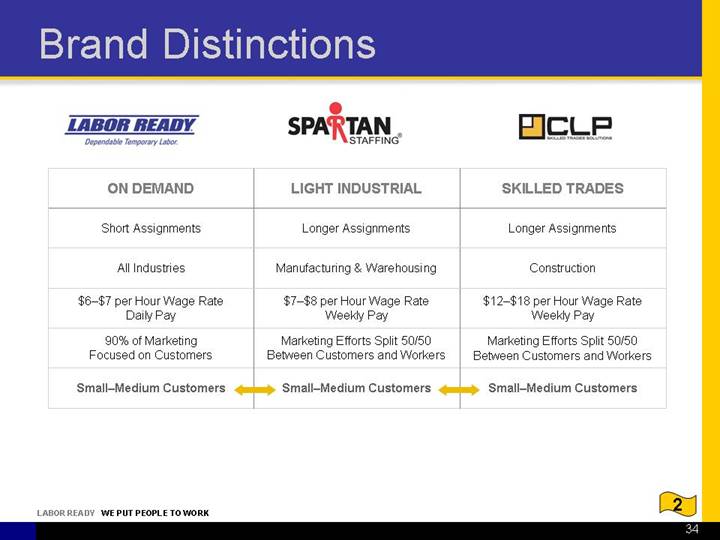
Brand Distinctions
|
[LOGO] |
|
[LOGO] |
|
[LOGO] |
|
|
|
|
|
|
|
ON DEMAND |
|
LIGHT INDUSTRIAL |
|
SKILLED TRADES |
|
Short Assignments |
|
Longer Assignments |
|
Longer Assignments |
|
All Industries |
|
Manufacturing & Warehousing |
|
Construction |
|
$6–$7 per Hour Wage Rate Daily Pay |
|
$7–$8 per Hour Wage Rate Weekly Pay |
|
$12–$18 per Hour Wage Rate Weekly Pay |
|
90% of Marketing |
|
Marketing Efforts Split 50/50 |
|
Marketing Efforts Split 50/50 |
|
Focused on Customers |
|
Between Customers and Workers |
|
Between Customers and Workers |
|
Small-Medium Customers |
|
Small–Medium Customers |
|
Small–Medium Customers |
![]()
34
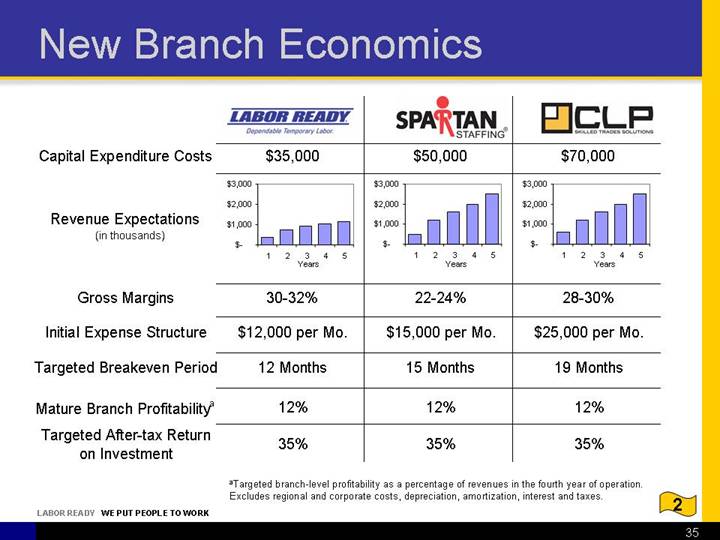
New Branch Economics
|
|
|
[LOGO] |
|
[LOGO] |
|
[LOGO] |
|
|||
|
|
|
|
|
|
|
|
|
|||
|
Capital Expenditure Costs |
|
$ |
35,000 |
|
$ |
50,000 |
|
$ |
70,000 |
|
|
|
|
|
|
|
|
|
|
|||
|
Revenue Expectations |
|
[CHART] |
|
[CHART] |
|
[CHART] |
|
|||
|
(in thousands) |
|
|
|
|
|
|
|
|||
|
|
|
|
|
|
|
|
|
|||
|
Gross Margins |
|
30-32 |
% |
22-24 |
% |
28-30 |
% |
|||
|
|
|
|
|
|
|
|
|
|||
|
Initial Expense Structure |
|
$ |
12,000 per Mo. |
|
$ |
15,000 per Mo. |
|
$ |
25,000 per Mo. |
|
|
|
|
|
|
|
|
|
|
|||
|
Targeted Breakeven Period |
|
12 Months |
|
15 Months |
|
19 Months |
|
|||
|
|
|
|
|
|
|
|
|
|||
|
Mature Branch Profitability (a) |
|
12 |
% |
12 |
% |
12 |
% |
|||
|
|
|
|
|
|
|
|
|
|||
|
Targeted After-tax Return on Investment |
|
35 |
% |
35 |
% |
35 |
% |
|||
|
|
|
|
|
|
|
|
|
|||
(a)Targeted branch-level profitability as a percentage of revenues in the fourth year of operation. Excludes regional and corporate costs, depreciation, amortization, interest and taxes.
![]()
35
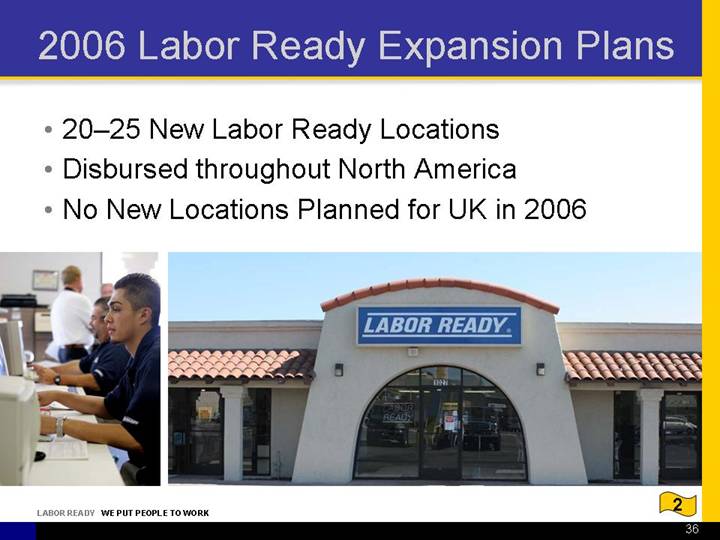
2006 Labor Ready Expansion Plans
• 20–25 New Labor Ready Locations
• Disbursed throughout North America
• No New Locations Planned for UK in 2006
[GRAPHIC]
![]()
36
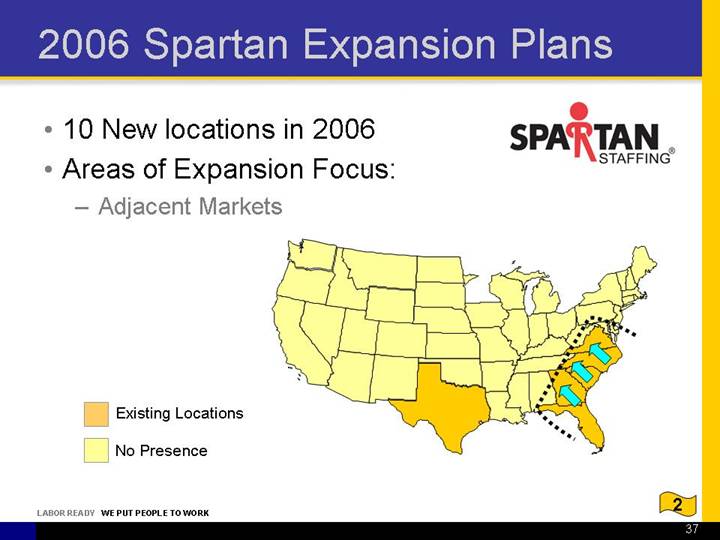
2006 Spartan Expansion Plans
• 10 New locations in 2006 [LOGO]
• Areas of Expansion Focus:
• Adjacent Markets
[GRAPHIC]
![]()
37
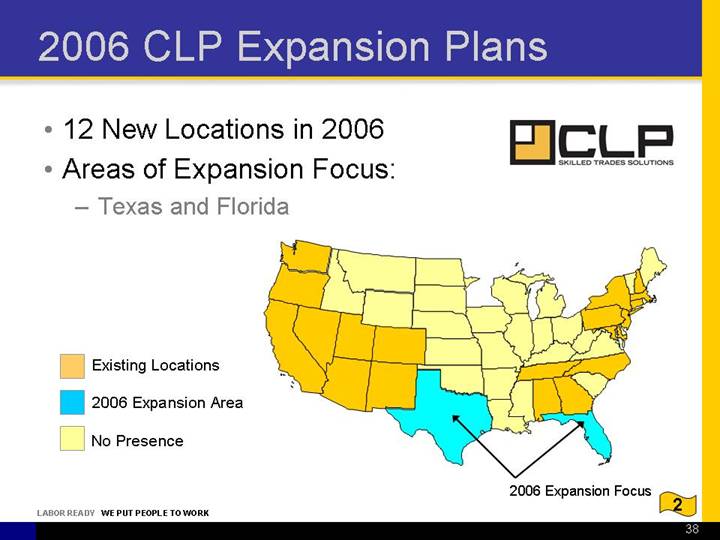
2006 CLP Expansion Plans
• 12 New Locations in 2006 [LOGO]
• Areas of Expansion Focus:
• Texas and Florida
[GRAPHIC]
![]()
38
Diversify Services & Brands
• Rationale
• Common customer base
• Leverage recruiting resources
• Channel synergies
• Opportunity to create a growth platform
• Opportunity to leverage management and systems
• Constraints
• Fit and culture
• Financial capital / investment return
• Human capital
• Speed of integration
![]()
39
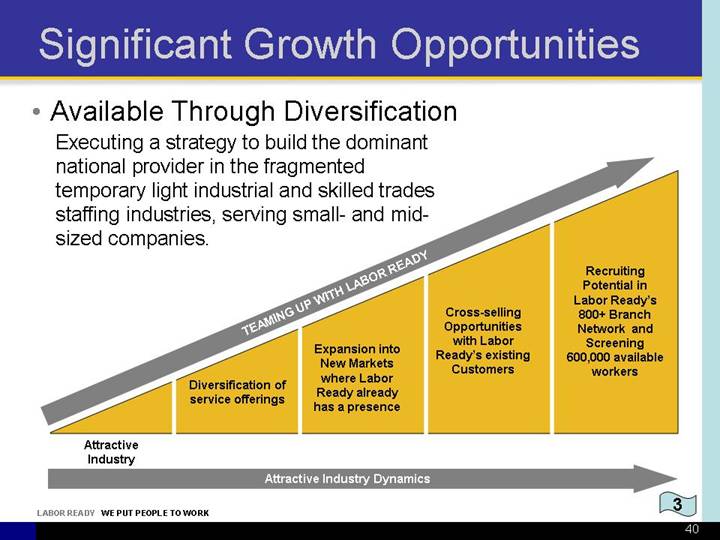
Significant Growth Opportunities
• Available Through Diversification
Executing a strategy to build the dominant national provider in the fragmented temporary light industrial and skilled trades staffing industries, serving small- and mid-sized companies.
TEAMING UP WITH LABOR READY
|
|
|
Diversification of |
|
Expansion into |
|
Cross-selling |
|
Recruiting |
|
Attractive |
|
|
|
|
|
|
|
|
|
|
|
Attractive Industry Dynamics |
|
|
|
|
||
![]()
40
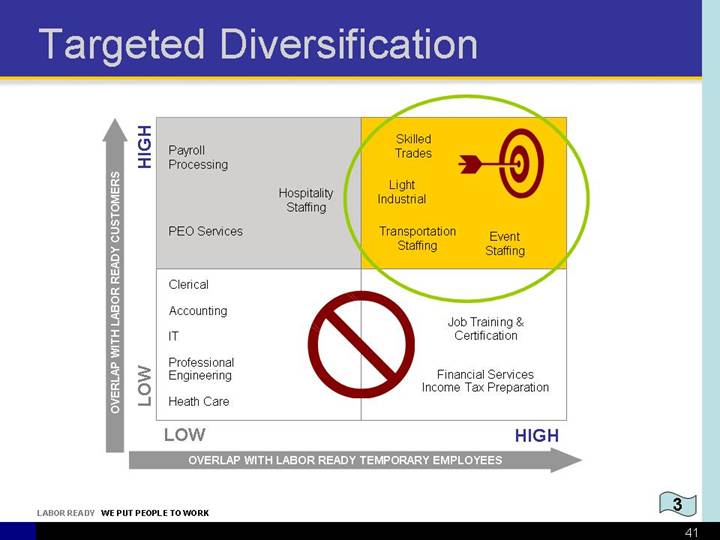
Targeted Diversification
[GRAPHIC]
![]()
41
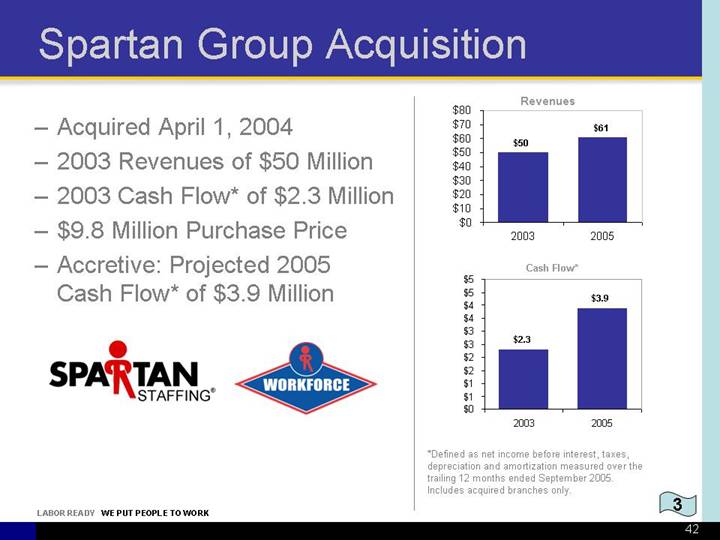
Spartan Group Acquisition
• Acquired April 1, 2004
• 2003 Revenues of $50 Million
• 2003 Cash Flow* of $2.3 Million
• $9.8 Million Purchase Price
• Accretive: Projected 2005 Cash Flow* of $3.9 Million
[LOGO]
Revenues
[CHART]
Cash Flow*
[CHART]
*Defined as net income before interest, taxes, depreciation and amortization measured over the trailing 12 months ended September 2005. Includes acquired branches only.
![]()
42
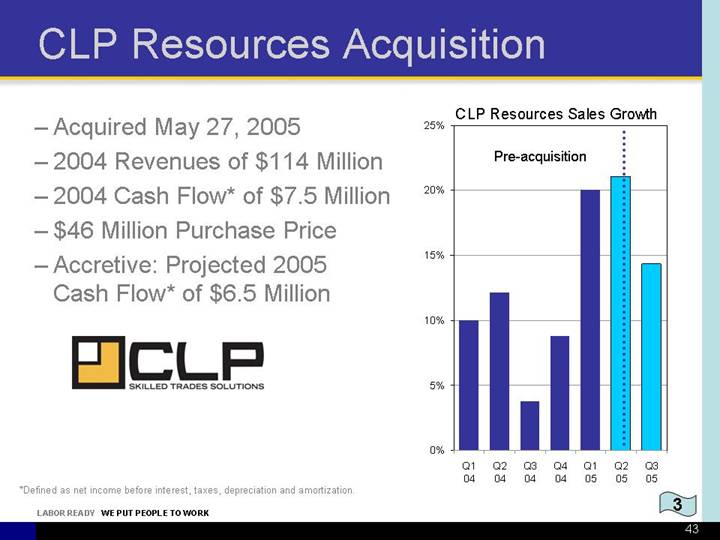
CLP Resources Acquisition
• Acquired May 27, 2005
• 2004 Revenues of $114 Million
• 2004 Cash Flow* of $7.5 Million
• $46 Million Purchase Price
• Accretive: Projected 2005
Cash Flow* of $6.5 Million
[LOGO]
CLP Resources Sales Growth
[CHART]
*Defined as net income before interest, taxes, depreciation and amortization.
![]()
43
Speed of Integration
Integration Phases
1. Culture
2. Policies and Systems
3. Cross Selling and Employee Referrals
![]()
44
Financial Highlights
• Improving revenue and profitability
• Strong gross margins
• Controlled operating costs
• Significant operating leverage
• Strong balance sheet
45
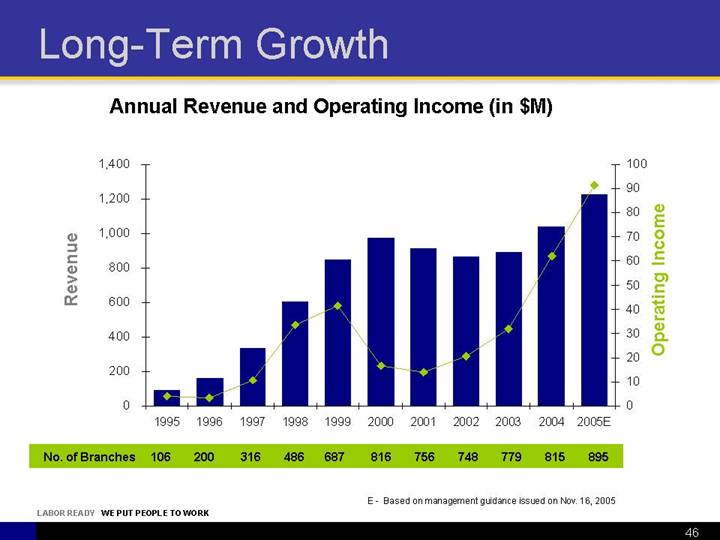
Long-Term Growth
Annual Revenue and Operating Income (in $M)
[CHART]
|
|
(E) - Based on management guidance issued on Nov. 16, 2005 |
46
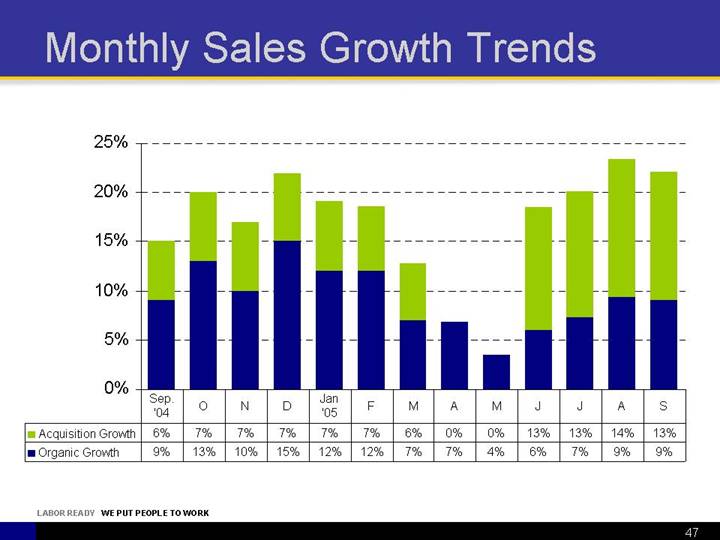
Monthly Sales Growth Trends
[CHART]
47
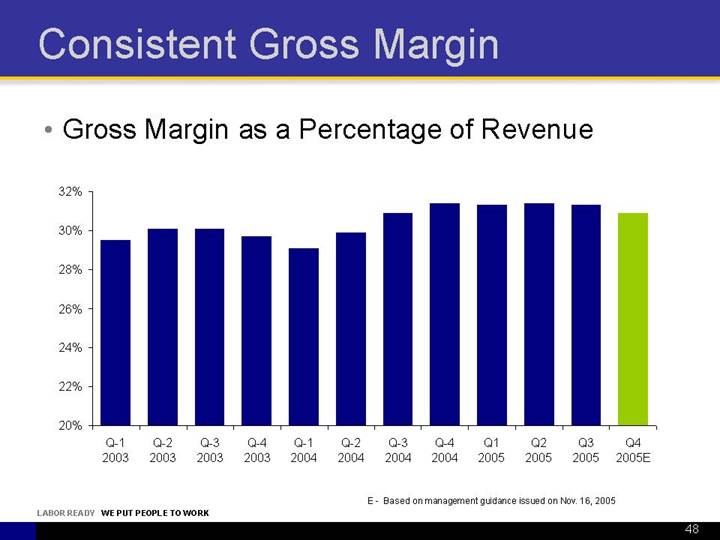
Consistent Gross Margin
• Gross Margin as a Percentage of Revenue
[CHART]
|
|
(E) - Based on management guidance issued on Nov. 16, 2005 |
48
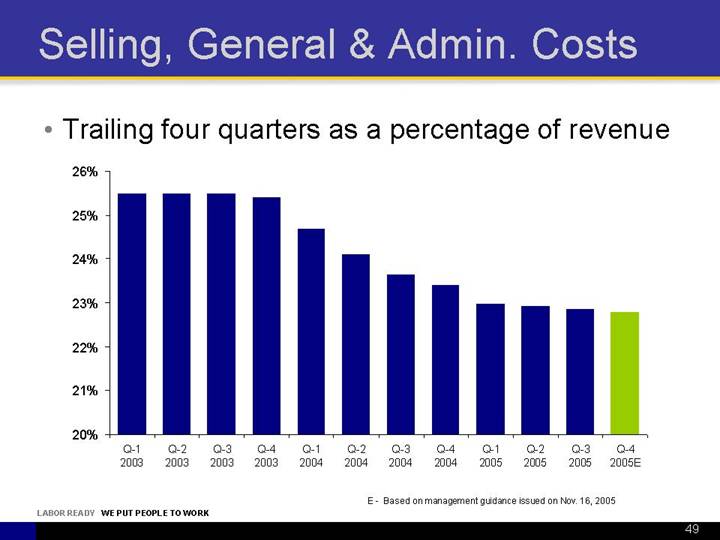
Selling, General & Admin. Costs
• Trailing four quarters as a percentage of revenue
[CHART]
|
|
(E) - Based on management guidance issued on Nov. 16, 2005 |
49
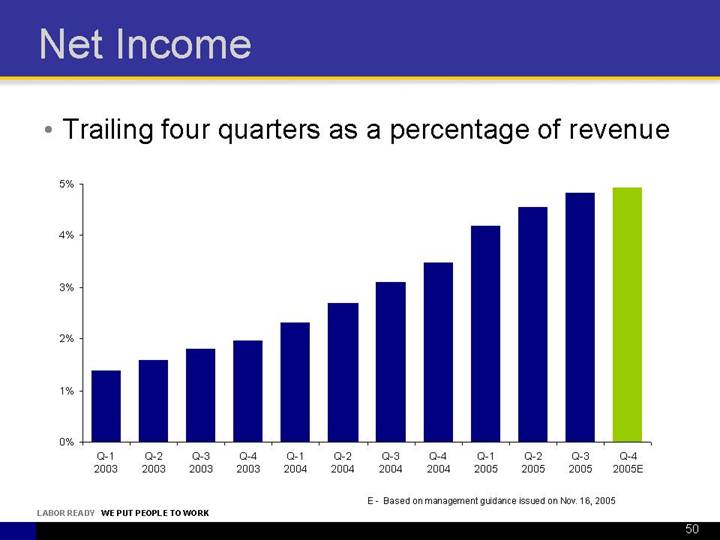
Net Income
• Trailing four quarters as a percentage of revenue
[CHART]
|
|
(E) - Based on management guidance issued on Nov. 16, 2005 |
50
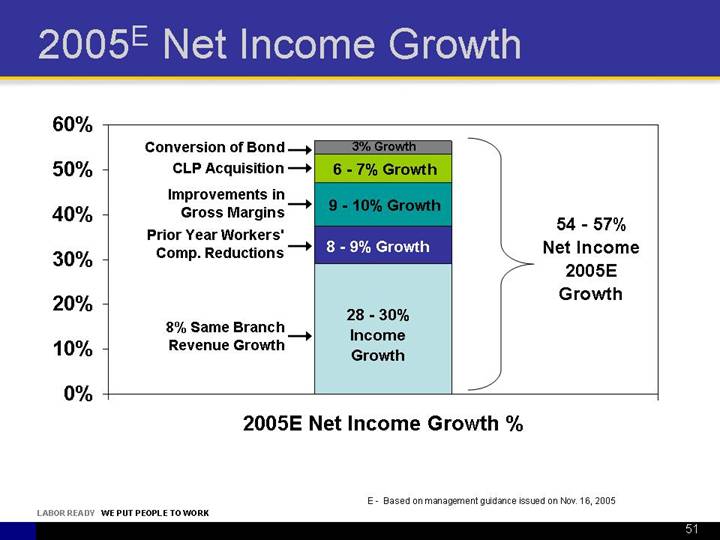
2005(E) Net Income Growth
[CHART]
|
|
(E) - Based on management guidance issued on Nov. 16, 2005 |
51
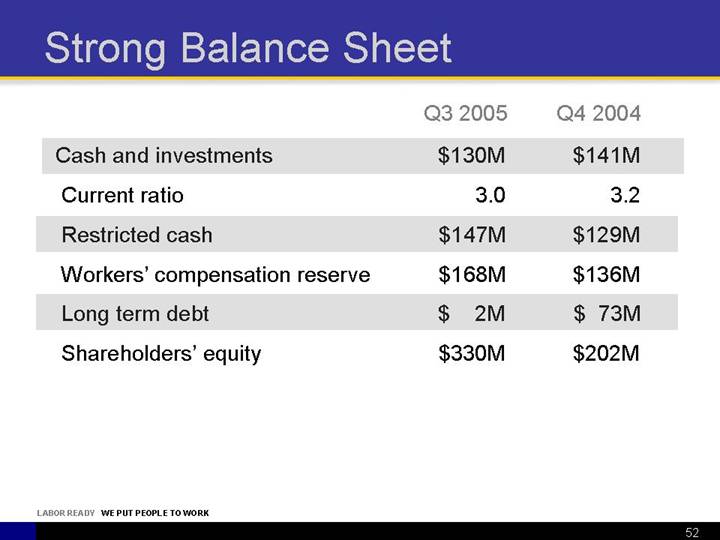
Strong Balance Sheet
|
|
|
Q3 2005 |
|
Q4 2004 |
|
||
|
Cash and investments |
|
$ |
130M |
|
$ |
141M |
|
|
Current ratio |
|
3.0 |
|
3.2 |
|
||
|
Restricted cash |
|
$ |
147M |
|
$ |
129M |
|
|
Workers’ compensation reserve |
|
$ |
168M |
|
$ |
136M |
|
|
Long term debt |
|
$ |
2M |
|
$ |
73M |
|
|
Shareholders’ equity |
|
$ |
330M |
|
$ |
202M |
|
52
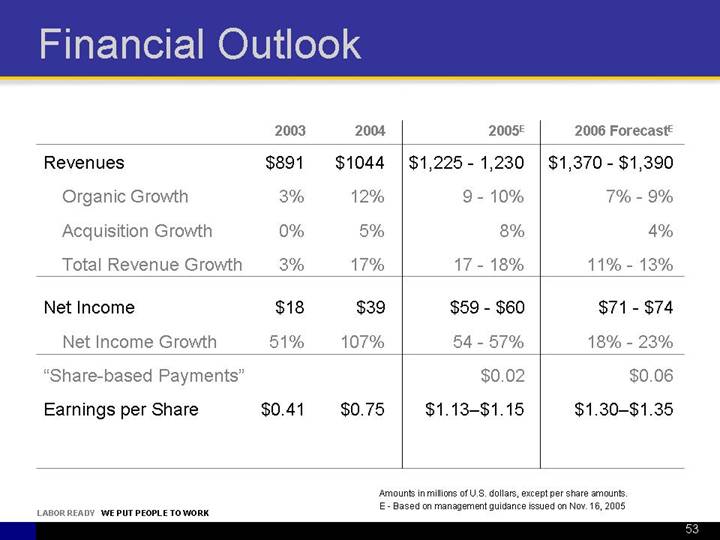
Financial Outlook
|
|
|
2003 |
|
2004 |
|
2005(E) |
|
2006 Forecast(E) |
|
||
|
Revenues |
|
$ |
891 |
|
$ |
1044 |
|
$1,225 - 1,230 |
|
$1,370 - $1,390 |
|
|
Organic Growth |
|
3 |
% |
12 |
% |
9 - 10 |
% |
7 - 9 |
% |
||
|
Acquisition Growth |
|
0 |
% |
5 |
% |
8 |
% |
4 |
% |
||
|
Total Revenue Growth |
|
3 |
% |
17 |
% |
17 - 18 |
% |
11 - 13 |
% |
||
|
|
|
|
|
|
|
|
|
|
|
||
|
Net Income |
|
$ |
18 |
|
$ |
39 |
|
$59 - $60 |
|
$71 - $74 |
|
|
Net Income Growth |
|
51 |
% |
107 |
% |
54 - 57 |
% |
18 - 23 |
% |
||
|
|
|
|
|
|
|
|
|
|
|
||
|
“Share-based Payments” |
|
|
|
|
|
$0.02 |
|
$0.06 |
|
||
|
|
|
|
|
|
|
|
|
|
|
||
|
Earnings per Share |
|
$ |
0.41 |
|
$ |
0.75 |
|
$1.13–$1.15 |
|
$1.30–$1.35 |
|
|
|
Amounts in millions of U.S. dollars, except per share amounts. |
|
|
(E) - Based on management guidance issued on Nov. 16, 2005 |
53
Investment Highlights
• Market leader in fragmented industry
• Large and growing market
• Favorable demographic trends
• Diverse customer base
• Scalable and flexible model
• Significant capacity for operating margin expansion
• Strong management and controls
Labor Ready is realizing significant
operating leverage as it benefits from
a growing economy and the
maturation of its existing branch network.
54