Exhibit 99.1

Link to searchable text of slide shown above
Link to searchable text of slide shown above
Link to searchable text of slide shown above
Link to searchable text of slide shown above
Link to searchable text of slide shown above
Link to searchable text of slide shown above
Link to searchable text of slide shown above
Link to searchable text of slide shown above
Link to searchable text of slide shown above
Link to searchable text of slide shown above
Link to searchable text of slide shown above
Link to searchable text of slide shown above
Link to searchable text of slide shown above
Link to searchable text of slide shown above
Link to searchable text of slide shown above
Link to searchable text of slide shown above
Link to searchable text of slide shown above
Link to searchable text of slide shown above
Link to searchable text of slide shown above
Link to searchable text of slide shown above
Link to searchable text of slide shown above
Link to searchable text of slide shown above
Link to searchable text of slide shown above
Link to searchable text of slide shown above
Link to searchable text of slide shown above
Link to searchable text of slide shown above
Link to searchable text of slide shown above
Link to searchable text of slide shown above
Link to searchable text of slide shown above
Link to searchable text of slide shown above
Link to searchable text of slide shown above
Link to searchable text of slide shown above
Link to searchable text of slide shown above
Searchable text section of graphics shown above
[LOGO]
INVESTOR
PRESENTATION
1ST QUARTER
2004
[GRAPHIC]
We Put People to Work.
SAFE HARBOR STATEMENT
Cautionary Note about Forward-Looking Statements
Certain statements made by us in this presentation that are not historical facts or that relate to future plans, events or performances are forward-looking statements within the meaning of the federal securities laws. Our actual results may differ materially from those expressed in any forward-looking statements made by us. Forward-looking statements involve a number of risks of uncertainties including, but not limited to, the risks described in the Company’s most recent 10-K and 10-Q filings. All forward-looking statements are qualified by those risk factors.
[LOGO]
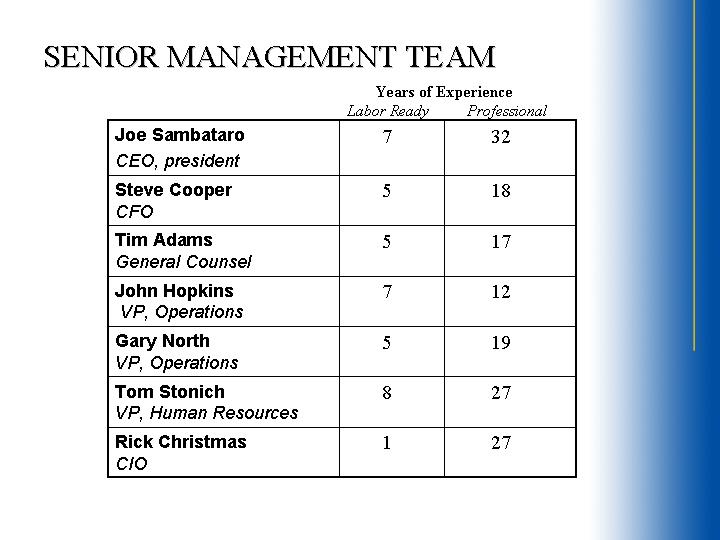
SENIOR MANAGEMENT TEAM
|
|
|
Years of Experience |
|
||
|
|
|
Labor Ready |
|
Professional |
|
|
Joe Sambataro |
|
7 |
|
32 |
|
|
|
|
|
|
|
|
|
Steve Cooper |
|
5 |
|
18 |
|
|
|
|
|
|
|
|
|
Tim Adams |
|
5 |
|
17 |
|
|
|
|
|
|
|
|
|
John Hopkins |
|
7 |
|
12 |
|
|
|
|
|
|
|
|
|
Gary North |
|
5 |
|
19 |
|
|
|
|
|
|
|
|
|
Tom Stonich |
|
8 |
|
27 |
|
|
|
|
|
|
|
|
|
Rick Christmas |
|
1 |
|
27 |
|
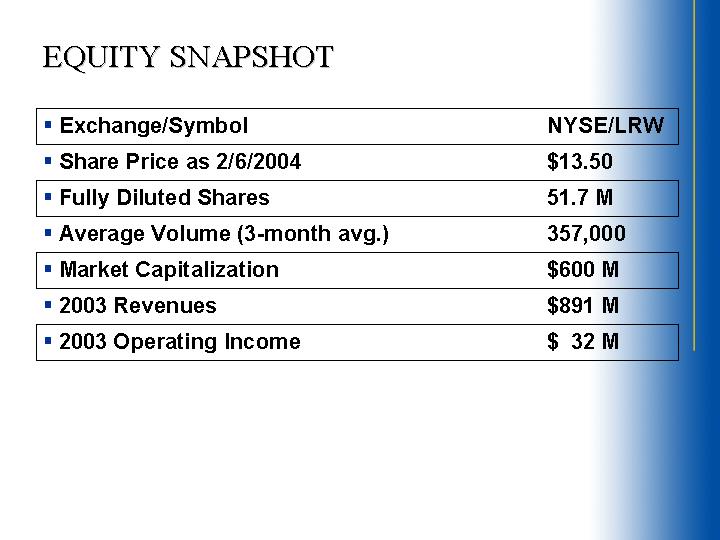
EQUITY SNAPSHOT
|
• Exchange/Symbol |
|
NYSE/LRW |
|
|
|
• Share Price as 2/6/2004 |
|
$ |
13.50 |
|
|
• Fully Diluted Shares |
|
51.7M |
|
|
|
• Average Volume (3-month avg.) |
|
357,000 |
|
|
|
• Market Capitalization |
|
$ |
600M |
|
|
• 2003 Revenues |
|
$ |
891M |
|
|
• 2003 Operating Income |
|
$ |
32M |
|
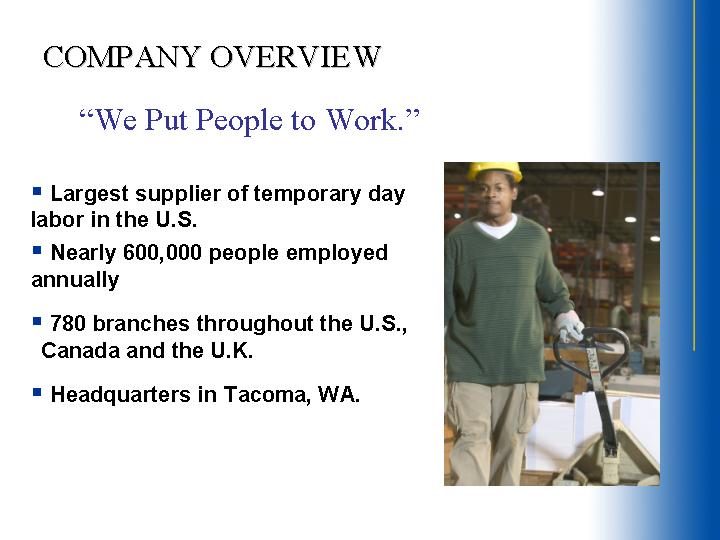
COMPANY OVERVIEW
“We Put People to Work.”
• Largest supplier of temporary day labor in the U.S.
• Nearly 600,000 people employed annually
• 780 branches throughout the U.S., Canada and the U.K.
• Headquarters in Tacoma, WA.
[GRAPHIC]
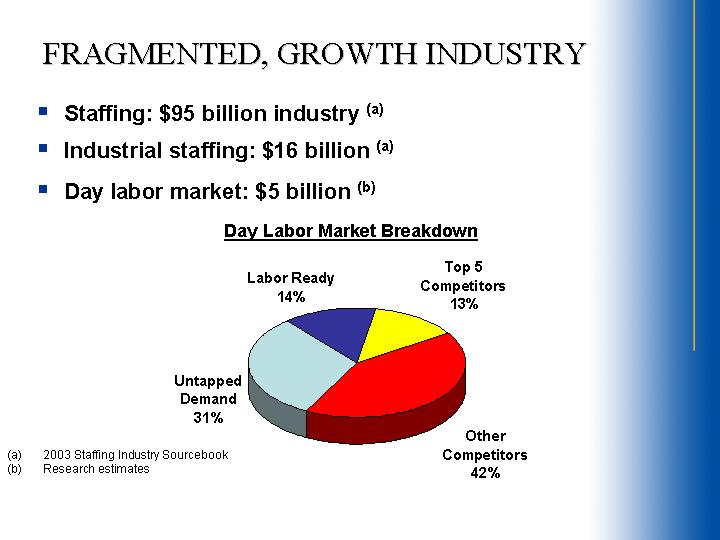
FRAGMENTED, GROWTH INDUSTRY
• Staffing: $95 billion industry (a)
• Industrial staffing: $16 billion (a)
• Day labor market: $5 billion (b)
Day Labor Market Breakdown
[CHART]
(a) 2003 Staffing Industry Sourcebook
(b) Research estimates
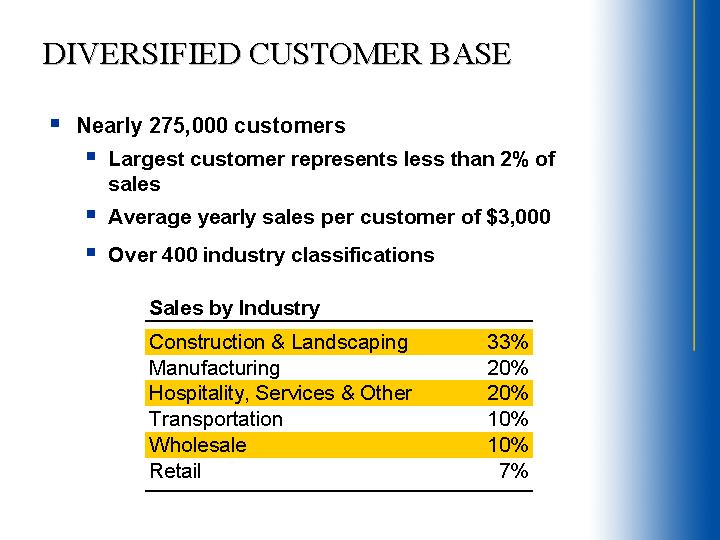
DIVERSIFIED CUSTOMER BASE
• Nearly 275,000 customers
• Largest customer represents less than 2% of sales
• Average yearly sales per customer of $3,000
• Over 400 industry classifications
|
Sales by Industry |
|
|
|
|
Construction & Landscaping |
|
33 |
% |
|
Manufacturing |
|
20 |
% |
|
Hospitality, Services & Other |
|
20 |
% |
|
Transportation |
|
10 |
% |
|
Wholesale |
|
10 |
% |
|
Retail |
|
7 |
% |
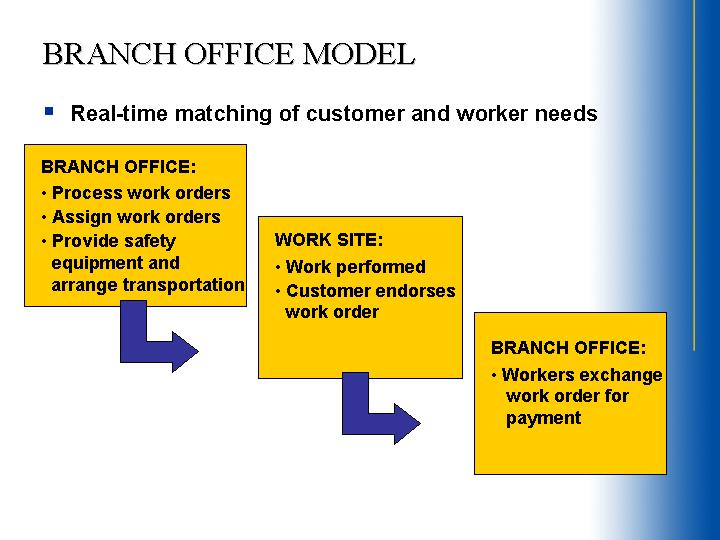
BRANCH OFFICE MODEL
• Real-time matching of customer and worker needs
BRANCH OFFICE:
• Process work orders
• Assign work orders
• Provide safety equipment and arrange transportation
WORK SITE:
• Work performed
• Customer endorses work order
BRANCH OFFICE:
• Workers exchange work order for payment
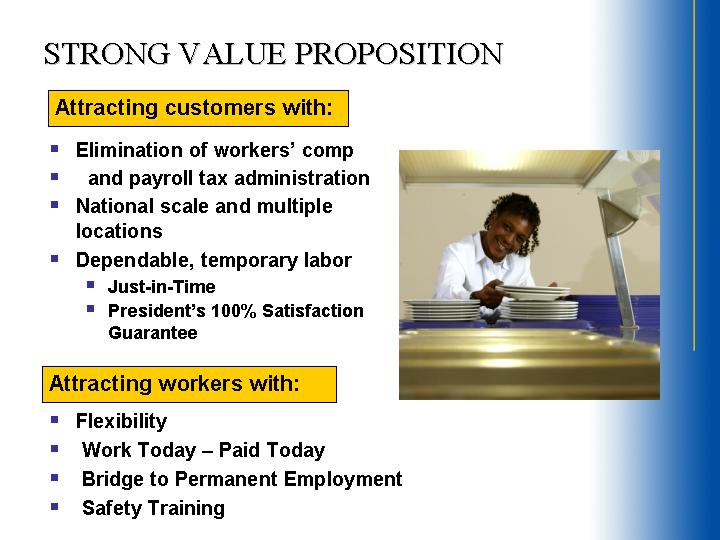
STRONG VALUE PROPOSITION
Attracting customers with:
• Elimination of workers’ comp
• and payroll tax administration
• National scale and multiple locations
• Dependable, temporary labor
• Just-in-Time
• President’s 100% Satisfaction Guarantee
Attracting workers with:
• Flexibility
• Work Today – Paid Today
• Bridge to Permanent Employment
• Safety Training
[GRAPHIC]
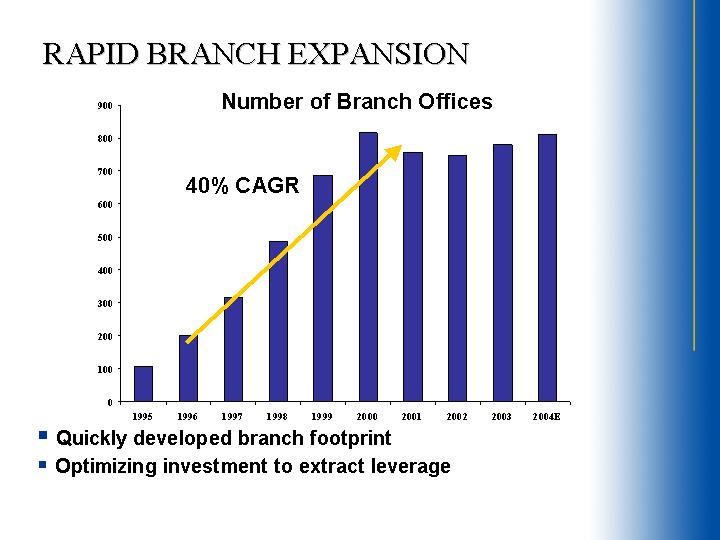
RAPID BRANCH EXPANSION
Number of Branch Offices
[CHART]
• Quickly developed branch footprint
• Optimizing investment to extract leverage
[LOGO]
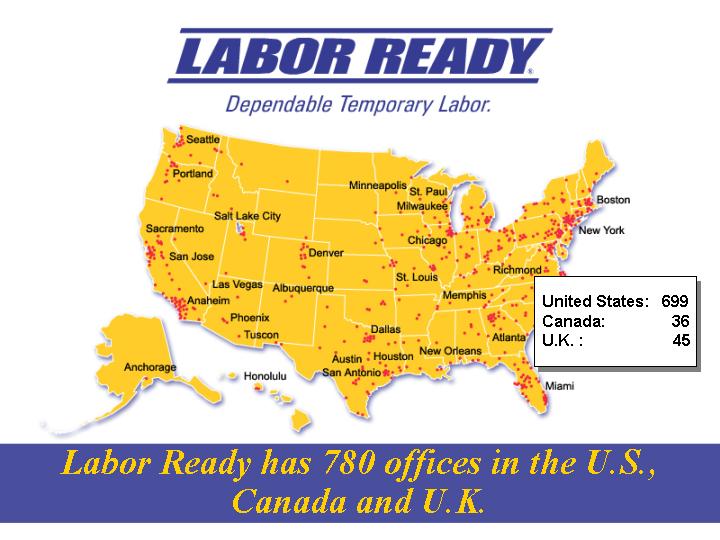
[GRAPHIC]
|
United States: |
|
699 |
|
Canada: |
|
36 |
|
U.K. : |
|
45 |
Labor Ready has 780 offices in the U.S., Canada and U.K.
KEY BUSINESS STRATEGIES
• Grow current branch revenues and profits
• Expand in smaller markets in the United States and Canada
• Expand in the United Kingdom
[GRAPHIC]
GROW CURRENT BRANCH REVENUES & PROFITS
• Increase same-branch revenues
• Current branches at 50% of recruiting capacity
• Improve Branch Manager tenure
• Compensation tied to Profits
• Enhanced Training
• Mentoring and Development
• Improve customer service
• Pricing and cost controls
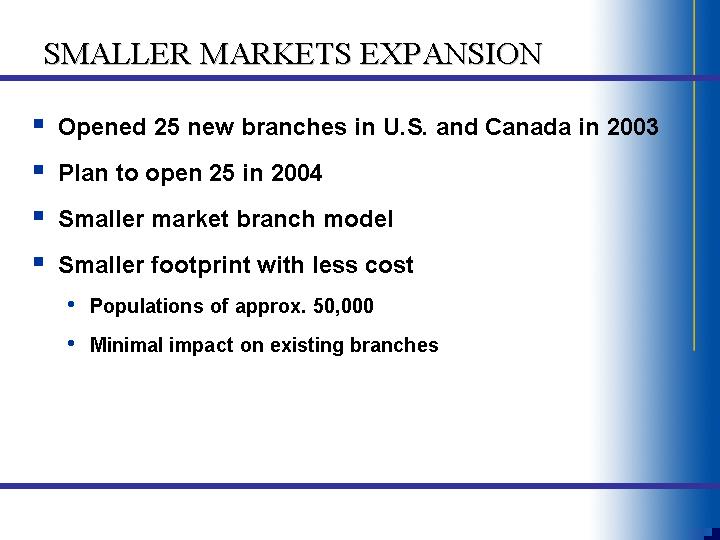
SMALLER MARKETS EXPANSION
• Opened 25 new branches in U.S. and Canada in 2003
• Plan to open 25 in 2004
• Smaller market branch model
• Smaller footprint with less cost
• Populations of approx. 50,000
• Minimal impact on existing branches
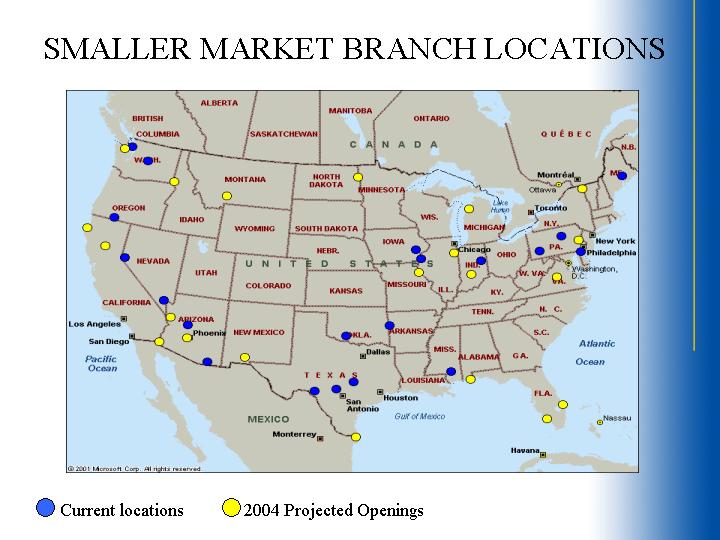
SMALLER MARKET BRANCH LOCATIONS
[GRAPHIC]
• Current locations
• 2004 Projected Openings
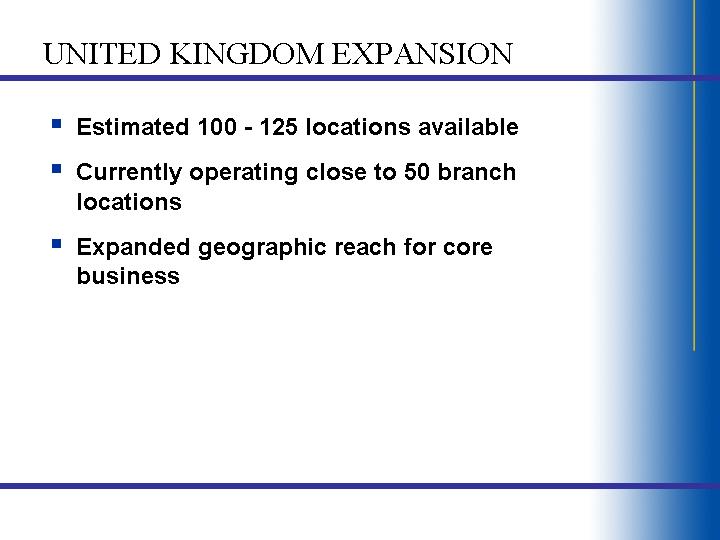
UNITED KINGDOM EXPANSION
• Estimated 100 - 125 locations available
• Currently operating close to 50 branch locations
• Expanded geographic reach for core business
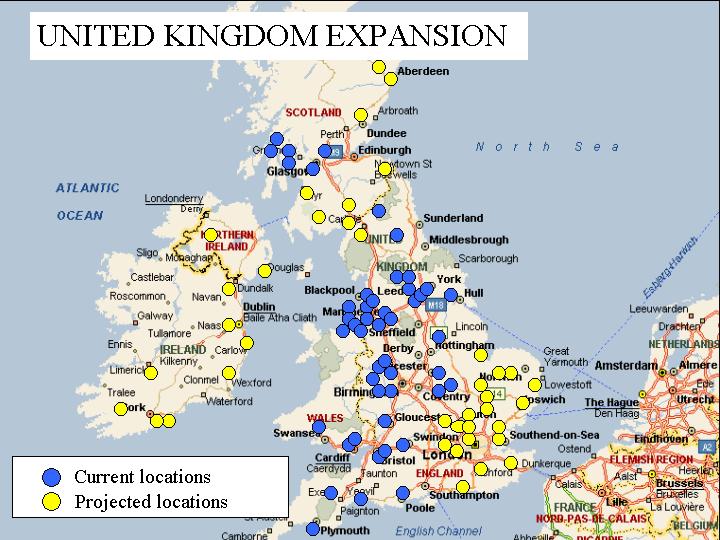
UNITED KINGDOM EXPANSION
[GRAPHIC]
• Current locations
• Projected locations
FINANCIAL HIGHLIGHTS
• Improving revenue and profitability
• Consistent gross margins
• Controlled operating costs
• Significant operating leverage
• Strong balance sheet
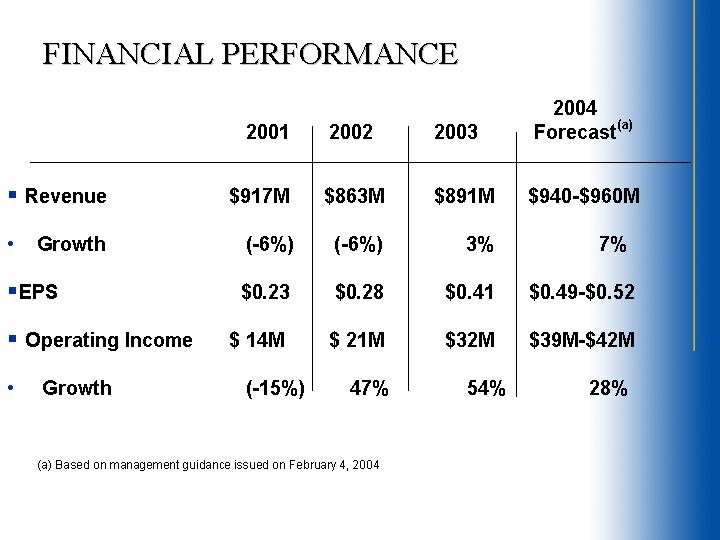
FINANCIAL PERFORMANCE
|
|
|
2001 |
|
2002 |
|
2003 |
|
2004 |
|
||||
|
|
|
|
|
|
|
|
|
|
|
||||
|
• |
Revenue |
|
$ |
917M |
|
$ |
863M |
|
$ |
891M |
|
$940-$960M |
|
|
• |
Growth |
|
(-6 |
)% |
(-6 |
)% |
3 |
% |
7 |
% |
|||
|
• |
EPS |
|
$ |
0.23 |
|
$ |
0.28 |
|
$ |
0.41 |
|
$0.49-$0.52 |
|
|
• |
Operating Income |
|
$ |
14M |
|
$ |
21M |
|
$ |
32M |
|
$39M-$42M |
|
|
• |
Growth |
|
(-15 |
)% |
47 |
% |
54 |
% |
28 |
% |
|||
(a) Based on management guidance issued on February 4, 2004
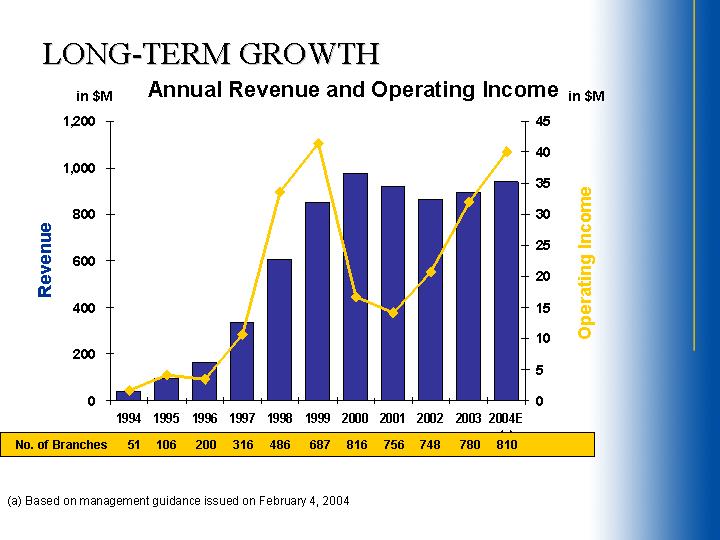
LONG-TERM GROWTH
Annual Revenue and Operating Income
[CHART]
|
No. of Branches |
|
51 |
|
106 |
|
200 |
|
316 |
|
486 |
|
687 |
|
816 |
|
756 |
|
748 |
|
780 |
|
810 |
|
(a) Based on management guidance issued on February 4, 2004
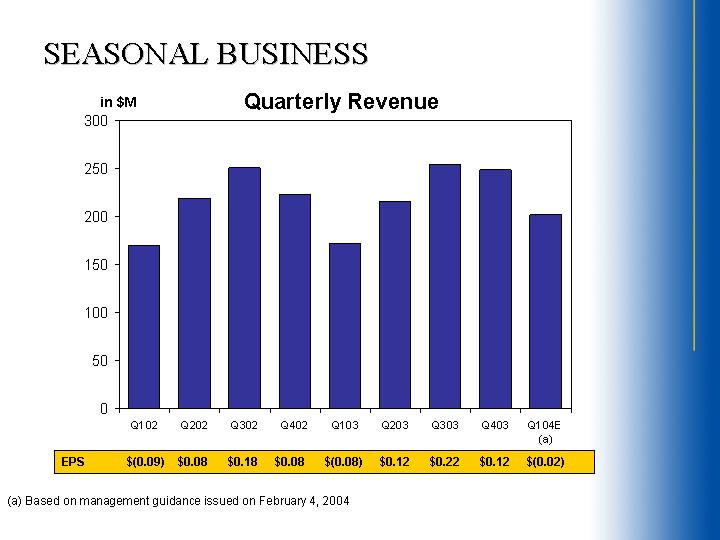
SEASONAL BUSINESS
Quarterly Revenue
|
EPS |
|
$ |
(0.09 |
) |
$ |
0.08 |
|
$ |
0.18 |
|
$ |
0.08 |
|
$ |
(0.08 |
) |
$ |
0.12 |
|
$ |
0.22 |
|
$ |
0.12 |
|
$ |
(0.02 |
) |
(a) Based on management guidance issued on February 4, 2004
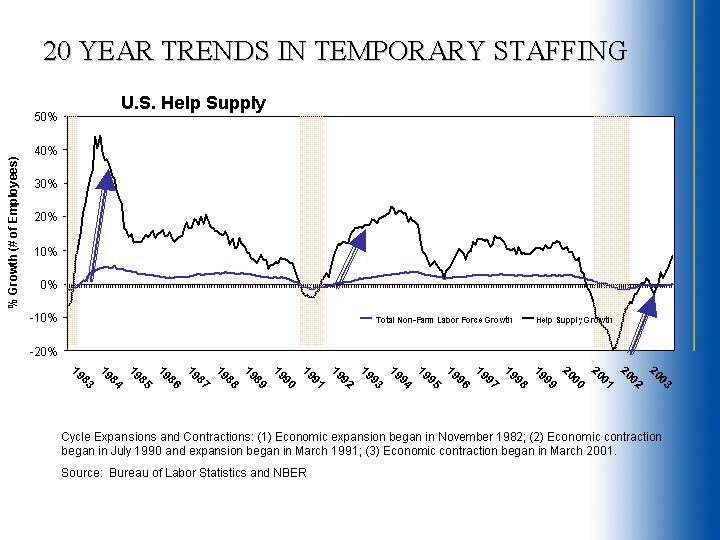
20 YEAR TRENDS IN TEMPORARY STAFFING
U.S. Help Supply
[CHART]
Cycle Expansions and Contractions: (1) Economic expansion began in November 1982; (2) Economic contraction began in July 1990 and expansion began in March 1991; (3) Economic contraction began in March 2001.
Source: Bureau of Labor Statistics and NBER
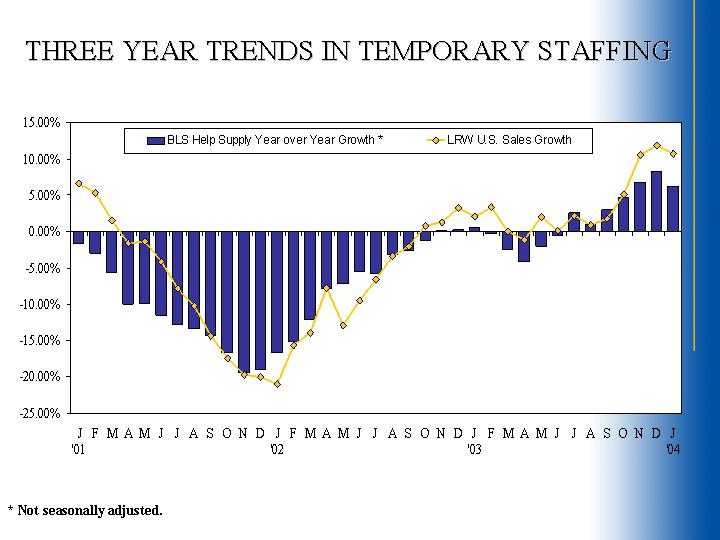
THREE YEAR TRENDS IN TEMPORARY STAFFING
[CHART]
* Not seasonally adjusted.
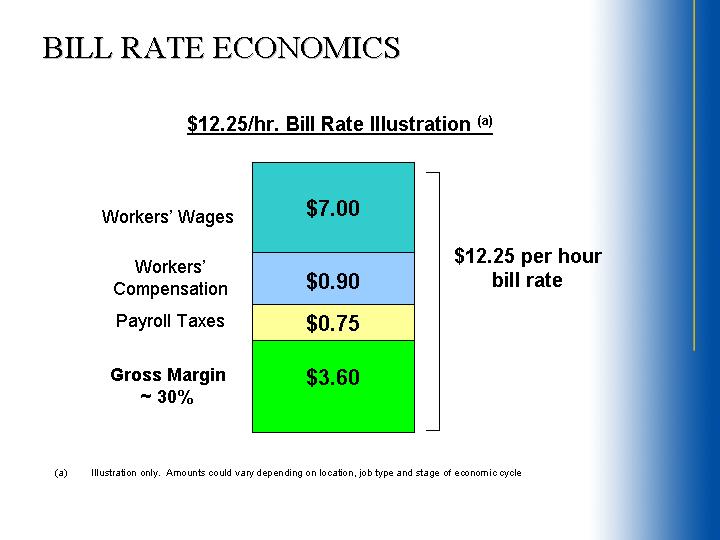
BILL RATE ECONOMICS
$12.25/hr. Bill Rate Illustration (a)
|
Workers’ Wages |
|
$ |
7.00 |
|
$12.25 per hour bill rate |
|
|
|
|
|
|
|||
|
Workers’ Compensation |
|
$ |
0.90 |
|
||
|
|
|
|
|
|||
|
Payroll Taxes |
|
$ |
0.75 |
|
||
|
|
|
|
|
|||
|
Gross Margin ~ 30% |
|
$ |
3.60 |
|
||
(a) Illustration only. Amounts could vary depending on location, job type and stage of economic cycle
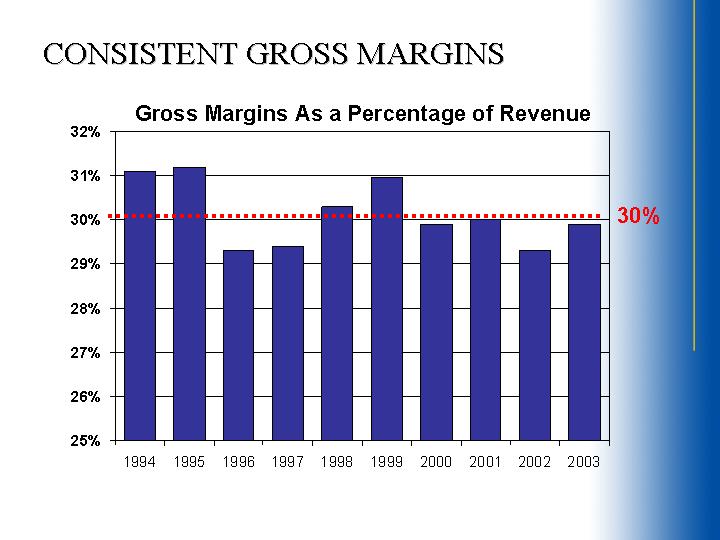
CONSISTENT GROSS MARGINS
Gross Margins As a Percentage of Revenue
[CHART]
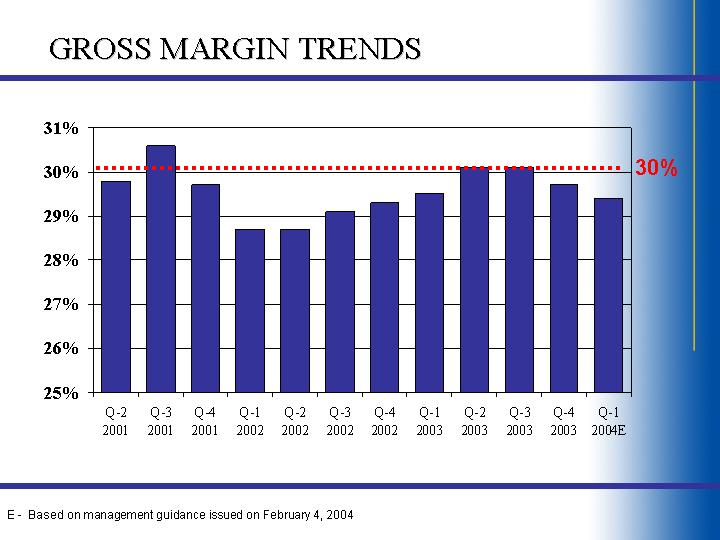
GROSS MARGIN TRENDS
[CHART]
E - Based on management guidance issued on February 4, 2004
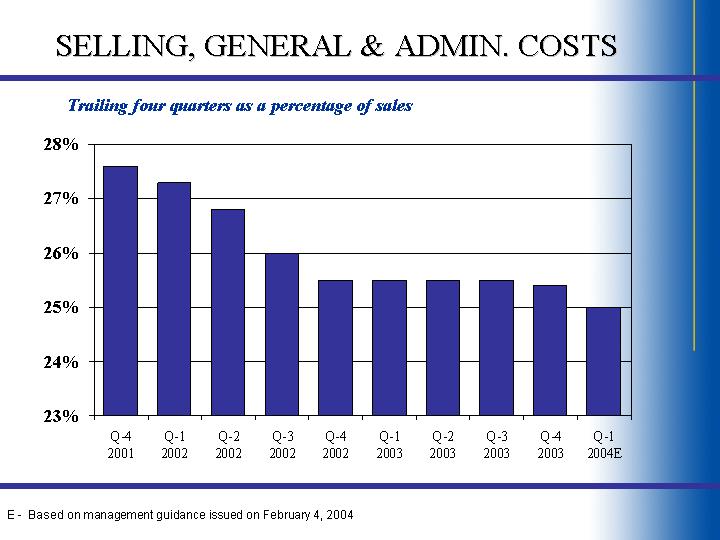
SELLING, GENERAL & ADMIN. COSTS
Trailing four quarters as a percentage of sales
[CHART]
E - Based on management guidance issued on February 4, 2004
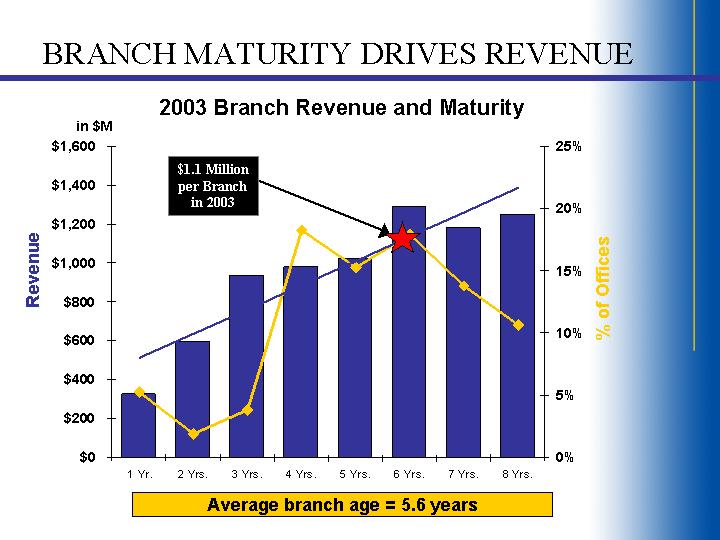
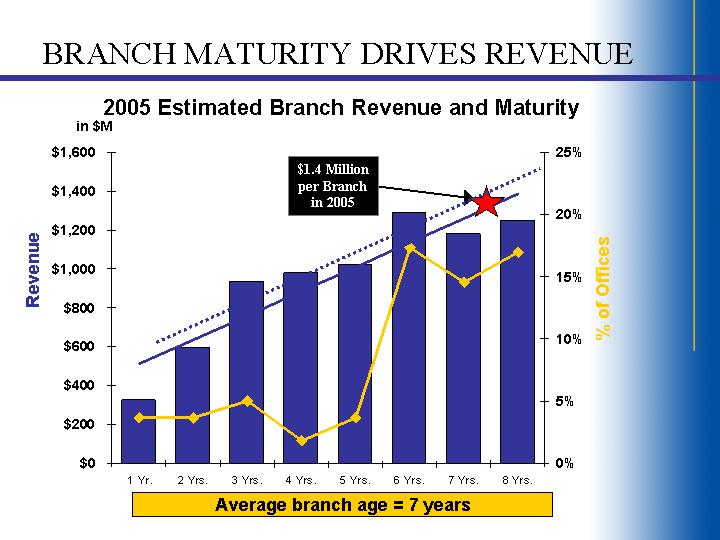
BRANCH MATURITY DRIVES REVENUE
2003 Branch Revenue and Maturity
[CHART]
Average branch age = 5.6 years
2005 Estimated Branch Revenue and Maturity
[CHART]
Average branch age = 7 years
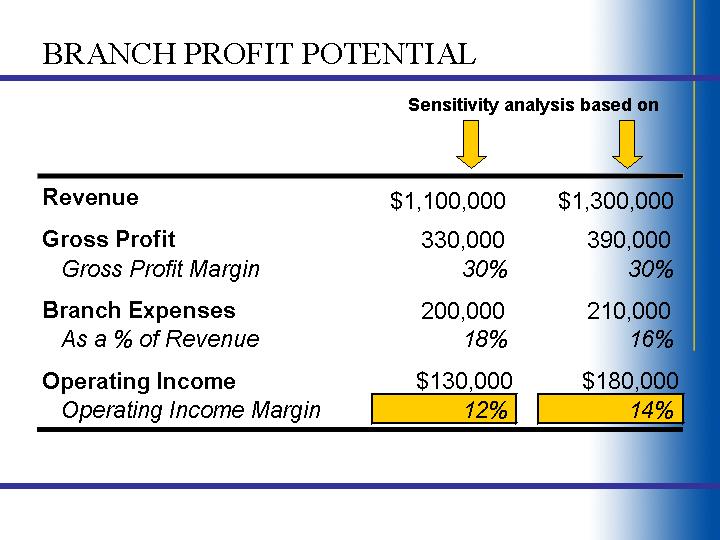
BRANCH PROFIT POTENTIAL
|
|
|
Sensitivity analysis based on |
|
||||
|
|
|
|
|
|
|
||
|
Revenue |
|
$ |
1,100,000 |
|
$ |
1,300,000 |
|
|
|
|
|
|
|
|
||
|
Gross Profit |
|
330,000 |
|
390,000 |
|
||
|
Gross Profit Margin |
|
30 |
% |
30 |
% |
||
|
|
|
|
|
|
|
||
|
Branch Expenses |
|
200,000 |
|
210,000 |
|
||
|
As a% of Revenue |
|
18 |
% |
16 |
% |
||
|
|
|
|
|
|
|
||
|
Operating Income |
|
$ |
130,000 |
|
$ |
180,000 |
|
|
Operating Income Margin |
|
12 |
% |
14 |
% |
||
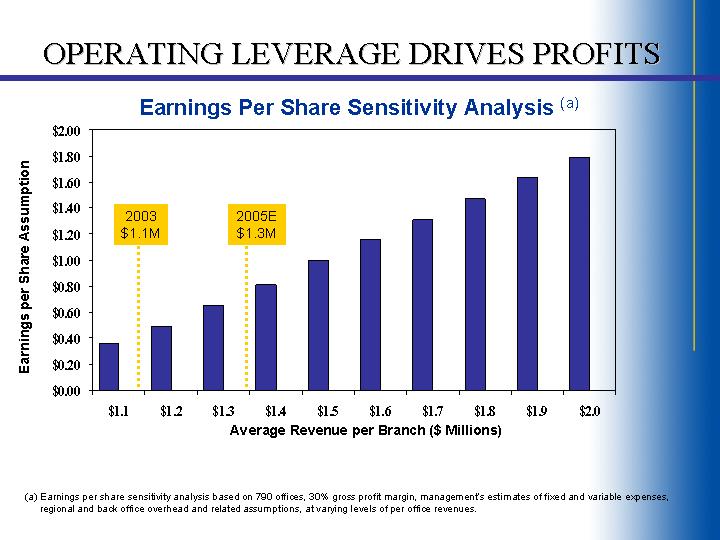
OPERATING LEVERAGE DRIVES PROFITS
Earnings Per Share Sensitivity Analysis (a)
[CHART]
(a) Earnings per share sensitivity analysis based on 790 offices, 30% gross profit margin, management’s estimates of fixed and variable expenses, regional and back office overhead and related assumptions, at varying levels of per office revenues.
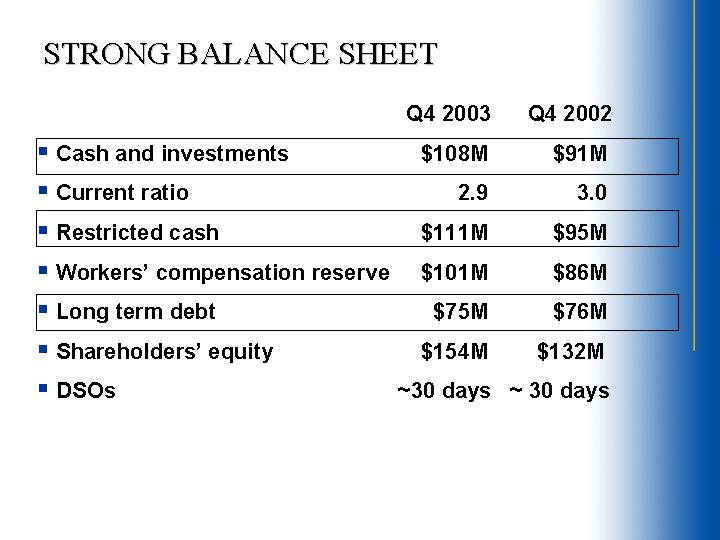
STRONG BALANCE SHEET
|
|
|
|
Q4 2003 |
|
Q4 2002 |
|
||
|
• |
Cash and investments |
|
$ |
108M |
|
$ |
91M |
|
|
• |
Current ratio |
|
2.9 |
|
3.0 |
|
||
|
• |
Restricted cash |
|
$ |
111M |
|
$ |
95M |
|
|
• |
Workers’ compensation reserve |
|
$ |
101M |
|
$ |
86M |
|
|
• |
Long term debt |
|
$ |
75M |
|
$ |
76M |
|
|
• |
Shareholders’ equity |
|
$ |
154M |
|
$ |
132M |
|
|
• |
DSOs |
|
~30 days |
|
~30 days |
|
||
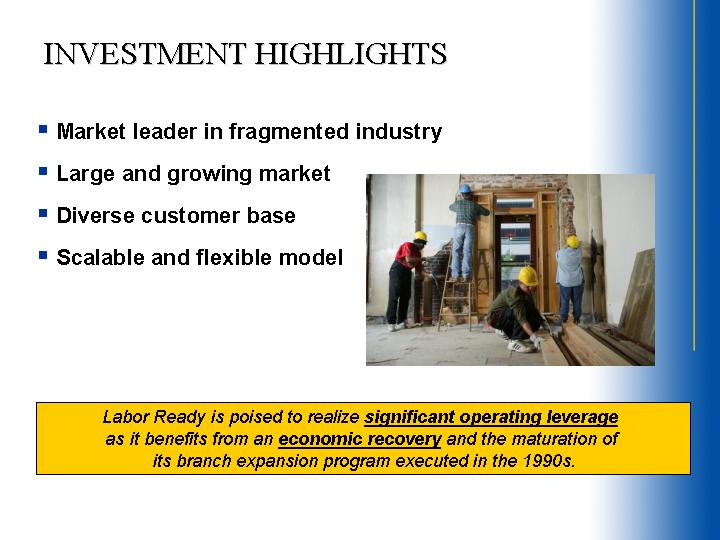
INVESTMENT HIGHLIGHTS
• Market leader in fragmented industry
• Large and growing market
• Diverse customer base
• Scalable and flexible model
[GRAPHIC]
Labor Ready is poised to realize significant operating leverage as it benefits from an economic recovery and the maturation of its branch expansion program executed in the 1990s.