Exhibit 99.1

Link to searchable text of slide shown above

Link to searchable text of slide shown above

Link to searchable text of slide shown above
Link to searchable text of slide shown above
Link to searchable text of slide shown above
Link to searchable text of slide shown above
Link to searchable text of slide shown above
Link to searchable text of slide shown above
Link to searchable text of slide shown above

Link to searchable text of slide shown above
Link to searchable text of slide shown above
Link to searchable text of slide shown above
Link to searchable text of slide shown above
Link to searchable text of slide shown above
Link to searchable text of slide shown above
Link to searchable text of slide shown above
Link to searchable text of slide shown above
Link to searchable text of slide shown above
Link to searchable text of slide shown above
Link to searchable text of slide shown above
Link to searchable text of slide shown above
Link to searchable text of slide shown above
Link to searchable text of slide shown above
Link to searchable text of slide shown above
Link to searchable text of slide shown above
Link to searchable text of slide shown above
Link to searchable text of slide shown above
Link to searchable text of slide shown above
Link to searchable text of slide shown above
Link to searchable text of slide shown above
Link to searchable text of slide shown above
Link to searchable text of slide shown above
Link to searchable text of slide shown above
Link to searchable text of slide shown above
Searchable text section of graphics shown above
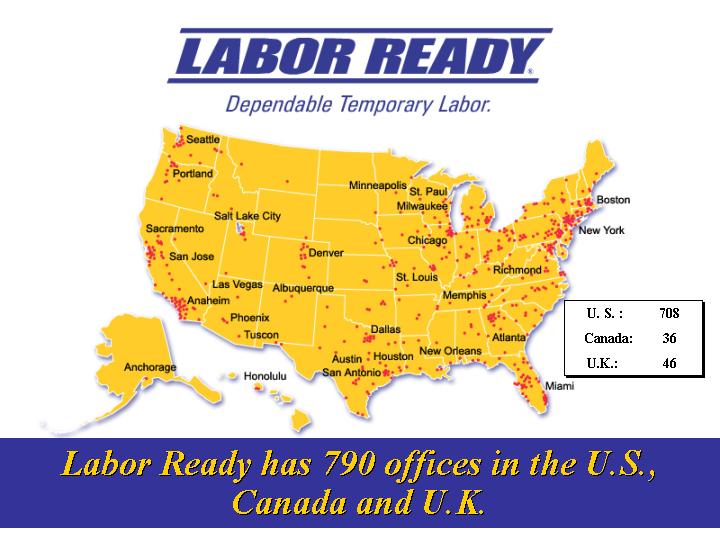
LABOR READY®
Dependable Temporary Labor.
2003
ANALYST PRESENTATION
September 17, 2003
New York
We Put People to Work.
Cautionary Note about Forward-Looking Statements
Certain statements made by us in this presentation that are not historical facts or that relate to future plans, events or performances are forward-looking statements within the meaning of the federal securities laws. Our actual results may differ materially from those expressed in any forward-looking statements made by us. Forward-looking statements involve a number of risks of uncertainties including, but not limited to, the risks described in the Company’s most recent 10-K and 10-Q filings. All forward-looking statements are qualified by those risk factors.
[LOGO]
• Robert Sullivan
Chairman
• Mark Beatty
• Tom McChesney
• Gates McKibbin
• Joe Sambataro
• Carl Schafer
• Bill Steele
• Tim Adams
General Counsel
• Bob Breen
Director, Strategic Planning & Analysis
• Rick Christmas
CIO
• Steve Cooper
CFO
• John Hopkins
Regional VP, Operations/West
• Gary North
Regional VP, Operations/East & U.K.
• Tom Stonich
VP Human Resources
2003 ANALYST PRESENTATION AGENDA
• Overview
• Industry Trends
• Labor Ready Value Proposition
• Company Goals & Strategies
• Key Financial Metrics & Results
Dependable Temporary Labor.
[GRAPHIC]
Labor Ready has 790 offices in the U.S.,
Canada and U.K.
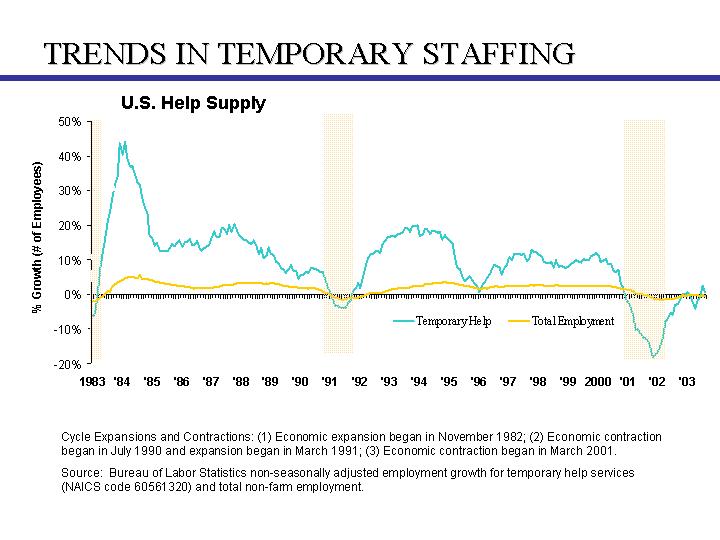
U.S. Help Supply
[CHART]
Cycle Expansions and Contractions: (1) Economic expansion began in November 1982; (2) Economic contraction began in July 1990 and expansion began in March 1991; (3) Economic contraction began in March 2001.
Source: Bureau of Labor Statistics non-seasonally adjusted employment growth for temporary help services (NAICS code 60561320) and total non-farm employment.
Recent reports on the U.S. economy have been optimistic…
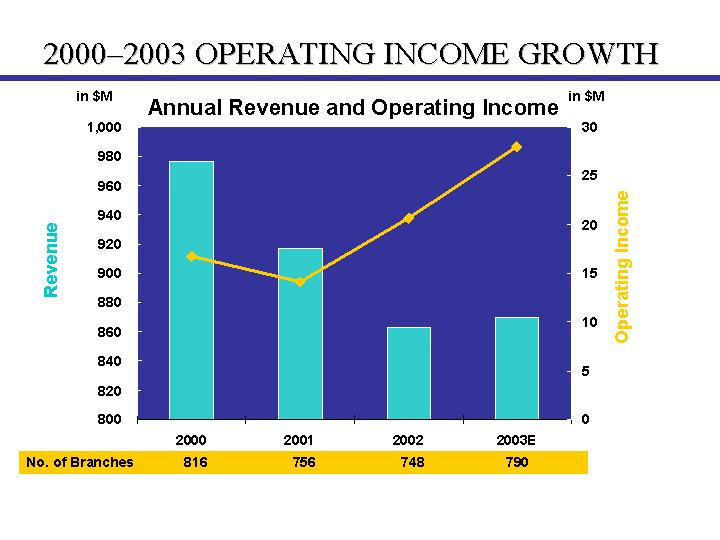
2000—2003 OPERATING INCOME GROWTH
Annual Revenue and Operating Income
[CHART]
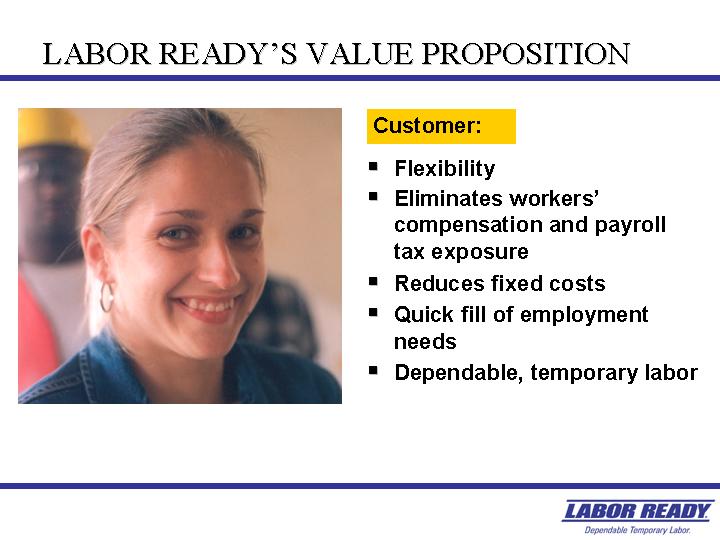
LABOR READY’S VALUE PROPOSITION
[GRAPHIC]
Workers:
• Opportunity
• Flexibility
• Work Today – Paid Today
• Bridge to Permanent Employment
• Safety Training
We Put People To Work.
[LOGO]
Customer:
• Flexibility
• Eliminates workers’ compensation and payroll tax exposure
• Reduces fixed costs
• Quick fill of employment needs
• Dependable, temporary labor
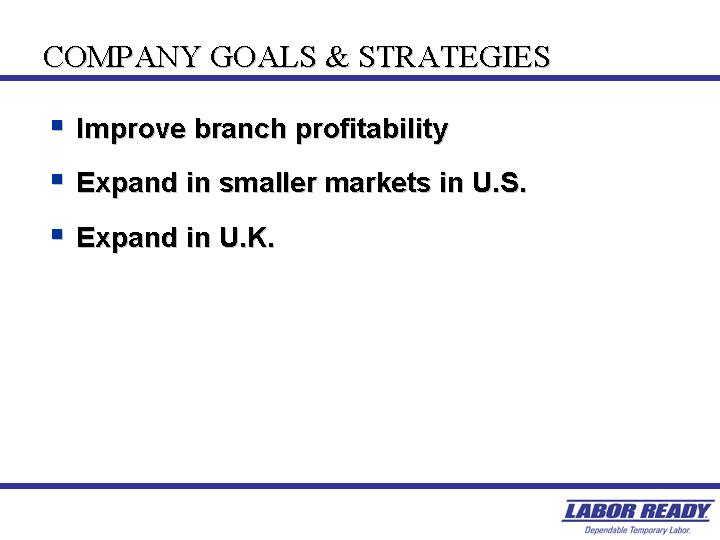
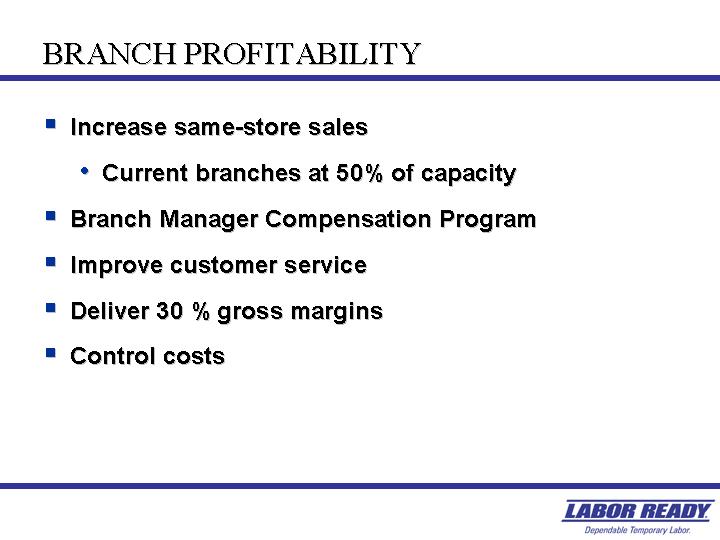
• Improve branch profitability
• Expand in smaller markets in U.S.
• Expand in U.K.
• Increase same-store sales
• Current branches at 50% of capacity
• Branch Manager Compensation Program
• Improve customer service
• Deliver 30 % gross margins
• Control costs
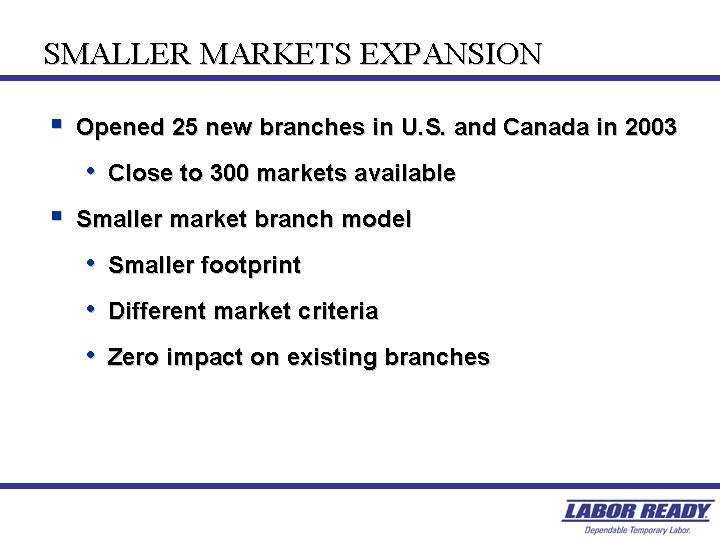
• Opened 25 new branches in U.S. and Canada in 2003
• Close to 300 markets available
• Smaller market branch model
• Smaller footprint
• Different market criteria
• Zero impact on existing branches
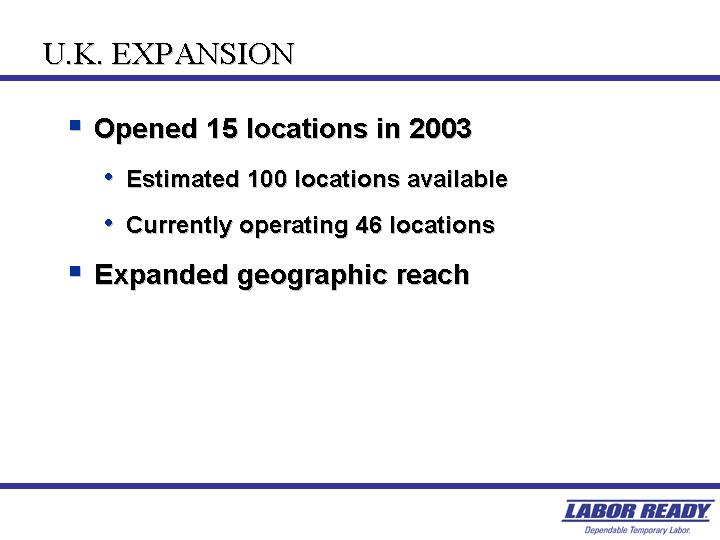
• Opened 15 locations in 2003
• Estimated 100 locations available
• Currently operating 46 locations
• Expanded geographic reach
• Sales Trends
• Smaller Market Branch Update
• U.K. Update
• Leverage in Current Operations
• Current Year Estimates
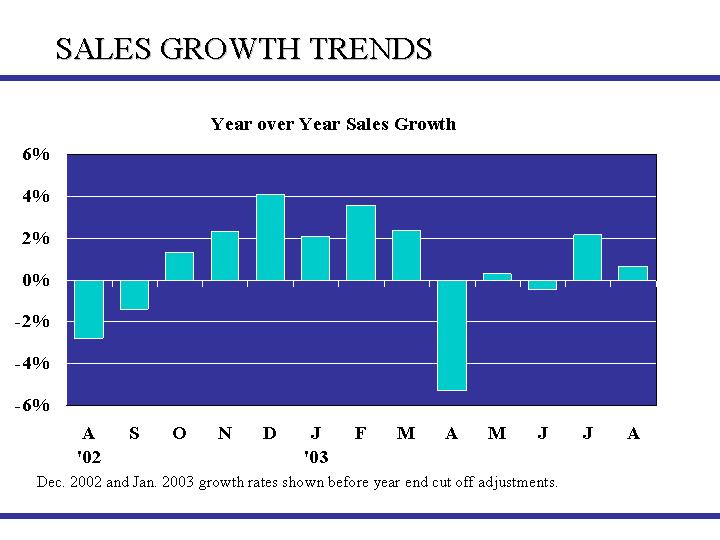
Year over Year Sales Growth
[CHART]
Dec. 2002 and Jan. 2003 growth rates shown before year end cut off adjustments.
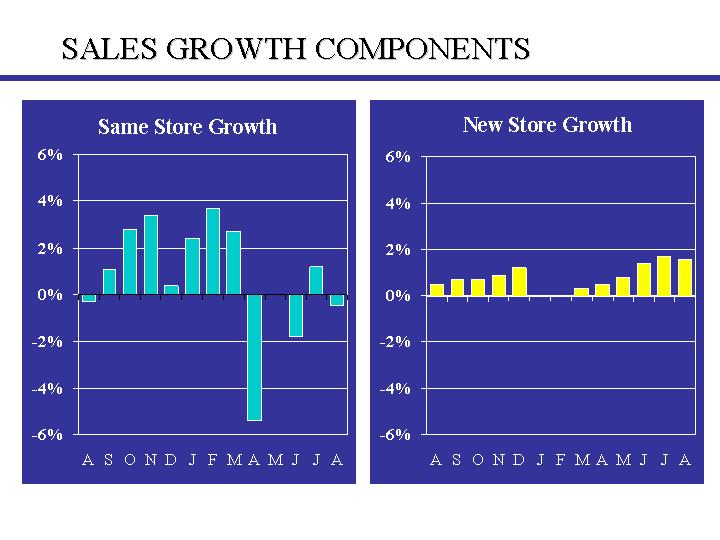
Same Store Growth
[CHART]
New Store Growth
[CHART]
[GRAPHIC]
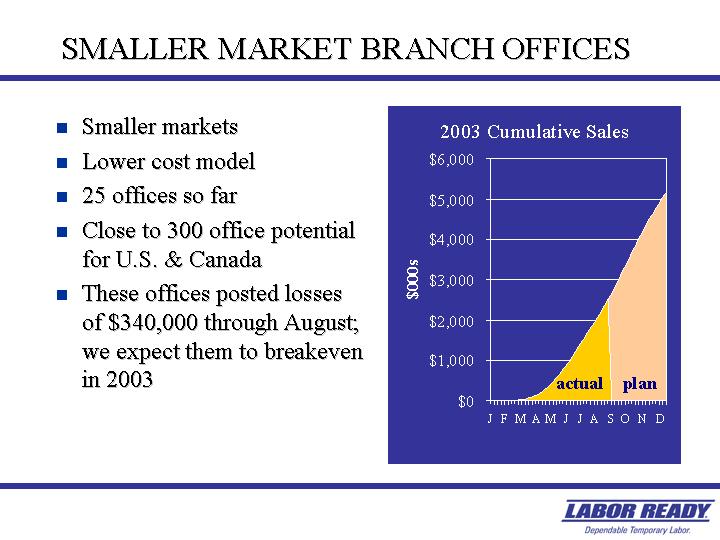
• Smaller markets
• Lower cost model
• 25 offices so far
• Close to 300 office potential for U.S. & Canada
• These offices posted losses of $340,000 through August; we expect them to breakeven in 2003
2003 Cumulative Sales
[CHART]
[LOGO]
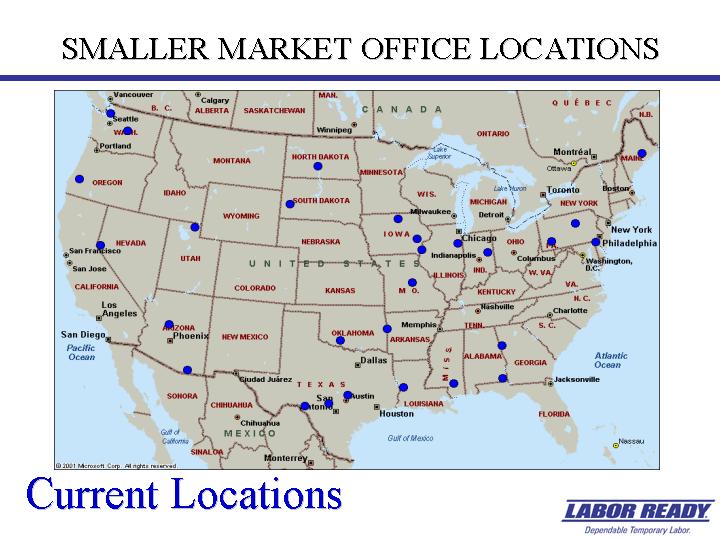
SMALLER MARKET OFFICE LOCATIONS
[GRAPHIC]
Current Locations
|
|
|
August 2003 YTD |
|
|
|
|
|
|||||||||
|
|
|
One Year |
|
15 New |
|
YTD All |
|
FY |
|
FY 2002 |
|
|||||
|
|
|
|
|
|
|
|
|
|
|
|
|
|||||
|
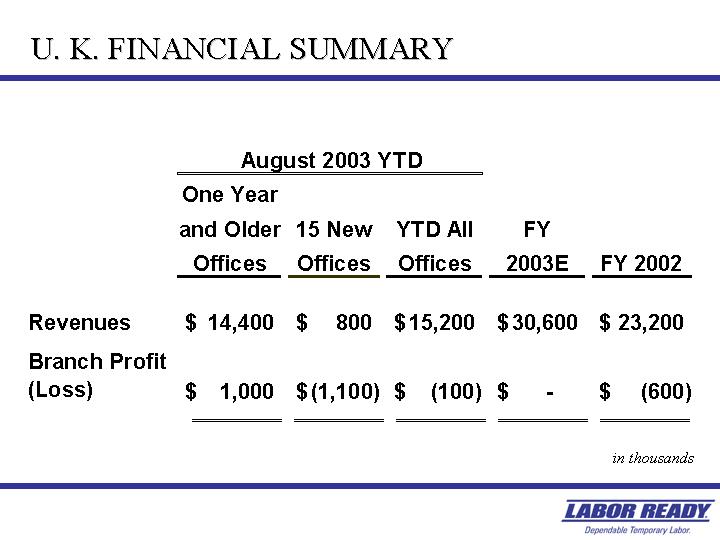
Revenues |
|
$ |
14,400 |
|
$ |
800 |
|
$ |
15,200 |
|
$ |
30,600 |
|
$ |
23,200 |
|
|
|
|
|
|
|
|
|
|
|
|
|
|
|||||
|
Branch Profit |
|
$ |
1,000 |
|
$ |
(1,100 |
) |
$ |
(100 |
) |
$ |
— |
|
$ |
(600 |
) |
in thousands
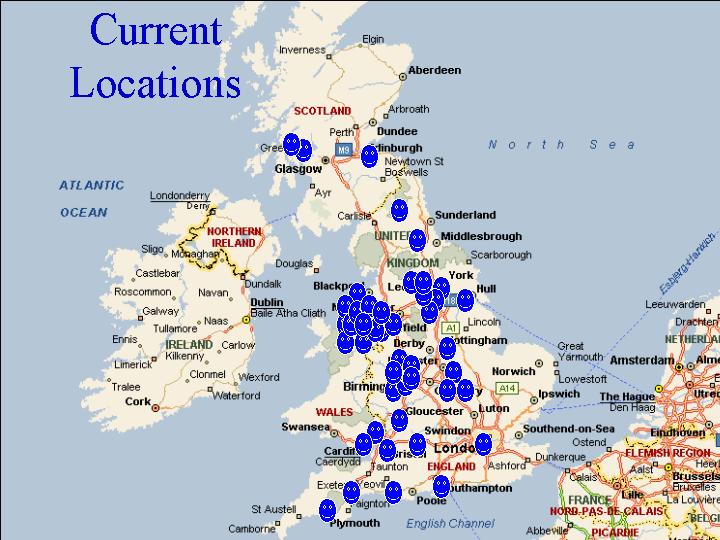
[GRAPHIC]
|
Current Locations |
|
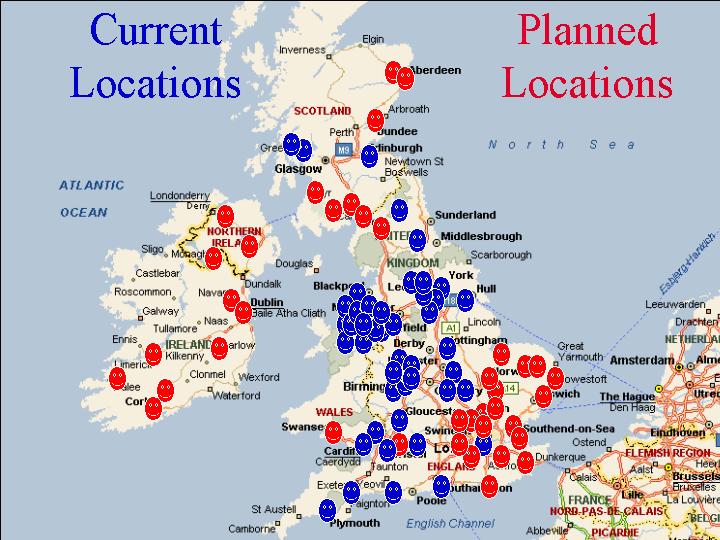
[GRAPHIC]
[CHART]
[LOGO]
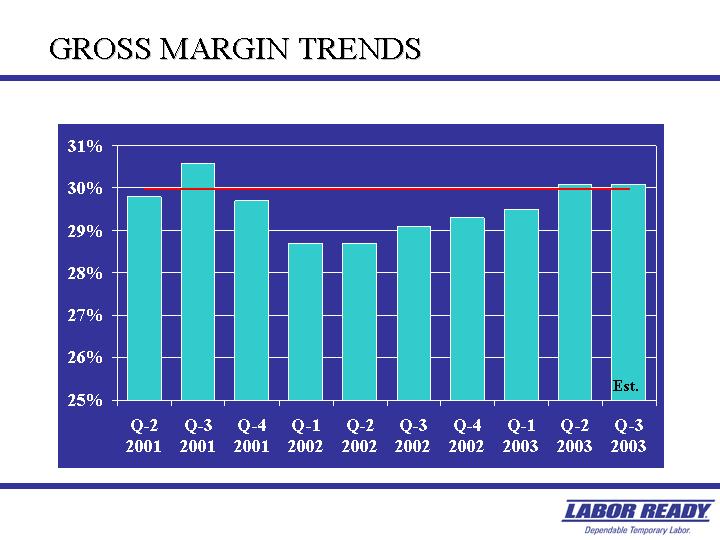
• Gross margin trends
• SG&A reduction
• Branch Maturation
[CHART]
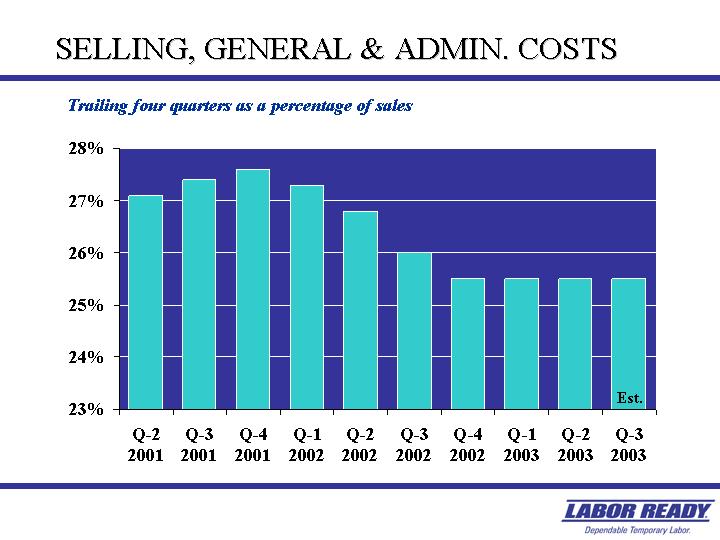
SELLING, GENERAL & ADMIN. COSTS
Trailing four quarters as a percentage of sales
[CHART]
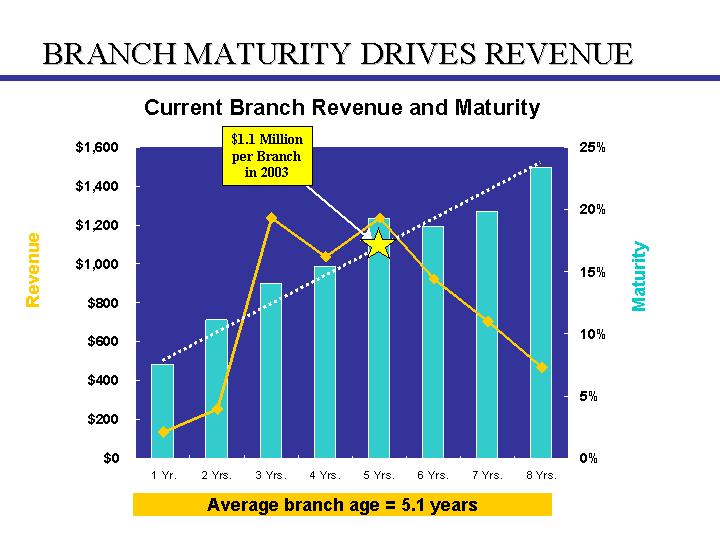
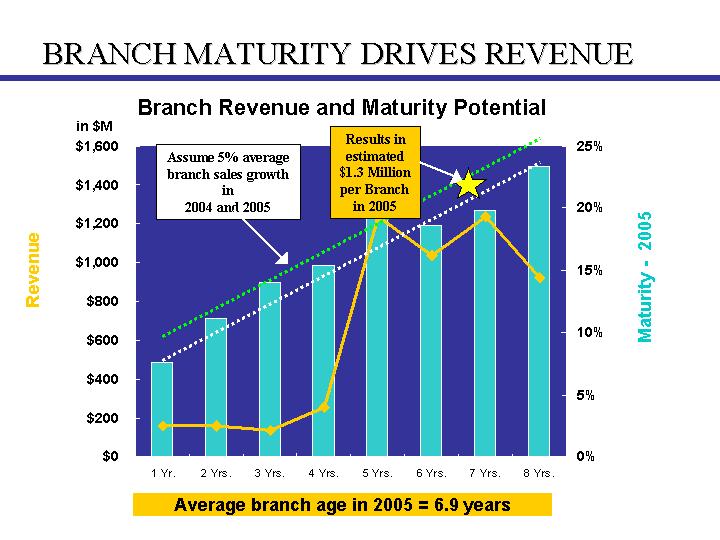
BRANCH MATURITY DRIVES REVENUE
Current Branch Revenue and Maturity
[CHART]
Average branch age = 5.1 years
Branch Revenue and Maturity Potential
[CHART]
Average branch age in 2005 = 6.9 years
|
|
|
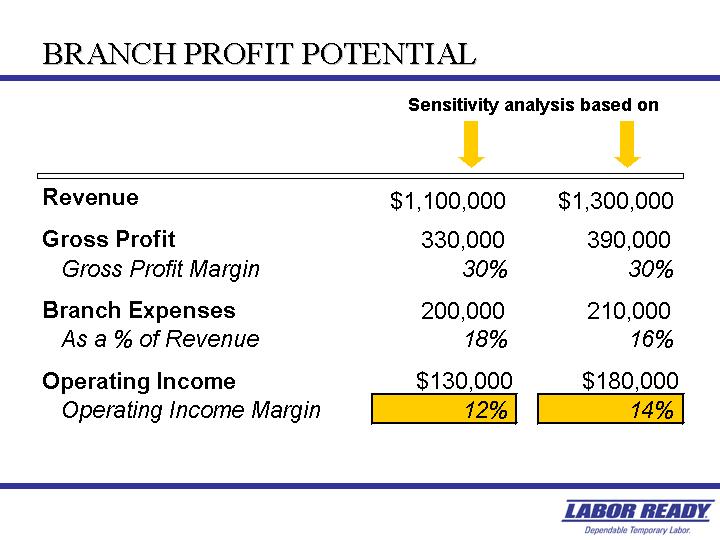
Sensitivity analysis based on |
|
||||
|
|
|
|
|
|
|
||
|
Revenue |
|
$ |
1,100,000 |
|
$ |
1,300,000 |
|
|
|
|
|
|
|
|
|
|
|
Gross Profit |
|
330,000 |
|
390,000 |
|
||
|
Gross Profit Margin |
|
30 |
% |
30 |
% |
||
|
|
|
|
|
|
|
||
|
Branch Expenses |
|
200,000 |
|
210,000 |
|
||
|
As a% of Revenue |
|
18 |
% |
16 |
% |
||
|
|
|
|
|
|
|
||
|
Operating Income |
|
$ |
130,000 |
|
$ |
180,000 |
|
|
Operating Income Margin |
|
12 |
% |
14 |
% |
||
[LOGO]
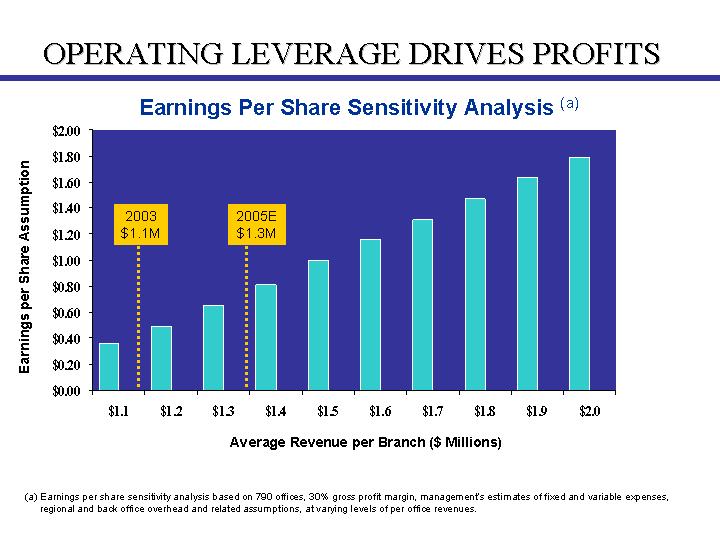
OPERATING LEVERAGE DRIVES PROFITS
Earnings Per Share Sensitivity Analysis (a)
[CHART]
Average Revenue per Branch ($ Millions)
(a) Earnings per share sensitivity analysis based on 790 offices, 30% gross profit margin, management’s estimates of fixed and variable expenses, regional and back office overhead and related assumptions, at varying levels of per office revenues.
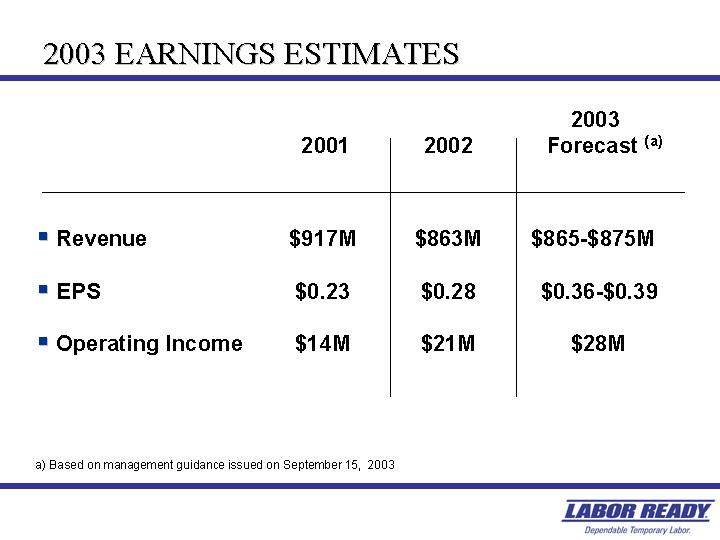
2003 EARNINGS ESTIMATES
|
|
|
2001 |
|
2002 |
|
2003 |
|
|||
|
|
|
|
|
|
|
|
|
|||
|
• Revenue |
|
$ |
917 |
M |
$ |
863 |
M |
$865-$875M |
|
|
|
|
|
|
|
|
|
|
|
|||
|
• EPS |
|
$ |
0.23 |
|
$ |
0.28 |
|
$0.36-$0.39 |
|
|
|
|
|
|
|
|
|
|
|
|||
|
• Operating Income |
|
$ |
14 |
M |
$ |
21 |
M |
$ |
28 |
M |
a) Based on management guidance issued on September 15, 2003
[LOGO]
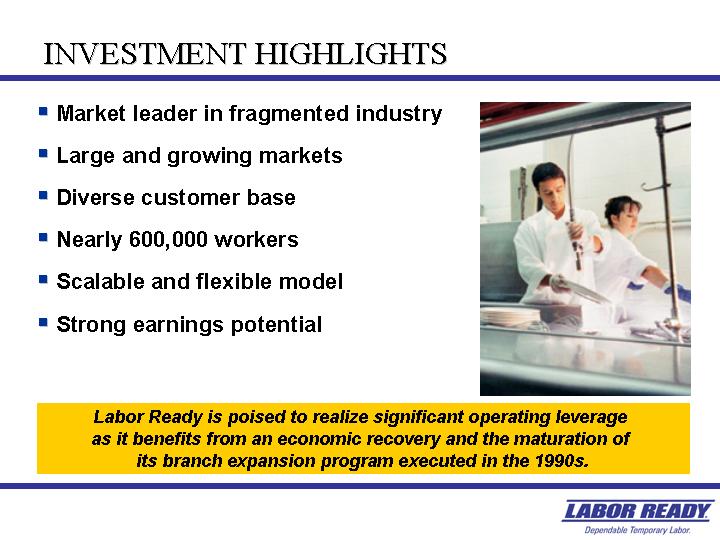
• Market leader in fragmented industry
• Large and growing markets
• Diverse customer base
• Nearly 600,000 workers
• Scalable and flexible model
• Strong earnings potential
[GRAPHIC]
Labor Ready is poised to realize
significant operating leverage
as it benefits from an economic recovery and the maturation of
its branch expansion program executed in the 1990s.