Exhibit 99.1

Link to searchable text of the slide shown above

Link to searchable text of the slide shown above
Link to searchable text of the slide shown above
Link to searchable text of the slide shown above
Link to searchable text of the slide shown above
Link to searchable text of the slide shown above
Link to searchable text of the slide shown above
Link to searchable text of the slide shown above
Link to searchable text of the slide shown above
Link to searchable text of the slide shown above
Link to searchable text of the slide shown above
Link to searchable text of the slide shown above
Link to searchable text of the slide shown above
Link to searchable text of the slide shown above
Link to searchable text of the slide shown above
Link to searchable text of the slide shown above
Link to searchable text of the slide shown above
Link to searchable text of the slide shown above
Link to searchable text of the slide shown above
Link to searchable text of the slide shown above
Link to searchable text of the slide shown above
Link to searchable text of the slide shown above
Link to searchable text of the slide shown above
Link to searchable text of the slide shown above
Link to searchable text of the slide shown above
Link to searchable text of the slide shown above
Link to searchable text of the slide shown above
Link to searchable text of the slide shown above
Searchable text section of graphics shown above
[GRAPHIC]
[LOGO]
INVESTOR RELATIONS
2nd QUARTER
2003
We Put People to Work.
SAFE HARBOR STATEMENT
Cautionary Note about Forward-Looking Statements
Certain statements made by us in this presentation that are not historical facts or that relate to future plans, events or performances are forward-looking statements within the meaning of the federal securities laws. Our actual results may differ materially from those expressed in any forward-looking statements made by us. Forward-looking statements involve a number of risks of uncertainties including, but not limited to, the risks described in the Company’s most recent 10-K and 10-Q filings. All forward-looking statements are qualified by those risk factors.
[LOGO]
2
INTRODUCTION TO PRESENTERS
• Joe Sambataro
CEO and President
• Steve Cooper
CFO and Executive Vice President
3
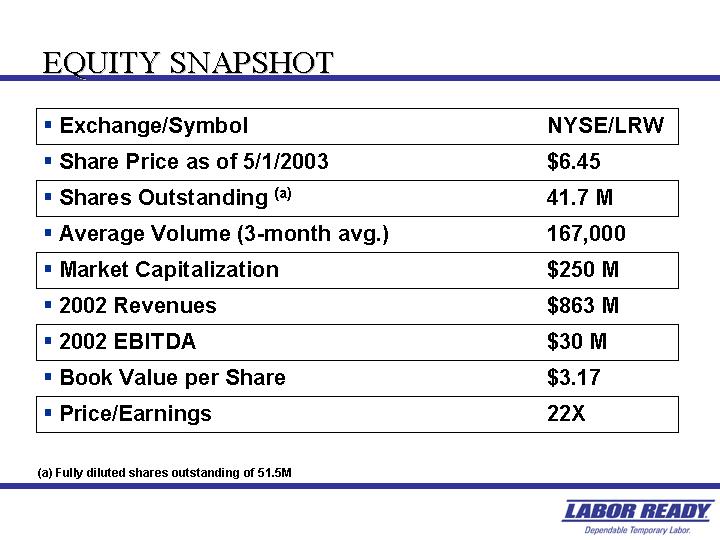
EQUITY SNAPSHOT
|
• Exchange/Symbol |
|
NYSE/LRW |
|
|
|
• Share Price as of 5/1/2003 |
|
$ |
6.45 |
|
|
• Shares Outstanding(a) |
|
41.7 M |
|
|
|
• Average Volume (3-month avg.) |
|
167,000 |
|
|
|
• Market Capitalization |
|
$ |
250 M |
|
|
• 2002 Revenues |
|
$ |
863 M |
|
|
• 2002 EBITDA |
|
$ |
30 M |
|
|
• Book Value per Share |
|
$ |
3.17 |
|
|
• Price/Earnings |
|
22X |
|
|
(a) Fully diluted shares outstanding of 51.5M
4
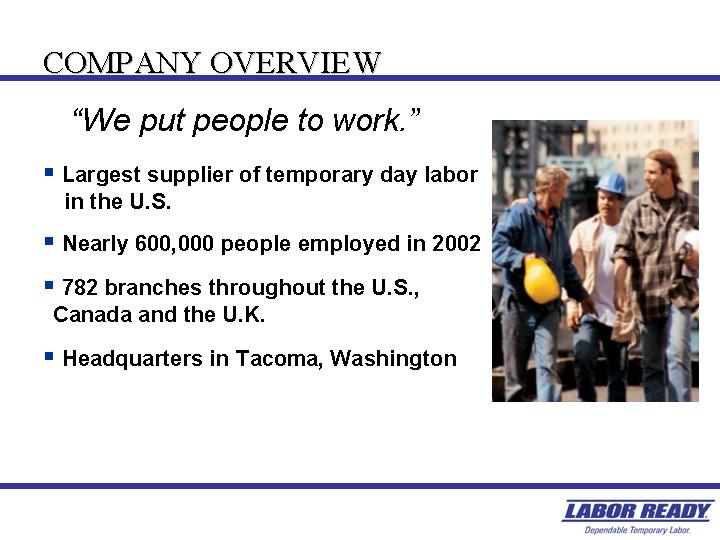
COMPANY OVERVIEW
[GRAPHIC]
“We put people to work.”
• Largest supplier of temporary day labor in the U.S.
• Nearly 600,000 people employed in 2002
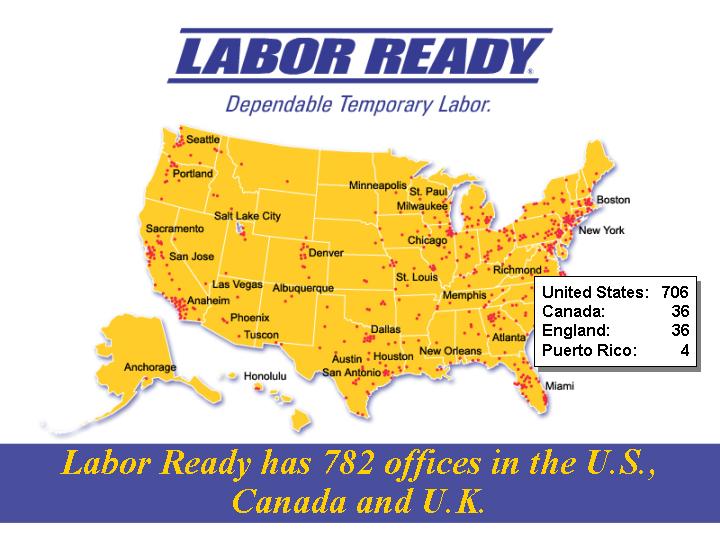
• 782 branches throughout the U.S., Canada and the U.K.
• Headquarters in Tacoma, Washington
5
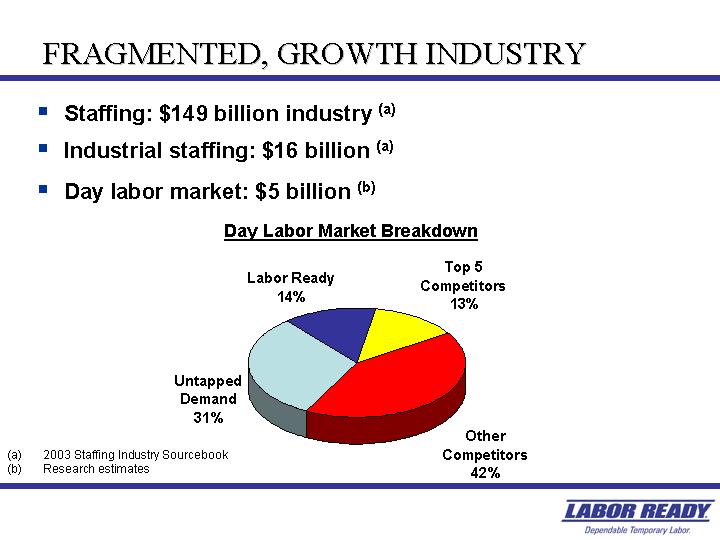
FRAGMENTED, GROWTH INDUSTRY
• Staffing: $149 billion industry(a)
• Industrial staffing: $16 billion(a)
• Day labor market: $5 billion(b)
Day Labor Market Breakdown
[CHART]
(a) 2003 Staffing Industry Sourcebook
(b) Research estimates
6
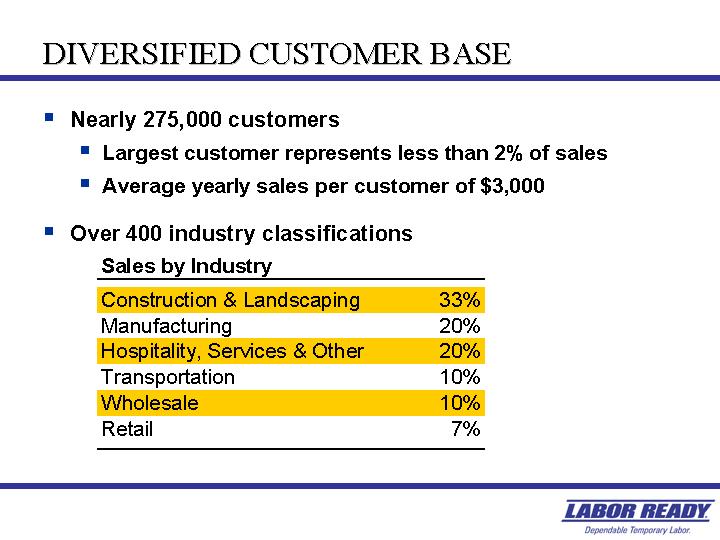
DIVERSIFIED CUSTOMER BASE
• Nearly 275,000 customers
• Largest customer represents less than 2% of sales
• Average yearly sales per customer of $3,000
• Over 400 industry classifications
Sales by Industry
|
Construction & Landscaping |
|
33 |
% |
|
Manufacturing |
|
20 |
% |
|
Hospitality, Services & Other |
|
20 |
% |
|
Transportation |
|
10 |
% |
|
Wholesale |
|
10 |
% |
|
Retail |
|
7 |
% |
7
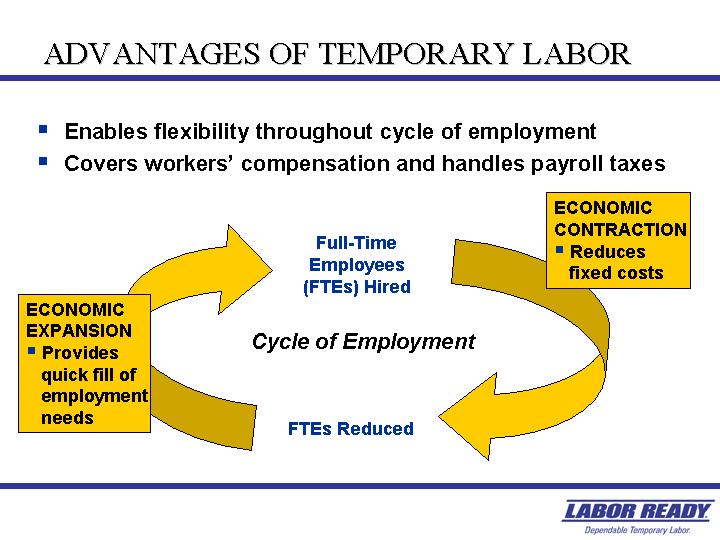
ADVANTAGES OF TEMPORARY LABOR
• Enables flexibility throughout cycle of employment
• Covers workers’ compensation and handles payroll taxes
[GRAPHIC]
8
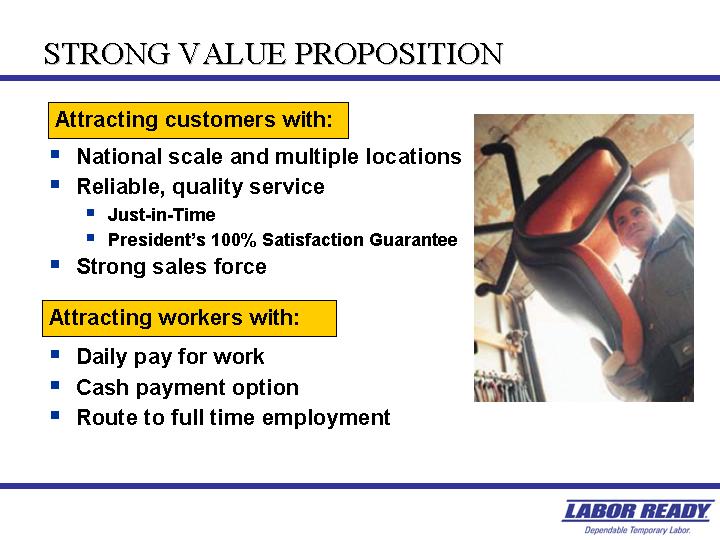
STRONG VALUE PROPOSITION
[GRAPHIC]
Attracting customers with:
• National scale and multiple locations
• Reliable, quality service
• Just-in-Time
• President’s 100% Satisfaction Guarantee
• Strong sales force
Attracting workers with:
• Daily pay for work
• Cash payment option
• Route to full time employment
9
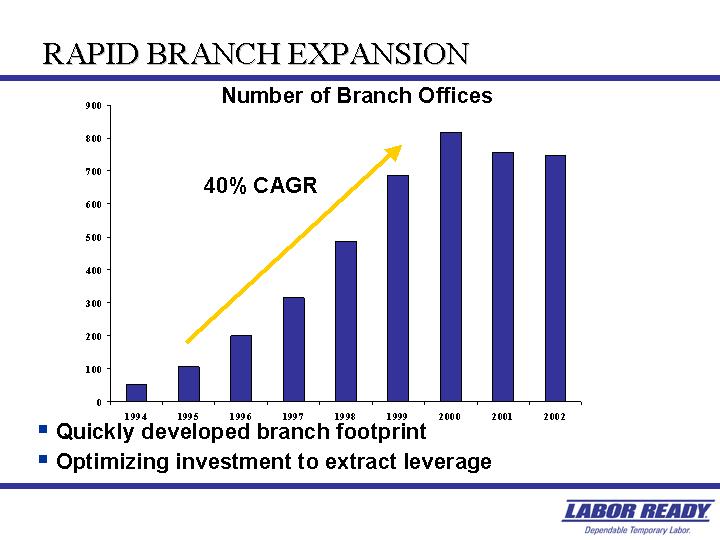
RAPID BRANCH EXPANSION
Number of Branch Offices
[CHART]
• Quickly developed branch footprint
• Optimizing investment to extract leverage
10
[GRAPHIC]
|
United States: |
|
706 |
|
|
Canada: |
|
36 |
|
|
England: |
|
36 |
|
|
Puerto Rico: |
|
4 |
|
11
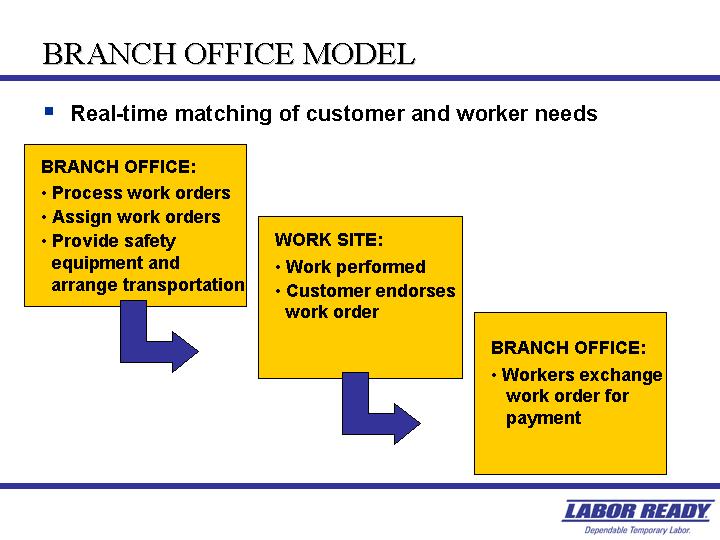
BRANCH OFFICE MODEL
• Real-time matching of customer and worker needs
BRANCH OFFICE:
• Process work orders
• Assign work orders
• Provide safety equipment and arrange transportation
WORK SITE:
• Work performed
• Customer endorses work order
BRANCH OFFICE:
• Workers exchange work order for payment
12
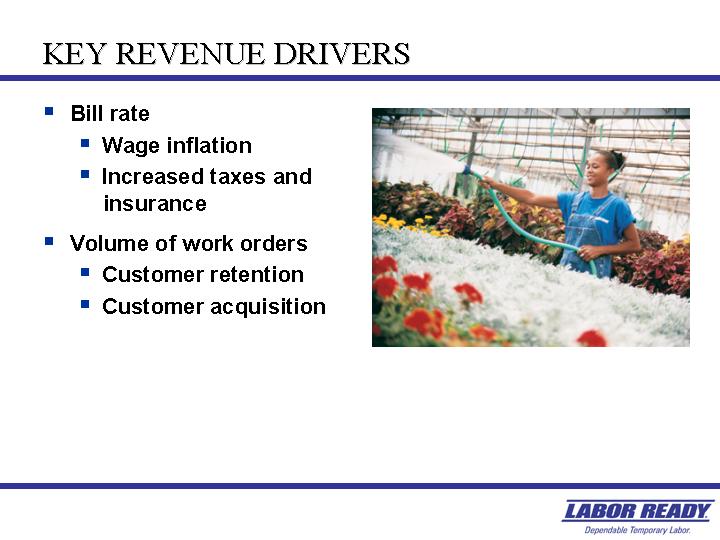
KEY REVENUE DRIVERS
[GRAPHIC]
• Bill rate
• Wage inflation
• Increased taxes and insurance
• Volume of work orders
• Customer retention
• Customer acquisition
13
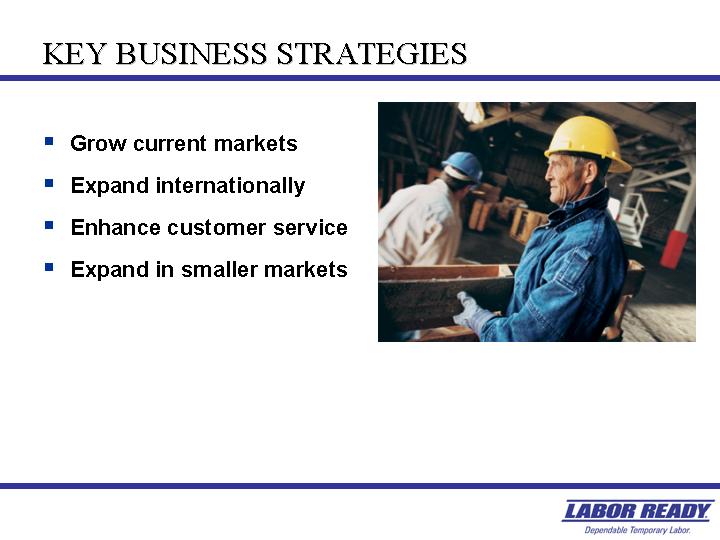
KEY BUSINESS STRATEGIES
[GRAPHIC]
• Grow current markets
• Expand internationally
• Enhance customer service
• Expand in smaller markets
14
FINANCIAL HIGHLIGHTS
• Improving profitability
• Consistent gross margins
• Significant operating leverage
• Strong balance sheet
15
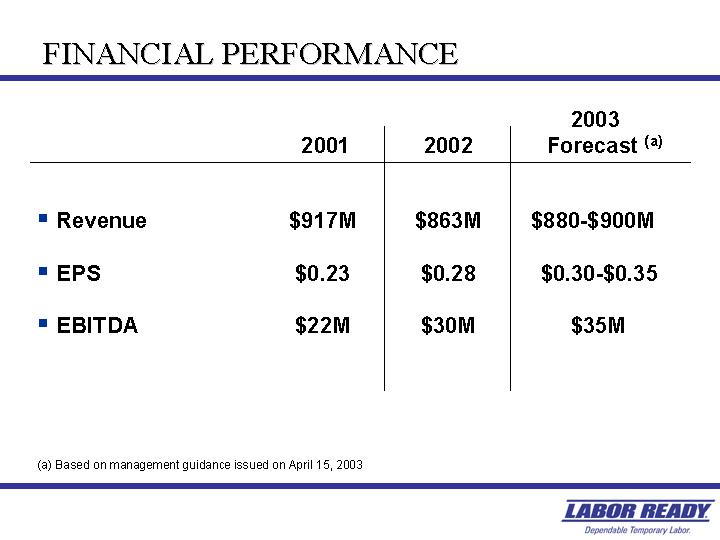
FINANCIAL PERFORMANCE
|
|
|
2001 |
|
2002 |
|
2003 |
|
|||
|
|
|
|
|
|
|
|
|
|||
|
• Revenue |
|
$ |
917M |
|
$ |
863M |
|
$ |
880-$900M |
|
|
|
|
|
|
|
|
|
|
|||
|
• EPS |
|
$ |
0.23 |
|
$ |
0.28 |
|
$ |
0.30-$0.35 |
|
|
|
|
|
|
|
|
|
|
|||
|
• EBITDA |
|
$ |
22M |
|
$ |
30M |
|
$ |
35M |
|
(a) Based on management guidance issued on April 15, 2003
16
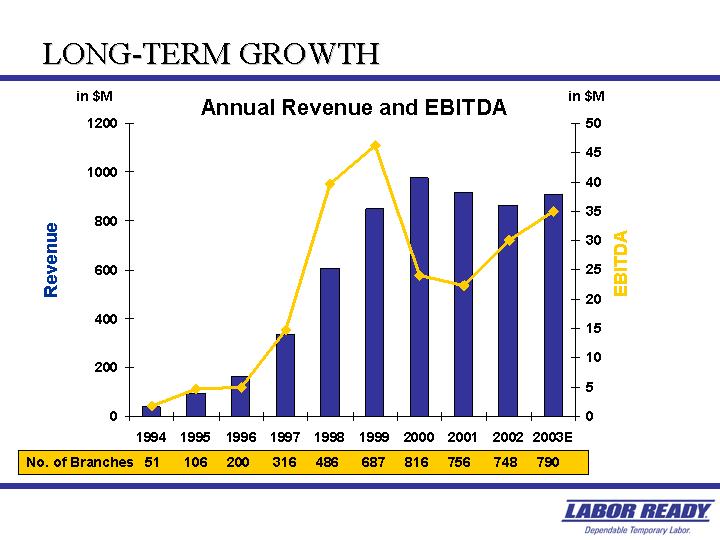
LONG-TERM GROWTH
Annual Revenue and EBITDA
[CHART]
17
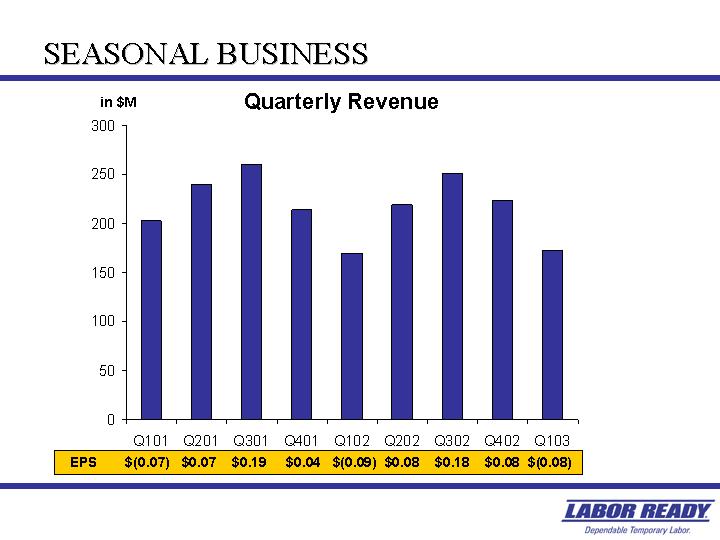
SEASONAL BUSINESS
Quarterly Revenue
[CHART]
18
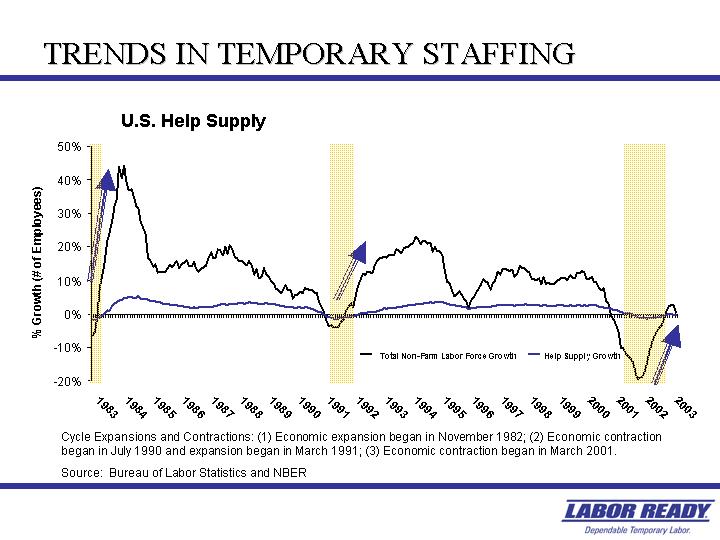
TRENDS IN TEMPORARY STAFFING
U.S. Help Supply
[CHART]
Cycle Expansions and Contractions: (1) Economic expansion began in November 1982; (2) Economic contraction began in July 1990 and expansion began in March 1991; (3) Economic contraction began in March 2001.
Source: Bureau of Labor Statistics and NBER
19
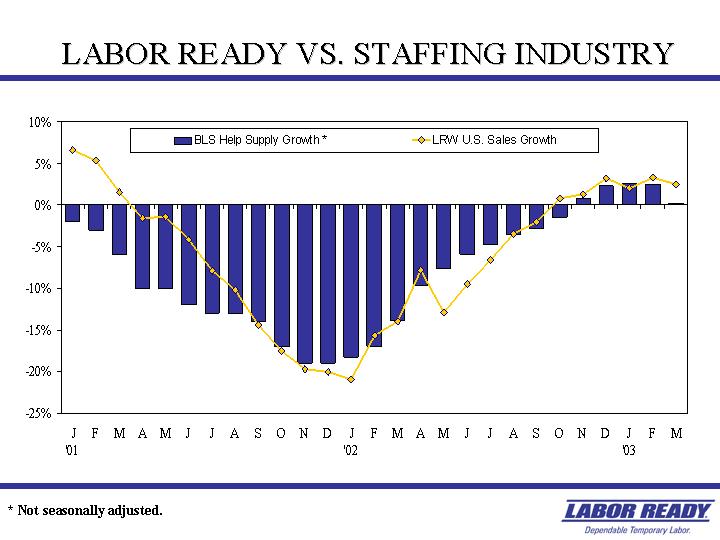
LABOR READY VS. STAFFING INDUSTRY
[CHART]
* Not seasonally adjusted.
20
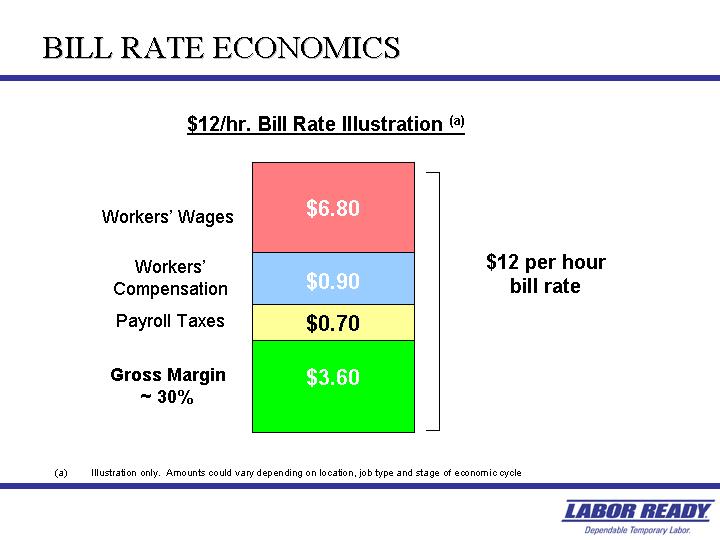
BILL RATE ECONOMICS
$12/hr. Bill Rate Illustration(a)
[CHART]
(a) Illustration only. Amounts could vary depending on location, job type and stage of economic cycle
21
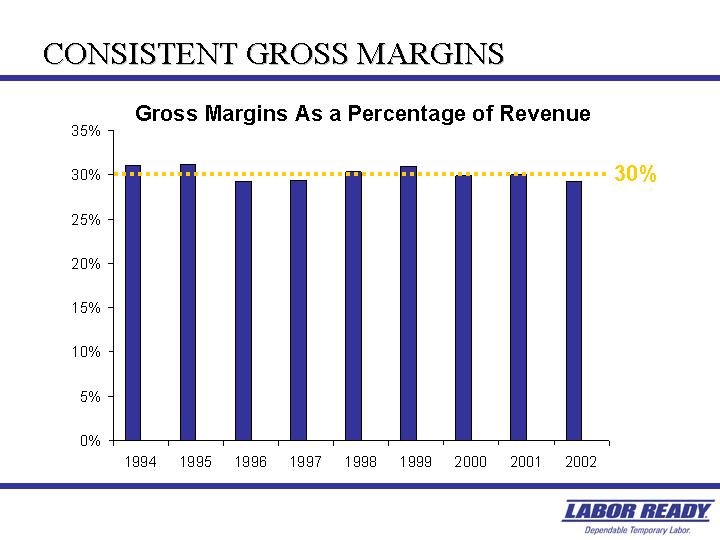
CONSISTENT GROSS MARGINS
Gross Margins As a Percentage of Revenue
[CHART]
22
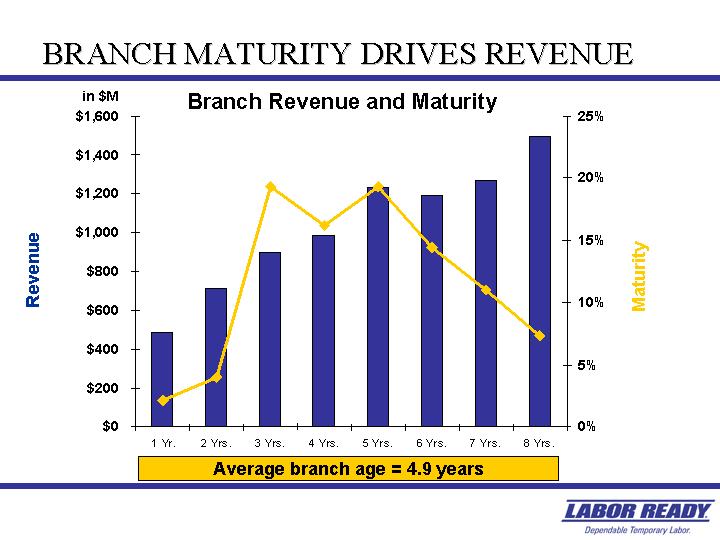
BRANCH MATURITY DRIVES REVENUE
Branch Revenue and Maturity
[CHART]
23
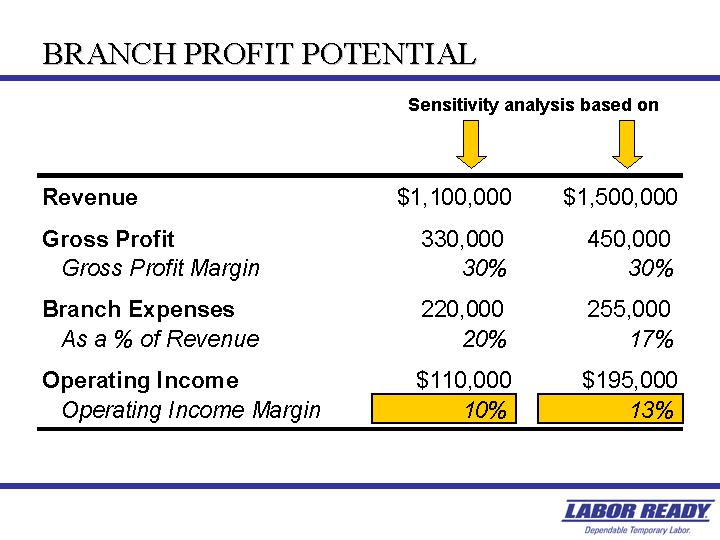
BRANCH PROFIT POTENTIAL
|
|
|
Sensitivity analysis based on |
|
||||
|
|
|
|
|
|
|
||
|
Revenue |
|
$ |
1,100,000 |
|
$ |
1,500,000 |
|
|
|
|
|
|
|
|
||
|
Gross Profit |
|
330,000 |
|
450,000 |
|
||
|
Gross Profit Margin |
|
30 |
% |
30 |
% |
||
|
|
|
|
|
|
|
||
|
Branch Expenses |
|
220,000 |
|
255,000 |
|
||
|
As a % of Revenue |
|
20 |
% |
17 |
% |
||
|
|
|
|
|
|
|
||
|
Operating Income |
|
$ |
110,000 |
|
$ |
195,000 |
|
|
Operating Income Margin |
|
10 |
% |
13 |
% |
||
24
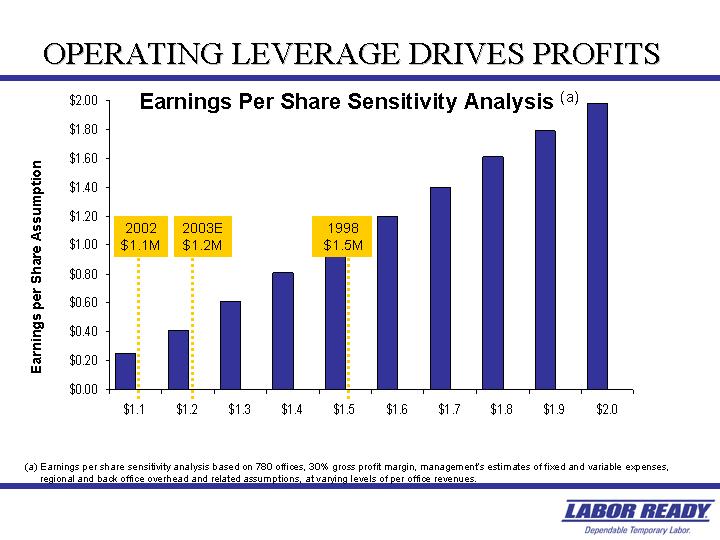
OPERATING LEVERAGE DRIVES PROFITS
Earnings Per Share Sensitivity Analysis(a)
[CHART]
(a) Earnings per share sensitivity analysis based on 780 offices, 30% gross profit margin, management’s estimates of fixed and variable expenses, regional and back office overhead and related assumptions, at varying levels of per office revenues.
25
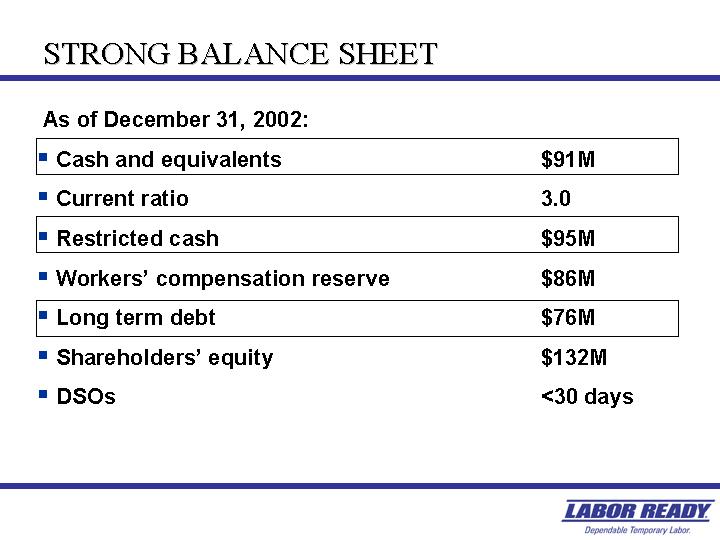
STRONG BALANCE SHEET
|
As of December 31, 2002: |
|
|
|
|
|
• Cash and equivalents |
|
$ |
91M |
|
|
• Current ratio |
|
3.0 |
|
|
|
• Restricted cash |
|
$ |
95M |
|
|
• Workers’ compensation reserve |
|
$ |
86M |
|
|
• Long term debt |
|
$ |
76M |
|
|
• Shareholders’ equity |
|
$ |
132M |
|
|
• DSOs |
|
<30 days |
|
|
26
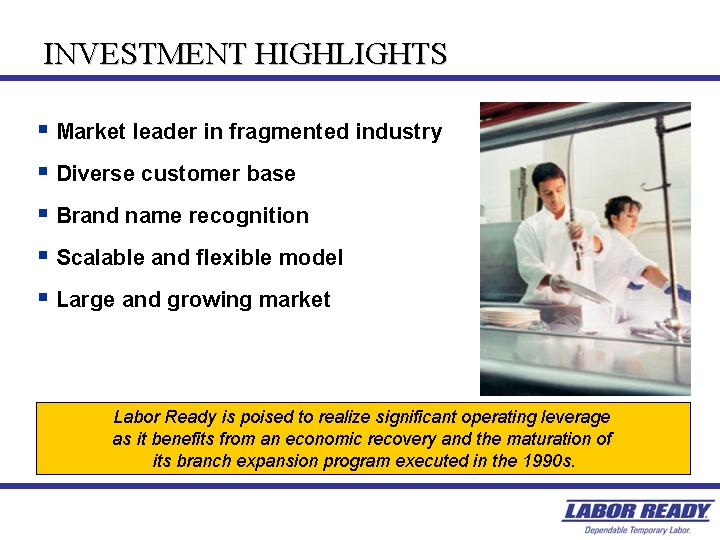
INVESTMENT HIGHLIGHTS
[GRAPHIC]
• Market leader in fragmented industry
• Diverse customer base
• Brand name recognition
• Scalable and flexible model
• Large and growing market
Labor Ready is poised to realize significant operating leverage as it benefits from an economic recovery and the maturation of its branch expansion program executed in the 1990s.
27
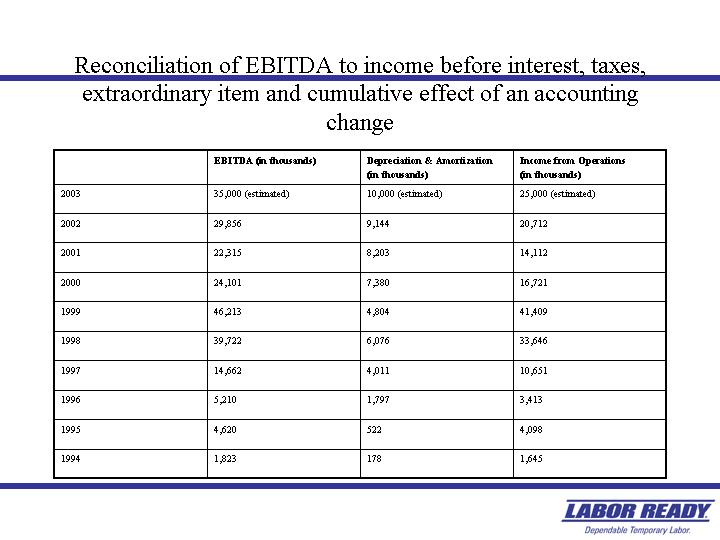
Reconciliation of EBITDA to income before interest, taxes,
extraordinary item and cumulative effect of an accounting
change
|
|
|
EBITDA |
|
Depreciation & Amortization |
|
Income from Operations |
|
|
|
|
(in thousands) |
|
(in thousands) |
|
(in thousands) |
|
|
|
|
|
|
|
|
|
|
|
2003 |
|
35,000 (estimated) |
|
10,000 (estimated) |
|
25,000 (estimated) |
|
|
|
|
|
|
|
|
|
|
|
2002 |
|
29,856 |
|
9,144 |
|
20,712 |
|
|
|
|
|
|
|
|
|
|
|
2001 |
|
22,315 |
|
8,203 |
|
14,112 |
|
|
|
|
|
|
|
|
|
|
|
2000 |
|
24,101 |
|
7,380 |
|
16,721 |
|
|
|
|
|
|
|
|
|
|
|
1999 |
|
46,213 |
|
4,804 |
|
41,409 |
|
|
|
|
|
|
|
|
|
|
|
1998 |
|
39,722 |
|
6,076 |
|
33,646 |
|
|
|
|
|
|
|
|
|
|
|
1997 |
|
14,662 |
|
4,011 |
|
10,651 |
|
|
|
|
|
|
|
|
|
|
|
1996 |
|
5,210 |
|
1,797 |
|
3,413 |
|
|
|
|
|
|
|
|
|
|
|
1995 |
|
4,620 |
|
522 |
|
4,098 |
|
|
|
|
|
|
|
|
|
|
|
1994 |
|
1,823 |
|
178 |
|
1,645 |
|
28