UNITED STATES
SECURITIES AND EXCHANGE COMMISSION
Washington, D.C. 20549
FORM 10-K
ý ANNUAL REPORT PURSUANT TO SECTION 13 OR 15(d) OF THE
SECURITIES EXCHANGE ACT OF 1934
For the fiscal year ended: December 26, 2008
or
o TRANSITION REPORT PURSUANT TO SECTION 13 OR 15(d) OF THE
SECURITIES EXCHANGE ACT OF 1934
Commission File Number: 001-14543
TrueBlue, Inc.
(Exact name of Registrant as specified in its charter)
Washington |
91-1287341 (IRS Employer Identification No.) |
|
1015 A Street, Tacoma, Washington |
98402 |
Registrant's telephone number, including area code: (253) 383-9101
Securities registered pursuant to Section 12(b) of the Act:
| Title of each class Common Stock without par value |
Name of each exchange on which registered The New York Stock Exchange |
Securities registered under Section 12(g) of the Act: None
Indicate by check mark if the registrant is a well-known seasoned issuer, as defined in Rule 405 of the Securities Act. Yes ý No o
Indicate by check mark if the registrant is not required to file reports pursuant to Section 13 or Section 15(d) of the Act. Yes o No ý
Indicate by check mark whether the registrant (1) has filed all reports required to be filed by Section 13 or 15 (d) of the Securities Exchange Act of 1934 during the preceding 12 months (or for such shorter period that the registrant was required to file such reports), and (2) has been subject to such filing requirements for the past 90 days Yes ý No o
Indicate by check mark if disclosure of delinquent filers pursuant to Item 405 of Regulation S-K is not contained herein and will not be contained, to the best of registrant's knowledge, in definitive proxy or information statements incorporated by reference in Part III of this Form 10-K or any amendment to this Form 10-K. ý
Indicate by check mark whether the registrant is a large accelerated filer, an accelerated filer, a non-accelerated filer, or a smaller reporting company. See the definitions of "large accelerated filer," "accelerated filer" and "smaller reporting company" in Rule 12b-2 of the Exchange Act. Large accelerated filer ý Accelerated filer o Non-accelerated filer o (Do not check if a smaller reporting company) Smaller reporting company o
Indicate by check mark if the registrant is a shell company (as defined in Rule 12b-2 of the Exchange Act). Yes o No ý
The aggregate market value (based on the NYSE quoted closing price) of the common stock held by non-affiliates of the registrant as of the last business day of the second fiscal quarter, June 27, 2008, was approximately $0.575 billion.
As of February 10, 2009, there were 43,285,656 shares of the registrant's common stock outstanding.
DOCUMENTS INCORPORATED BY REFERENCE
The information required by Part III of this report is incorporated by reference from the registrant's definitive proxy statement, relating to the Annual Meeting of Shareholders scheduled to be held May 13, 2009, which definitive proxy statement will be filed not later than 120 days after the end of the fiscal year to which this report relates.
COMMENT ON FORWARD LOOKING STATEMENTS
This Form 10-K contains forward-looking statements. These statements relate to our expectations for future events and future financial performance. Generally, the words "anticipate," "believe," "expect," "intend," "plan" and similar expressions identify forward-looking statements. Forward-looking statements involve risks and uncertainties, and future events and circumstances could differ significantly from those anticipated in the forward-looking statements. These statements are only predictions. Actual events or results may differ materially. Factors which could affect our financial results are described in Item 1A of this Form 10-K. Readers are cautioned not to place undue reliance on these forward-looking statements, which speak only as of the date hereof. Although we believe that the expectations reflected in the forward-looking statements are reasonable, we cannot guarantee future results, levels of activity, performance or achievements. Moreover, neither we nor any other person assume responsibility for the accuracy and completeness of the forward-looking statements. We undertake no duty to update any of the forward-looking statements after the date of this report to conform such statements to actual results or to changes in our expectations.
Page -2
TrueBlue, Inc.
2008 Annual Report on Form 10-K
Table of Contents
Page -3
TrueBlue, Inc.
Form 10-K
Description of the Business
TrueBlue, Inc. ("TrueBlue," "we," "us," "our") is an international provider of temporary blue-collar staffing. In 2008, we put approximately 500,000 people to work through the following brands: Labor Ready for general labor, Spartan Staffing for light industrial services, and CLP Resources, PlaneTechs, and TLC for skilled trades. Headquartered in Tacoma, Washington, we serve approximately 250,000 small to mid-sized businesses in the construction, warehousing, hospitality, landscaping, transportation, light manufacturing, retail, wholesale, facilities, sanitation, and aviation industries.
We began operations in 1989 under the name Labor Ready, Inc. providing on-demand, general labor staffing services. Starting in 2004, we began acquiring additional brands to expand our service offerings to customers in the blue-collar staffing market. Effective December 18, 2007, Labor Ready, Inc. changed its name to TrueBlue, Inc. The name change reflects our vision to be the leading provider of blue-collar staffing with multiple brands serving the temporary staffing industry. Our former company name of Labor Ready remains as our primary brand name for on-demand, general labor staffing services.
Temporary Staffing Industry
The temporary staffing industry evolved out of the need to minimize the cost and effort of hiring and administering permanent employees in response to temporary changes in business conditions. The demand for temporary employees has been driven primarily by the need to satisfy peak production and service requirements and to temporarily replace full-time employees absent due to illness, vacation or abrupt termination. Competitive pressures have forced businesses to focus on reducing costs, including converting fixed or permanent labor costs to variable or flexible costs. During an economic downturn, businesses generally reduce their use of temporary staffing as they experience lower levels of demand from consumers.
The temporary staffing industry includes a number of markets focusing on business needs that vary widely in duration of assignment and level of technical specialization. We operate within the industrial staffing, or blue-collar staffing market of the temporary staffing industry. This market is fragmented among a large number of providers and presents opportunities for larger, well-capitalized companies to compete effectively. Our primary competitive advantages include:
The blue collar staffing market is experiencing significant decreases in demand as a result of the current recession which has negatively impacted our performance. We believe the markets we serve will continue to remain under pressure until the overall economy stabilizes and begins to grow again.
Long-term Strategy
Our long-term business strategies for profitable growth remain unchanged. We plan to expand our market share in the blue-collar staffing markets we serve; be the industry customer service leader; and operate multiple blue-collar staffing brands. We believe we are the gateway to individual growth for our temporary workers and the gateway for our customers seeking to reduce their costs, convert their costs to variable costs, and ultimately grow their businesses.
Page -4
We plan to grow our market share in the industrial staffing market by executing on the following objectives:
Our primary objective is to increase existing branch revenue. Same branch revenue generally drives increasing operating margins due to the fixed costs in our business. We believe the key to increasing same branch revenue is largely tied to our strategy of becoming the service leader in the blue-collar staffing market. During the economic slow down and subsequent recession, same branch revenue has declined. We remain committed to service leadership and growing our market share during the recession.
Our second objective is to open new branches that can reach or exceed performance standards and close branches that are under-performing. However, during recessionary times, we will reduce branch openings and increase the number of branch closings. Primary factors influencing which branches to close included financial performance, ability to consolidate with another branch, tenure and quality of branch management, market potential of branch location, and long-term potential of the location. During 2008, we opened 4 new branches, closed 73 branches, and sold the remaining 29 branches in the United Kingdom for a total reduction of 102 branches. During 2009, we plan to be disciplined in our approach to new branch openings and closures and adjust as needed to further worsening in the economy. Upon return to favorable economic conditions we plan to focus our new branch openings in the Spartan Staffing, CLP Resources, and TLC brands in order to build a national presence. We continually analyze individual branch results, and may close further branches in 2009 that do not meet specific performance standards.
Our third objective is to expand into new markets by making strategic acquisitions in the blue-collar staffing market that can produce strong returns on investment. Our focus is on the light industrial and skilled trades staffing services. During the first half of 2008, we purchased Personnel Management, Inc. ("PMI") and TLC Services Group, Inc. ("TLC"). We purchased all of the stock of PMI, a light industrial staffing company, adding 44 branches to our light industrial network. The acquisition of PMI expanded our reach into key, adjacent markets where Spartan Staffing operates with long-standing relationships with clients and experienced, tenured branch employees. PMI was integrated with the Spartan Staffing brand effective December 27, 2008. We also purchased substantially all of the assets of TLC. Founded in 1975, TLC is a skilled truck-driver staffing provider with operations in Arizona, California, Idaho, Nevada, New Jersey, Oregon, Pennsylvania, Texas, Utah and Washington. During the current recession, management has no plans to make any further acquisitions.
We plan to be the service leader by executing on the following objectives:
We are building a sales culture with a commitment to capturing and cultivating customer loyalty. We build a relationship of trust with our customers, obtaining a firm understanding of their needs, finding solutions, and ensuring our service delivery meets or exceeds expectations. Our ability to provide the right temporary employee, at the right time, and for the right duration is important to meeting our customers' needs. We remain committed to maintaining a safe work environment through our safety and risk management programs to keep our temporary employees safe and better serve our customers.
Our customers value the relationship with our branch personnel. We focus on attracting and retaining high quality branch personnel. We invest in a variety of training programs including programs covering the following topics: company values, sales techniques, customer service and account management, and management of branch operations. We offer competitive compensation and benefits.
We plan to operate with multiple blue-collar brands.
We plan to achieve a dominant market position in each of our blue-collar brands. We have achieved a dominant position with our general labor brand Labor Ready. That blueprint for success is being applied to Spartan Staffing, CLP Resources, PlaneTechs, and TLC. We believe these brands can be expanded into a national presence with dominant market positions. We will continue to invest in building effective and efficient support services. Those support services are leveraged across brands to provide cost efficient support services to our operations.
Brand Operations
Labor Ready – On-Demand, General Labor Services. Labor Ready provides general labor on an on-demand basis. Our customers' needs are generally project based and only last a few days. Of primary importance to our customers is our ability to supply the general laborers needed each day on time and often with same day notice. Our service is especially important to customers that value a commitment to compliance with applicable laws and regulations. In 1994, we
Page -5
expanded our Labor Ready brand for on-demand labor into Canada. At the end of 2008, the Labor Ready brand had in aggregate 697 branches in all 50 states, Puerto Rico, and Canada.
Spartan Staffing – Light Industrial Temporary Services. Spartan Staffing provides workers to the light industrial market which includes, among others, manufacturing, logistics, and warehousing. Spartan Staffing enables our customers to have access to a wide variety of workers. Spartan Staffing was acquired in 2004 with 10 branches and we continued to open new branches through 2007. In April 2008, we added 44 branches to our light industrial temporary services with the purchase of PMI. At the end of fiscal 2008, Spartan Staffing operated 64 branches.
CLP Resources ("CLP") – Skilled Construction Trade Services. CLP provides skilled trades people primarily to the commercial construction market. Customers value CLP's ability to supply high-quality skilled trades people. This enables our customers to obtain immediate value by placing a highly productive and skilled employee on the job site. The staffing assignments are project based but typically last several weeks since the tradesperson is often needed for a substantial amount of the construction process. CLP was acquired in 2005 with 50 branches and we continued to open new branches through 2007. In April 2007, we acquired 17 branches through the purchase of Skilled Services Corporation ("SSC"). SSC was integrated with CLP effective in fiscal 2008. At the end of fiscal 2008, CLP operated 77 branches.
PlaneTechs – Skilled Aviation Services. PlaneTechs provides skilled staffing to the aviation maintenance, repair and overhaul, and aerospace manufacturing and assembly industries, through a full range of specialty technicians. PlaneTechs delivers an innovative approach to the flexible workforce requirements of the aviation industry. In December 2007, we purchased substantially all of the assets of PlaneTechs, LLC. PlaneTechs operates out of one branch facility in Oak Brook, IL.
Transportation Logistics Company ("TLC") – Professional Truck Drivers. TLC specializes in providing professional truck drivers and logistics personnel to the transportation and distribution industries and provides a new element of specialization to our skilled trades services. In February 2008, we purchased substantially all of the assets of TLC Services Group, Inc. TLC has operations in 10 states.
Page -6
The following table reconciles the number of TrueBlue branches open at the end of each of the last five fiscal years :
| |
TrueBlue Branches | |||||||||||||
|---|---|---|---|---|---|---|---|---|---|---|---|---|---|---|
| |
General Labor |
Light Industrial |
Skilled Trades (1) |
Total Branches |
||||||||||
| |
||||||||||||||
2003 Ending Branches |
779 | – | – | 779 | ||||||||||
Branches acquired (2) |
17 | 10 | – | 27 | ||||||||||
Branches opened |
33 | – | – | 33 | ||||||||||
Branches closed |
(24 | ) | – | – | (24 | ) | ||||||||
2004 Ending Branches |
805 | 10 | – | 815 | ||||||||||
Branches acquired (2) |
– | – | 50 | 50 | ||||||||||
Branches opened |
30 | 8 | 3 | 41 | ||||||||||
Branches closed |
(19 | ) | – | – | (19 | ) | ||||||||
2005 Ending Branches |
816 | 18 | 53 | 887 | ||||||||||
Branches acquired |
– | – | – | – | ||||||||||
Branches opened |
24 | 10 | 16 | 50 | ||||||||||
Branches closed |
(24 | ) | – | (1 | ) | (25 | ) | |||||||
2006 Ending Branches |
816 | 28 | 68 | 912 | ||||||||||
Branches acquired (2) |
– | – | 18 | 18 | ||||||||||
Branches opened |
5 | 7 | 10 | 22 | ||||||||||
Branches closed |
(47 | ) | (3 | ) | (8 | ) | (58 | ) | ||||||
2007 Ending Branches |
774 | 32 | 88 | 894 | ||||||||||
Branches acquired (2) |
– | 44 | 10 | 54 | ||||||||||
Branches opened |
– | – | 4 | 4 | ||||||||||
Branches closed (3) |
(77 | ) | (12 | ) | (13 | ) | (102 | ) | ||||||
2008 Ending Branches |
697 | 64 | 89 | 850 | ||||||||||
Information about Business Segments
TrueBlue operations are one reportable segment. Our operations are all in the blue-collar staffing market of the temporary labor industry and focus on supplying customers with temporary employees. All our brands have the following similar characteristics:
Page -7
We expect similar operating margins for our brands based on historical experience. The long-term performance expectations of all our brands are similar as are the underlying financial and economic metrics used to manage those brands.
Our international operations are not significant to our total operations for segment reporting purposes. In 2008 we sold the remaining Labor Ready branches in the United Kingdom. Total revenues from operations in the United Kingdom in 2008 were less than 2% of consolidated revenues.
Operations
Branch operations are organized into geographic areas. Each area is under the supervision of a manager who oversees branch performance. Within an area, multi-unit managers supervise branch operations and meet regularly with branch managers to discuss new customers, customer satisfaction, temporary workforce recruitment and retention, and operating performance. Similar meetings are conducted at the corporate level with regional management.
Branches are generally open five days a week, with extended hours as required to meet customer needs. Branch locations are generally staffed with a branch manager and two or more additional employees that focus on customer sales and service, temporary worker recruiting, screening and placement. Branches follow standardized and detailed operating procedures.
We believe that one of the most critical factors determining the success of a branch is selecting, hiring and retaining an effective branch manager. Each branch manager has the responsibility for recruiting and retaining a quality temporary workforce and capturing and cultivating customer loyalty. Each branch manager manages the operations of the branch which include the recruiting, dispatch and payment of temporary employees, meeting the needs of our customers with a guarantee of customer satisfaction, selling our services to new customers, as well as cost control through accident prevention, and compliance with the laws and regulations. We commit substantial resources to the training, development, and operational support of our branch managers.
Our Labor Ready, CLP, and Spartan Staffing brands own proprietary front-end software systems to process all required credit, work order, billing, collection and temporary worker payroll, together with other information and reporting systems necessary for the management of hundreds of thousands of temporary employees and operations in multiple locations. Corporate, brand management and branch staff can run a variety of reports on-demand, such as receivables aging, margin reports and customer activity reports. Regional, area, and district managers are able to monitor their territories from remote locations.
Our Customers
The majority of our customers require temporary employees for peak production and service requirements and to temporarily replace absent full time employees. We currently derive our revenue from a large number of customers and we are not dependent on any individual customer for more than 3% of our annual revenue. During 2008, we served approximately 250,000 customers. Our ten largest customers accounted for approximately 10.7% of total revenue in 2008, up from 4% for 2007 and 2006.
Our Temporary Employees
During 2008, we put approximately 500,000 people to work. We recruit temporary employees daily so that we can be responsive to the planned as well as unplanned needs of the customers we serve. Our customers know we can respond quickly to their labor needs. Under our "satisfaction guaranteed" policy, if the customer notifies us within an established time frame, temporary employees unsatisfactory to our customer are promptly replaced and the customer is not charged for their time. We attract our pool of temporary employees through advertising and word of mouth. We believe our focus
Page -8
on locating branches in areas convenient for our temporary employees is particularly important in attracting temporary employees. We consider our relations with temporary employees to be good.
Seasonality
Our business experiences seasonal fluctuation. Construction and landscaping businesses and, to a lesser degree, other customer businesses typically increase activity in spring, summer and early fall months and decrease activity in late fall and winter months. Inclement weather can slow construction and landscaping activities in such periods. As a result, we generally experience an increase in temporary labor demand in the spring, summer and early fall months, and lower demand in the late fall and winter months.
Competition
The blue-collar staffing market is highly competitive with limited barriers to entry. We compete with several multi-national full-service companies, specialized temporary staffing companies, as well as local companies. The majority of temporary staffing companies serving the blue-collar staffing market have local operations with fewer than five branches. In most geographic areas, no single company has a dominant share of the market. One or more of these competitors may decide at any time to enter or expand their existing activities in the blue-collar staffing market and provide new and increased competition to us. While entry to the market has limited barriers, lack of working capital frequently limits the growth of smaller competitors.
We believe that the primary competitive factors in obtaining and retaining customers are:
Competitive forces have historically limited our ability to raise our prices to immediately and fully offset increased costs of doing business, including increased labor costs, costs for workers' compensation and state unemployment insurance. As a result of these forces, we have in the past faced pressure on our operating margins. See Item 1A below of this Form 10-K– Risk Factors.
Government Regulations
We are in the business of employing people and placing them in the workplaces of other businesses. As a result, we are subject to a number of federal, state and local laws and regulations regulating our industry. Some of the most important areas of regulation include the following:
Patents and Trademarks
Our business is not presently dependent on any patents, licenses, franchises or concessions. "TrueBlue," "Labor Ready," "Spartan Staffing," "CLP Resources," "PlaneTechs," and certain other service marks are registered with the U.S. Patent and Trademark Office.
Page -9
Fiscal Year End
Our fiscal year is based on a 52/53-week year ending on the last Friday in December. In fiscal years consisting of 53 weeks the final quarter will consist of 14 weeks while in 52-week years all quarters will consist of 13 weeks. Our next fiscal year with 53 weeks will be fiscal 2010.
Financial Information about Geographic Areas
The following table depicts our revenue derived from within the United States and that derived from international operations for the past three years (in thousands). International operations include Canada and the United Kingdom.
| |
2008 | 2007 | 2006 | ||||||||||||||||
|---|---|---|---|---|---|---|---|---|---|---|---|---|---|---|---|---|---|---|---|
United States (including Puerto Rico) |
$ | 1,308,013 | 94.5% | $ | 1,288,456 | 93.0% | $ | 1,263,642 | 93.7% | ||||||||||
International Operations |
76,256 | 5.5% | 97,200 | 7.0% | 85,476 | 6.3% | |||||||||||||
Total revenue from services |
$ | 1,384,269 | 100% | $ | 1,385,656 | 100% | $ | 1,349,118 | 100% | ||||||||||
The following table depicts our net property and equipment located in the United States and the net property and equipment located in international operations for the past three years (in thousands).
| |
2008 | 2007 | 2006 | ||||||||||||||||
|---|---|---|---|---|---|---|---|---|---|---|---|---|---|---|---|---|---|---|---|
United States (including Puerto Rico) |
$ | 61,225 | 99.5% | $ | 43,644 | 97.2% | $ | 29,982 | 93.8% | ||||||||||
International Operations |
317 | 0.5% | 1,265 | 2.8% | 1,967 | 6.2% | |||||||||||||
Total property and equipment, net |
$ | 61,542 | 100% | $ | 44,909 | 100% | $ | 31,949 | 100% | ||||||||||
The international operations are dependent on shared information and communications equipment housed and maintained in the United States.
Number of Employees
As of February 10, 2009, we employed approximately 2,900 full time and part time employees in addition to our temporary employees.
Available Information
Our Internet website address is www.trueblueinc.com. We make available at this address, free of charge, our annual report on Form 10-K, quarterly reports on Form 10-Q, current reports on Form 8-K, and all amendments to those reports as soon as reasonably practicable after such material is electronically filed with or furnished to the SEC. Information available on our website is not incorporated by reference in and is not deemed a part of this Form 10-K.
Investing in our securities involves a high degree of risk. The following risk factors, issues and uncertainties should be considered in evaluating our future prospects. In particular, keep these risk factors in mind when you read "forward-looking" statements elsewhere in this report. Forward-looking statements relate to our expectations for future events and time periods. Generally, the words "anticipate," "believe," "expect," "intend," "plan" and similar expressions identify forward-looking statements. Forward–looking statements involve risks and uncertainties, and future events and circumstances could differ significantly from those anticipated in the forward–looking statements. Any of the following risks could harm our business, operating results or financial condition and could result in a complete loss of your investment. Additional risks and uncertainties that are not yet identified or that we currently think are immaterial may also harm our business and financial condition in the future.
The current recession has negatively affected our customers and our business, and could continue to negatively affect our customers and materially adversely affect our results of operations and liquidity.
The current recession is having a significant negative impact on businesses around the world. The full impact of this recession on our customers, especially our customers engaged in construction, cannot be predicted and may be quite severe. These and other economic factors, such as consumer demand, unemployment, inflation levels and the availability
Page -10
of credit could have a material adverse effect on demand for our services and on our financial condition and operating results. We sell our services to a large number of small and medium sized businesses and these businesses have been and are more likely to be impacted by unfavorable general economic and market conditions than larger and better capitalized companies. If our customers cannot access credit to support increased demand for their product or if demand for their products declines, they will have less need for our services.
We may be negatively affected by the financial crisis in the U.S. and global capital and credit markets.
We must maintain liquidity to fund our working capital and to fund our premium and collateral obligations to our insurance providers. Without sufficient liquidity, we could be forced to limit our operations or we may not be able to pursue new business opportunities. The principal sources of our liquidity are cash generated from operating activities, available cash and cash equivalents, and borrowings under our credit facility. The capital and credit markets have been experiencing extreme volatility and disruption during the past year. These market conditions could affect our ability to borrow under our credit facility, or adversely affect our banking partners. We can make no assurances that our banking partners will not experience a significant adverse event that could impact their abilities to fulfill their obligations to us. Even if the credit markets improve, the availability of financing will depend on a variety of factors, such as economic and market conditions, the availability of credit and our credit ratings, as well as the possibility that lenders could develop a negative perception of us or the markets that we serve. We may not be able to successfully obtain any necessary additional financing on favorable terms, or at all.
Competition for customers in the staffing markets we serve is intense, and if we are not able to effectively compete, our financial results could be harmed and the price of our securities could decline.
The temporary services industry is highly competitive, with limited barriers to entry. Several very large and mid-sized full-service and specialized temporary labor companies, as well as small local operations, compete with us in the staffing industry. Competition in the markets we serve is intense and these competitive forces limit our ability to raise prices to our customers. For example, competitive forces have historically limited our ability to raise our prices to immediately and fully offset increased costs of doing business, including increased labor costs, costs for workers' compensation and state unemployment insurance. As a result of these forces, we have in the past faced pressure on our operating margins. Pressure on our margins remains intense, and we cannot assure you that it will not continue. If we are not able to effectively compete in the staffing markets we serve, our operating margins and other financial results will be harmed and the price of our securities could decline.
A significant portion of our insurance coverage, including workers' compensation, is provided by AIGCI. If AIGCI, or its insurance subsidiaries, were to experience further financial problems, it could harm our business, financial condition or results of operations.
Our workers' compensation insurance policies are with various insurance subsidiaries of AIGCI. AIGCI holds the majority of the restricted cash collateralizing our self-insured workers' compensation policies. We also rely on AIGCI to provide state-mandated statutory workers' compensation coverage, employers' liability coverage, auto coverage, and general liability coverage. While we have not experienced a loss of collateral with any of the prior insurance companies that have entered liquidation, if AIGCI were to experience further financial problems, our restricted cash deposits, letters of credit, and/or our workers' compensation or other coverage at AIGCI could be at risk. The loss of the cash deposits and letters of credit would have a material negative impact on our balance sheet and could require us to seek additional sources of capital to pay our accrued workers' compensation claims. These additional sources of financing may not be available on commercially reasonable terms, or at all. The loss of our workers' compensation coverage would prevent us from doing business in the majority of our markets.
If we are not able to obtain or maintain insurance on commercially reasonable terms, our financial condition or results of operations could suffer.
We maintain various types of insurance coverage to help offset the costs associated with certain risks to which we are exposed. We have previously experienced, and could again experience, changes in the insurance markets that result in significantly increased insurance costs and higher deductibles. For example, we are required to pay workers' compensation benefits for our temporary and permanent employees. Under our workers' compensation insurance program, we maintain "per occurrence" insurance, which covers claims for a particular event above a $2.0 million deductible, and we do not maintain an aggregate stop-loss limit other than on a per-occurrence basis. While we have secured coverage with AIG Commercial Insurance ("AIGCI") for occurrences during the period from July 2008 to July 2009, our insurance policies must be renewed annually, and we cannot guarantee that we will be able to successfully renew such policies for any period after July 2009. In the event we are not able to obtain workers' compensation insurance, or any of our other insurance coverages, on commercially reasonable terms, our ability to operate our business would be significantly impacted and our
Page -11
financial condition and results of operations could suffer. If our financial results deteriorate, our insurance carrier may accelerate our premium payments or require all premium to be paid in one initial payment. Such a change in our insurance payment terms could impact our available cash, and our financial condition or operations could suffer.
The terms under which we post the collateral necessary to support our workers' compensation obligations may change which could reduce the capital we have available to support our operations.
We are required to maintain commitments such as cash and cash-backed instruments, irrevocable letters of credit, and/or surety bonds to secure repayment to our insurance companies (or in some instances, the state) of the deductible portion of all open workers' compensation claims. We pledge cash or other assets in order to secure these commitments and there are a number of factors that cause the size of our collateral commitments to grow over time. As our business grows so does our workers' compensation reserve and the collateral needed to support it. We sometimes face difficulties in recovering our collateral from insurers, particularly when those insurers are in financial distress, and we cannot guarantee that our collateral for past claims will be released in a timely manner as we pay down claims. As a result, we expect that the amount of collateral required to secure our commitments to our insurance carriers could continue to increase. Alternatively, if our financial results deteriorate, our insurance carriers may require additional collateral, or we may see a shortening of the amount of time that the insurance carriers allow us to deposit collateral. Such a change in our collateral payment terms could impact our available cash, and our financial condition or operations could suffer. Deteriorating financial results could also cause our surety carriers to require more cash to collateralize surety bonds that they have issued. Our currently available sources of capital for these commitments are limited, and have been further limited by the current global liquidity shortage, and we could be required to seek additional sources of capital in the future. These additional sources of financing may not be available on commercially reasonable terms, or at all. Even if such sources of financing are available, they could result in a dilution of value to our existing shareholders.
Our reserves for workers' compensation claims, other liabilities, and our allowance for doubtful accounts may be inadequate, and we may incur additional charges if the actual amounts exceed the estimated amounts.
We maintain reserves for workers' compensation claims, including the excess claims portion above our deductible, using actuarial estimates of the future cost of claims and related expenses. These estimates are impacted by items that have been reported but not settled and items that have been incurred but not reported. This reserve, which reflects potential liabilities to be paid in future periods based on estimated payment patterns, is discounted to its estimated net present value using discount rates based on average returns of "risk-free" U.S. Treasury instruments with maturities comparable to the weighted average lives of our workers' compensation claims. We evaluate the reserve regularly throughout the year and make adjustments accordingly. If the actual costs of such claims and related expenses exceed the amounts estimated, or if the discount rates represent an inflated estimate of our return on capital over time, actual losses for these claims may exceed reserves and/or additional reserves may be required. We have also established reserves for contingent legal and regulatory liabilities, based on management's estimates and judgments of the scope and likelihood of these liabilities. While we believe our judgments and estimates are adequate, if the actual outcome of these matters is less favorable than expected, an adjustment would be charged to expense in the period in which the outcome occurs or the period in which our estimate changes. We also establish an allowance for doubtful accounts for estimated losses resulting from the inability of our customers to make required payments. If the financial condition of our customers were to deteriorate, resulting in an impairment of their ability to make payments, we may be required to incur additional charges.
Some insurance companies with which we have previously done business are in financial distress, and one has been relieved of its insurance obligations to us. If our insurers do not fulfill their obligations, we could experience significant losses.
Prior to our current policies with AIG Commercial Insurance ("AIGCI"), we purchased annual insurance policies in connection with our workers' compensation obligations from three primary carriers. Prior to 2001, Legion Insurance Company (Legion) and Reliance Insurance Company (Reliance) provided coverage to us. Legion and Reliance are in liquidation and have failed to pay a number of covered claims that exceed our deductible limits. We have presented these excess claims to the guarantee funds of the states in which the claims originated. Certain of these excess claims have been rejected by the state guarantee funds due to statutory eligibility limitations. As a result, we have concluded it is likely that we will be unable to obtain reimbursement for at least a portion of these excess claims. To the extent we experience additional claims that exceed our deductible limits and our insurers do not satisfy their coverage obligations, we may be forced to satisfy some or all of those claims directly; this in turn could harm our financial condition or results of operations.
Our workers' compensation reserves include not only estimated expenses for claims within our self-insured layer but also estimated expenses related to claims in excess of the deductible limits. We record a receivable for the insurance coverage on excess claims. We have also recorded a valuation allowance against the insurance receivables from Legion and Reliance
Page -12
to reflect our best estimates of amounts we may not realize as a result of the liquidations of those insurers. The outcome of those liquidations is inherently uncertain and we may realize significantly less than currently estimated, in which case an adjustment would be charged to expense in the period in which the outcome occurs or the period in which our estimate changes.
Kemper Insurance Company (Kemper) provided coverage for occurrences commencing in 2001 through June 30, 2003. In December 2004, we executed a novation agreement pursuant to which we relinquished insurance coverage and assumed all further liability for all claims originating in the Kemper policy years. These claims are reserved for in the consolidated financial statements. Although we believe our judgements and estimates are adequate, we cannot assure you that claims originating in the Kemper policy years will not experience unexpected adverse developments.
Our operations expose us to the risk of litigation which could lead to significant potential liability and costs that could harm our business, financial condition or results of operations.
We are in the business of employing people and placing them in the workplaces of other businesses. As a result, we are subject to a large number of federal and state laws and regulations relating to employment. This creates a risk of potential claims that we have violated laws related to discrimination and harassment, health and safety, wage and hour laws, criminal activity, personal injury and other claims. We are also subject to other types of claims in the ordinary course of our business. Some or all of these claims may give rise to litigation, which could be time-consuming for our management team, costly and harmful to our business.
In addition, we are exposed to the risk of class action litigation. The costs of defense and the risk of loss in connection with class action suits are greater than in single-party litigation claims. Due to the costs of defending against such litigation, the size of judgments that may be awarded against us, and the loss of significant management time devoted to such litigation, we cannot assure you that such litigation will not disrupt our business or impact our financial results.
A significant portion of our revenue is derived from operations in a limited number of markets. Unfavorable economic conditions in these markets have harmed and could continue to harm our operations.
A significant portion of our revenue is derived from our operations in a limited number of states. Total revenue generated from operations in California, Texas and Florida, accounted for 33% of our overall revenue in 2008, 36% of our overall revenue in 2007 and 38% of our overall revenue in 2006.
International operations will burden our resources and may fail to generate a substantial increase in revenue.
Our international branch operations expose us to certain risks. These risks include risks already discussed in connection with our domestic branch operations and also include risks related to fluctuations in the value of foreign currencies, the additional expense and risks inherent in operations in geographically and culturally diverse locations, being subject to complex foreign tax laws and regulations. If we are not able to effectively manage those risks, our financial results could be harmed. As of December 26, 2008, we had 39 branches outside the United States.
We are continually subject to the risk of new regulation, which could harm our business.
Each year a number of bills are introduced to Federal, State, and local governments, any one of which, if enacted, could impose conditions which could harm our business. This proposed legislation has included provisions such as a requirement that temporary employees receive equal pay and benefits as permanent employees, requirements regarding employee health care, and a requirement that our customers provide workers' compensation insurance for our temporary employees. We actively oppose proposed legislation adverse to our business and inform policy makers of the social and economic benefits of our business. However, we cannot guarantee that any of this legislation will not be enacted, in which event demand for our service may suffer.
The cost of compliance with government laws and regulations is significant and could harm our operating results.
We incur significant costs to comply with complex federal, state, and local laws and regulations relating to employment, including occupational safety and health provisions, wage and hour requirements (including minimum wages), workers' compensation unemployment insurance, and immigration. In addition, from time to time we are subject to audit by various state and governmental authorities to determine our compliance with a variety of these laws and regulations. We have in the past been found, and may in the future be found, to have violated such laws or regulations. We may, from time to time, incur fines and other losses or negative publicity with respect to any such violation. If we incur additional costs to comply with these laws and regulations or as a result of fines or other losses and we are not able to increase the rates we charge our customers to fully cover any such increase, our margins and operating results may be harmed.
Page -13
Our business depends extensively on recruiting and retaining qualified branch managers. If we are not able to attract a sufficient number of qualified branch managers, our future growth and financial performance may suffer.
We rely heavily on the performance and productivity of our branch managers, who manage the operation of the branches, including recruitment and assignment of temporary employees, marketing and providing quality customer service. We have historically experienced a high degree of turnover among our branch managers. As a result, we must continue to recruit a sufficient number of managers to staff new branches and to replace managers lost through attrition or termination. Our future growth and financial performance depend on our ability to hire, train and retain qualified managers from a limited pool of qualified candidates.
Our credit facility requires that we meet certain levels of financial performance. In the event we fail either to meet these requirements or have them waived, we may be subject to penalties and we could be forced to seek additional financing.
We have a credit agreement with certain unaffiliated financial institutions (the "Revolving Credit Facility") that expires in April 2011. The Revolving Credit Facility requires that we comply with certain financial covenants. Among other things, these covenants require us to maintain certain leverage and coverage ratios. Deterioration of our financial results would make it harder for us to comply with these financial covenants. In the past we have negotiated amendments to these covenants to ensure our continued compliance with their restrictions. We cannot be assured that our lenders would consent to such amendments on commercially reasonable terms in the future if we once again required such relief. In the event that we do not comply with the covenants and the lenders do not waive such non-compliance, then we will be in default of the Revolving Credit Facility, which could subject us to penalty rates of interest and accelerate the maturity of the outstanding balances. Accordingly, in the event of a default under the Revolving Credit Facility, we could be required to seek additional sources of capital to satisfy our liquidity needs. These additional sources of financing may not be available on commercially reasonable terms, or at all.
A significant portion of our liquidity relies on a limited number of banking partners. If these banks fail we could face a shortage of liquidity, which could harm our business operations.
In the current economic recession, we cannot assure you that the lenders under the Revolving Credit Facility will remain able to support their commitments to us in the future. If these lenders fail we may not be able to secure alternative financing on commercially reasonable terms, or at all.
We have significant working capital requirements.
We require significant working capital in order to operate our business. We may experience periods of negative cash flow from operations and investment activities, especially during seasonal peaks in revenue experienced in the second and third quarter of the year. We invest significant cash into the opening and operations of new branches until they begin to generate revenue sufficient to cover their operating costs. We also pay our temporary employees before customers pay us for the services provided. As a result, we must maintain cash reserves to pay our temporary employees prior to receiving payment from our customers. Our collateral requirements may increase in future periods, which would decrease amounts available for working capital purposes. If our available cash balances and borrowing base under our existing credit facility do not grow commensurate with the growth in our working capital requirements, or if our banking partners experience cash shortages or are unwilling to provide us with necessary cash, we could be required to explore alternative sources of financing to satisfy our liquidity needs.
Our management information and computer processing systems are critical to the operations of our business and any failure, interruption in service, or security failure could harm our ability to effectively operate our business.
The efficient operation of our business is dependent on our management information systems. We rely heavily on our management information systems to manage our order entry, order fulfillment, pricing, and point-of-sale processes. The failure of our management information systems to perform as we anticipate could disrupt our business and could result in decreased revenue, increased overhead costs and could require that we commit significant additional capital and management resources to resolve the issue, causing our business and results of operations to suffer materially. Failure to protect the integrity and security of our customers' and employees' information could expose us to litigation and materially damage our standing with our customers.
The loss of any of our key personnel could harm our business.
Our future financial performance will depend to a significant extent on our ability to motivate and retain key management personnel. Competition for qualified management personnel is intense and in the event we experience turnover in our key management positions, we cannot assure you that we will be able to recruit suitable replacements or assimilate new key management personnel into our organization to achieve our operating objectives. Even if we are successful, turnover in key management positions could temporarily harm our financial performance and results of operations until new
Page -14
management becomes familiar with our business. Furthermore, we do not maintain key person life insurance on any of our executive officers.
Our business would suffer if we could not attract enough temporary employees or skilled trade workers.
We compete with other temporary personnel companies to meet our customer needs and we must continually attract reliable temporary employees to fill positions. We have in the past experienced short-term worker shortages and we may continue to experience such shortages in the future. In addition, our CLP, PlaneTechs and TLC brands rely on their ability to attract skilled trade workers. If we are unable to find temporary employees or skilled trade workers to fulfill the needs of our customers over a long period of time, we could lose customers and our business could suffer.
Labor unions have attempted to harm our business.
Various labor unions and activist groups have attempted to disrupt our business. For example, these groups have backed legislation designed to adversely impact our business, coordinated legal actions directed at our activities and engaged in a public relations campaign to discredit members of our management team and influence our customers. We cannot assure you that these activities will not harm our business or the price of our securities.
Failure in our pursuit or execution of new business ventures, strategic alliances and acquisitions could have a material adverse impact on our business.
Our long-term growth strategy includes expansion via new business ventures and acquisitions. While we employ several different valuation methodologies to assess a potential growth opportunity, we can give no assurance that new business ventures and strategic acquisitions will positively affect our financial performance. Acquisitions may result in the diversion of our capital and our management's attention from other business issues and opportunities. Unsuccessful acquisition efforts may result in significant additional expenses that would not otherwise be incurred. We may not be able to assimilate or integrate successfully companies that we acquire, including their personnel, financial systems, distribution, operations and general operating procedures. If we fail to assimilate or integrate acquired companies successfully, our business could suffer materially. In addition, we may not realize the revenues and cost savings that we expect to achieve or that would justify the acquisition investment, and we may incur costs in excess of what we anticipate. We may also encounter challenges in achieving appropriate internal control over financial reporting in connection with the integration of an acquired company. In addition, the integration of any acquired company, and its financial results, into ours may have a material adverse effect on our operating results.
We are highly dependent on the cash flows and net earnings we generate during our second and third fiscal quarters.
A majority of our cash flow from operating activities is generated during the 2nd and 3rd quarters which include the summer months. Unexpected events or developments such as natural disasters, manmade disasters and adverse economic conditions in our second and third quarter could have a material adverse effect on our operating cash flows.
The foregoing should not be construed as an exhaustive list of all factors that could cause actual results to differ materially from those expressed in forward-looking statements made by us or on our behalf.
Item 1B. UNRESOLVED STAFF COMMENTS
None.
We lease the building space at virtually all of our branches. Under the majority of these leases, both parties to the agreement have the right to terminate the lease on 90 days notice and upon payment of an early termination penalty equivalent to three months rent. A small percentage of leases provide for a minimum lease term in excess of one year. We own an office building in Tacoma, Washington, which serves as our headquarters. We also own two branches in Florida. Management believes all of our facilities are currently suitable for their intended use.
From time to time we are subject to compliance audits by federal, state and local authorities relating to a variety of regulations including wage and hour laws, taxes, workers' compensation, immigration and safety. From time to time we are also subject to legal proceedings in the ordinary course of our operations. A summary of our most significant pending litigation and regulatory proceedings is set forth below. It is not possible at this time for us to determine fully the effect of all legal proceedings on our consolidated financial position, results of operations or liquidity; however, to the extent
Page -15
possible, where legal liabilities can be reasonably estimated and are considered probable, we have recorded a liability. To the extent that an insurance company is contractually obligated to reimburse us for a liability, we record a receivable for the amount of the probable reimbursement. We have established reserves for our contingent legal and regulatory liabilities in the amount of $4.3 million at December 26, 2008 and $4.8 million at December 28, 2007. We believe that none of the currently pending legal proceedings, individually or in the aggregate, will have a material adverse impact on our financial position, results of operations or cash flows beyond amounts that have been accrued in the financial statements, although we can make no assurances in this regard.
On January 12, 2005, the New Jersey Division of Taxation (the "Division") filed a Notice of Assessment Related to Final Audit Determination asserting that we owe $7.0 million for delinquent sales taxes, penalties and interest for the period October 1, 2000 through September 30, 2004. The amount of the assessment is based on the Division's assertion that 100% of our revenue from New Jersey operations is subject to sales tax. We disputed the Division's position that we provide taxable services under New Jersey law and filed an administrative protest. The administrative protest was handled internally by the Division and did not involve any outside or independent governmental bodies. On September 19, 2006, the Division issued a final determination on our administrative protest increasing the amount that we allegedly owe for delinquent sales taxes, penalties and interest to $8.1 million. Interest continues to accrue on this amount. We have sought independent review of this determination by filing a complaint with the Tax Court of New Jersey on December 15, 2006. On September 17, 2008, the Court heard our motion for summary judgment, as well as a cross-motion for summary judgment by the Division, and ordered the parties to conduct additional discovery.
On July 16, 2003, Alecia Recio, Elizabeth Esquivel, Debbie Owen and Barry Selbts, each a current or former employee of ours, jointly filed an action in United States District Court for the Central District of California, alleging failure to pay overtime under state and federal law and seeking unspecified damages and certification of a class of similarly situated employees (this matter now includes the claims of Scott Romer and Shawna Clark previously pursued in a separate action). On September 23, 2003, the court dismissed the case for improper venue. On October 1, 2003, Recio re-filed her case in California State Court, Los Angeles County, seeking similar relief on behalf of our employees employed in the State of California. The case went to mediation on September 27, 2007 and on October 12, 2007. Subsequently, the parties entered into a settlement which resolved all claims. The settlement received final approval from the court on September 22, 2008. All amounts related to the settlement are accounted for in our established reserves for our contingent legal and regulatory liabilities.
On August 2, 2002, a New York State Department of Labor audit of a single Labor Ready branch located in New York resulted in an administrative finding that the CDM fees collected at that branch violated New York labor laws. We appealed this administrative finding to the New York Board of Industrial Appeals, which overruled the Department of Labor and issued a unanimous finding that CDM fees did not violate New York wage payment laws. On October 24, 2005, the New York Appellate Division reversed the decision of the Board of Industrial Appeals. We appealed this decision and on November 16, 2006, the Court of Appeals affirmed the decision of the Appellate Division. Thereafter, we promptly shut down the CDMs in the State of New York. Recently, the New York Attorney General ("NYAG") has threatened to file a lawsuit against us seeking restitution for fees collected at all of our New York branches for a six-year period. The total claimed restitution is $1.6 million. In addition to this amount, the NYAG is also seeking interest and penalties.
Item 4. SUBMISSION OF MATTERS TO A VOTE OF SECURITY HOLDERS
No matters were submitted to a vote of security holders during the fourth quarter ended December 26, 2008.
Page -16
Item 5. MARKET FOR REGISTRANT'S COMMON EQUITY, RELATED STOCKHOLDER MATTERS AND ISSUER PURCHASES OF EQUITY SECURITIES
Market Information
Our common stock is listed on the New York Stock Exchange under the ticker symbol TBI. The table below sets forth the high and low sales prices for our common stock as reported by the New York Stock Exchange during the periods indicated:
Quarter Ended
|
High | Low | ||||||
|---|---|---|---|---|---|---|---|---|
March 30, 2007 |
$ | 19.78 | $ | 17.00 | ||||
June 29, 2007 |
$ | 24.56 | $ | 17.62 | ||||
September 28, 2007 |
$ | 28.63 | $ | 18.35 | ||||
December 28, 2007 |
$ | 21.58 | $ | 14.22 | ||||
March 28, 2008 |
$ | 15.00 | $ | 11.01 | ||||
June 27, 2008 |
$ | 14.65 | $ | 12.00 | ||||
September 26, 2008 |
$ | 17.50 | $ | 12.39 | ||||
December 26, 2008 |
$ | 16.23 | $ | 5.57 | ||||
Holders of the Corporation's Capital Stock
We had approximately 907 shareholders of record as of February 10, 2009.
Dividends
No cash dividends have been declared on our common stock to date nor have any decisions been made to pay a dividend in the future. Payment of dividends is evaluated on a periodic basis and if a dividend were paid, it would be subject to the covenants of our lending facility, which may have the effect of restricting our ability to pay dividends.
Issuer Purchases of Equity Securities
Under our authorized share purchase program, we purchased and retired 1.2 million shares of our common stock for a total of $16.0 million during 2008 and 7.6 million shares of our common stock for a total of $150.3 million during 2007.
The table below includes purchases of our common stock pursuant to publicly announced plans or programs and those not made pursuant to publicly announced plans or programs during the thirteen weeks ended December 26, 2008.
| |
|
|
|
|
|||||||||
|---|---|---|---|---|---|---|---|---|---|---|---|---|---|
| Period |
Total number of shares purchased (1) |
Weighted average price paid per share (2) |
Total number of shares purchased as part of publicly announced plans or programs |
Maximum number of shares (or approximate dollar value) that may yet be purchased under plans or programs at period end (3) |
|||||||||
9/27/08 through 10/24/08 |
1,972 | $ | 11.97 | – | $ | 21.5 million | |||||||
10/25/08 through 11/21/08 |
1,248 | $ | 8.21 | – | $ | 21.5 million | |||||||
11/22/08 through 12/26/08 |
8,621 | $ | 7.70 | – | $ | 21.5 million | |||||||
Total |
11,841 | $ | 8.15 | 0 | $ | 21.5 million | |||||||
Page -17
TrueBlue Stock Comparative Performance Graph
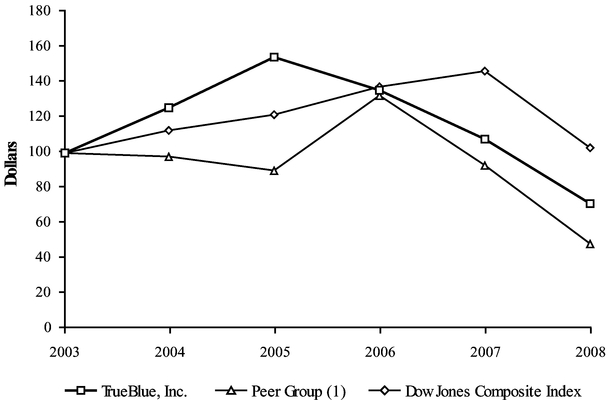
The following graph depicts our stock price performance from December 31, 2003, through December 26, 2008, relative to the performance of the Dow Jones Composite and a peer group of companies in the temporary labor industry. All indices shown in the graph have been reset to a base of 100 as of December 31, 2003, and assume an investment of $100 on that date and the reinvestment of dividends, if any, paid since that date.
COMPARISON OF 5-YEAR CUMULATIVE TOTAL RETURN
Among TrueBlue, Inc., the Dow Jones Composite Index
and Selected peer group*
TOTAL RETURN TO SHAREHOLDERS
(assumes $100 Investment on 12/31/03)
Total Return Analysis
|
2003 | 2004 | 2005 | 2006 | 2007 | 2008 | ||||||||||||||
|---|---|---|---|---|---|---|---|---|---|---|---|---|---|---|---|---|---|---|---|---|
TrueBlue, Inc. |
$ | 100 | $ | 126 | $ | 155 | $ | 136 | $ | 108 | $ | 71 | ||||||||
Peer Group (1) |
$ | 100 | $ | 98 | $ | 90 | $ | 133 | $ | 93 | $ | 48 | ||||||||
Dow Jones Composite Index |
$ | 100 | $ | 113 | $ | 122 | $ | 138 | $ | 147 | $ | 103 | ||||||||
Page -18
Item 6. SELECTED FINANCIAL DATA
The following selected consolidated financial information has been derived from our audited Consolidated Financial Statements. The data should be read in conjunction with our Consolidated Financial Statements and the notes thereto, and Management's Discussion and Analysis of Financial Condition and Results of Operations included elsewhere herein.
Summary Consolidated Financial And Operating Data
(in thousands, except per share data and number of branches)
| |
|||||||||||||||||
|---|---|---|---|---|---|---|---|---|---|---|---|---|---|---|---|---|---|
| |
2008 (2) | 2007 (2) | 2006 | 2005 (2) | 2004 (2) | ||||||||||||
Statement of Income Data: |
|||||||||||||||||
Revenue from services |
$ | 1,384,269 | $ | 1,385,656 | $ | 1,349,118 | $ | 1,236,070 | $ | 1,044,236 | |||||||
Cost of services |
971,757 | 943,563 | 915,773 | 844,448 | 727,059 | ||||||||||||
Gross profit |
412,512 | 442,093 | 433,345 | 391,622 | 317,177 | ||||||||||||
Selling, general and administrative expenses |
332,113 | 336,220 | 318,681 | 286,460 | 244,606 | ||||||||||||
Goodwill and intangible asset impairment |
61,000 | – | – | – | – | ||||||||||||
Depreciation and amortization |
16,774 | 12,223 | 10,364 | 9,603 | 10,127 | ||||||||||||
Interest and other income (expense), net |
5,530 | 10,953 | 11,873 | 4,636 | (2,599 | ) | |||||||||||
Income before tax expenses |
8,155 | 104,603 | 116,173 | 100,195 | 59,845 | ||||||||||||
Income tax expense |
12,314 | 38,405 | 39,701 | 38,174 | 23,532 | ||||||||||||
Net income (loss) |
$ | (4,159 | ) | $ | 66,198 | $ | 76,472 | $ | 62,021 | $ | 36,313 | ||||||
Net income (loss) per diluted share: |
|||||||||||||||||
Diluted |
$ | (0.10 | ) | $ | 1.44 | $ | 1.45 | $ | 1.18 | $ | 0.75 | ||||||
Weighted average diluted shares outstanding (1): |
|||||||||||||||||
Diluted |
43,073 | 45,960 | 52,853 | 53,793 | 52,289 | ||||||||||||
Operating Data (unaudited): |
|||||||||||||||||
Revenue from branches open 12 or more months |
$ | 1,240,843 | $ | 1,314,919 | $ | 1,325,902 | $ | 1,136,617 | $ | 980,672 | |||||||
Revenue from branches open less than 12 months or acquired during the year |
94,753 | 48,201 | 22,236 | 96,530 | 59,717 | ||||||||||||
Revenue from branches closed during the year |
48,673 | 22,536 | 980 | 2,923 | 3,847 | ||||||||||||
Total |
$ | 1,384,269 | $ | 1,385,656 | $ | 1,349,118 | $ | 1,236,070 | $ | 1,044,236 | |||||||
Branches open at period end |
850 |
894 |
912 |
887 |
815 |
||||||||||||
| |
At Year End, | |||||||||||||||
|---|---|---|---|---|---|---|---|---|---|---|---|---|---|---|---|---|
| |
2008 (2) | 2007 (2) | 2006 | 2005 (2) | 2004 (2) | |||||||||||
Balance Sheet Data: |
||||||||||||||||
Working capital |
$ | 147,496 | $ | 114,970 | $ | 238,373 | $ | 218,649 | $ | 184,550 | ||||||
Total assets |
519,675 | 545,249 | 592,306 | 572,076 | 444,107 | |||||||||||
Long-term liabilities |
154,238 | 146,884 | 138,403 | 123,464 | 165,205 | |||||||||||
Total liabilities |
$ | 249,546 | $ | 261,422 | $ | 239,788 | $ | 223,478 | $ | 241,713 | ||||||
Page -19
Item 7. MANAGEMENT'S DISCUSSION AND ANALYSIS OF FINANCIAL CONDITION AND RESULTS OF OPERATIONS
The following discussion should be read in conjunction with, and is qualified in its entirety by, the Consolidated Financial Statements and Notes thereto included elsewhere in this Annual Report on Form 10-K. This item contains forward-looking statements that involve risks and uncertainties. Actual results may differ materially from those indicated in such forward-looking statements. Factors that may cause such a difference include, but are not limited to, those discussed in "Item 1A, Risk Factors."
Management's Discussion and Analysis of Financial Condition and Results of Operations ("MD&A") is designed to provide the reader of our financial statements with a narrative from the perspective of management on our financial condition, results of operations, liquidity and certain other factors that may affect future results. Our MD&A is presented in six sections:
EXECUTIVE SUMMARY
TrueBlue, Inc. ("TrueBlue," "we," "us," "our") is an international provider of temporary blue-collar staffing. In 2008, we put approximately 500,000 people to work through the following brands: Labor Ready for general labor, Spartan Staffing for light industrial services, and CLP Resources, PlaneTechs, and TLC for skilled trades. Headquartered in Tacoma, Washington, we serve approximately 250,000 small to mid-sized businesses in the construction, warehousing, hospitality, landscaping, transportation, light manufacturing, retail, wholesale, facilities, sanitation, and aviation industries.
Revenue for 2008 was $1.4 billion, a decrease of 0.1% over the prior year. The decline for the year consisted of 15.6% growth from acquisitions completed within the last 12 months offset by a 15.7% decrease in organic revenue. Growth from acquisitions included several acquisitions. In 2007 we purchased Skilled Services Corporation, a skilled construction trades staffing provider and PlaneTechs, LLC, a skilled staffing provider for aviation maintenance and aero space manufacturing. In 2008 we purchased TLC Services Group, Inc., a professional truck driver staffing provider and Personnel Management, Inc., a light industrial staffing company. The decline in demand for our services accelerated in the fourth quarter. Revenue for the quarter ended December 26, 2008 was $302 million, a decrease of 14.7% compared to the fourth quarter of 2007. The 14.7% revenue decline for the quarter consisted of 12.8% growth from acquisitions completed within the last 12 months offset by a 27.5% decrease in organic revenue.
The U.S. economy is in a recession and as a result we have experienced a significant decrease in demand for blue collar staffing which has negatively impacted our performance. We believe the markets we serve will continue to remain under pressure until the overall economy stabilizes and begins to grow again. In response to the recession we have increased the number of branch closings. Primary factors influencing which branches to close included financial performance, ability to consolidate with another branch, tenure and quality of branch management, market potential of branch location, and long-term potential of the location. During 2008, we closed 73 branches and sold the remaining 29 branches in the United Kingdom. We will continue our focus on aggressive cost management and maintaining a strong balance sheet.
Gross profit as a percentage of revenue decreased during 2008. Gross profit as a percentage of revenue was 29.8% in 2008 compared to 31.9% of revenue during 2007. The impact of acquisitions, pricing pressures resulting from the current economic slowdown, and increased wages paid to our temporary workers due to statutory minimum wage increases are the primary causes for the decline in gross profit as a percentage of revenue. The gross profit as a percentage of revenue of acquired companies has been less than that of our core business creating a decrease in the overall blended gross profit as a percentage of revenue. While we have increased the bill rates to our customers for these pay increases, we have not fully passed through the amount of our standard markup due to an increased level of price sensitivity with our customers associated with slower economic conditions. Pricing pressure on gross profit as a percentage of revenue was partially offset by the improvement in workers' compensation expense which is primarily due to continued improvements in accident prevention and risk management.
Page -20
Selling, General and Administrative ("SG&A") expenses decreased to 24.0% of revenue for 2008 compared to 24.3% of revenue during 2007. The decrease in SG&A expense as a percentage of revenue was largely attributed to the impact of acquisitions and cost control measures offset by a decline in organic revenue. SG&A expense as a percentage of revenue for acquired companies was lower than that of our core business creating a decrease in the overall blended gross margin. A variety of cost control measures were also implemented in 2008 to decrease SG&A expense. However, the impact of a lower organic revenue base to spread our fixed costs across largely offset the impact from acquisitions and cost control measures. Cost management will remain a focus during this recession.
Net loss for 2008 was $4.2 million, or $0.10 per diluted share, compared to net income of $66.2 million or $1.44 per diluted share for 2007. Results for 2008 include a goodwill and intangible asset impairment charge of $61 million ($49.3 million after tax) or $1.15 per diluted share related to the company's acquisitions over the past five years. Excluding this impairment charge, net income would have been $45.2 million or $1.05 per diluted share. The charge is largely a result of the adverse impact on expected future cash flows related to the current state of the economy. The charge does not impact the company's current cash, liquidity, or banking covenants.
We expect to continue to face a very difficult economic environment throughout fiscal 2009, both in the U.S. and internationally. As the global financial crisis has broadened and intensified, other sectors of the global economy have been adversely impacted and a severe global recession of uncertain length now appears likely. During an economic downturn, businesses generally reduce their use of temporary staffing as they experience a lower level of demand from consumers. As a result, we expect to face a challenging fiscal 2009 because of these economic conditions. Accordingly, we expect to report negative comparable branch sales for fiscal 2009. We plan to be disciplined in our approach to new branch openings and closures and adjust as needed in response to further worsening in the economy.
RESULTS OF OPERATIONS
The following table presents selected consolidated financial data for each of the past three years (in thousands, except per share amounts):
| |
2008 | 2007 | 2006 | |||||||
|---|---|---|---|---|---|---|---|---|---|---|
Revenue from services |
$ | 1,384,269 | $ | 1,385,656 | $ | 1,349,118 | ||||
Total revenue growth (decline) % |
(0.1%) | 2.7% | 9.1% | |||||||
Gross profit as a % of revenue |
29.8% | 31.9% | 32.1% | |||||||
SG&A as a % of revenue |
24.0% | 24.3% | 23.6% | |||||||
Income from operations |
$ | 2,625 | $ | 93,650 | $ | 104,300 | ||||
Income from operations as % of revenue |
0.2% | 6.8% | 7.7% | |||||||
Goodwill and intangible asset impairment |
$ |
61,000 |
– |
– |
||||||
Depreciation and amortization |
$ | 16,774 | $ | 12,223 | $ | 10,364 | ||||
Interest and other income, net |
$ | 5,530 | $ | 10,953 | $ | 11,873 | ||||
Effective income tax rate |
151.0% | 36.7% | 34.2% | |||||||
Net income (loss) |
$ | (4,159) | $ | 66,198 | $ | 76,472 | ||||
Net income (loss) as a % of revenue |
(0.3%) | 4.8% | 5.7% | |||||||
Net income (loss) per diluted share |
$ | (0.10) | $ | 1.44 | $ | 1.45 | ||||
Revenue from services. Revenue for 2008 was $1.4 billion, a decrease of 0.1% over the prior year. The revenue decline for the year consisted of 15.6% growth from acquisitions completed within the last 12 months offset by a 15.7% decrease in organic revenue. Growth from acquisitions included several acquisitions. In 2007 we purchased Skilled Services Corporation, a skilled construction trades staffing provider and PlaneTechs, LLC, a skilled staffing provider for aviation maintenance and aero space manufacturing. In 2008 we purchased TLC Services Group, Inc, a professional truck driver staffing provider and Personnel Management, Inc., a light industrial staffing company. The slowdown in demand for our services accelerated during the fourth quarter. Revenue for the quarter ended December 26, 2008 of $302 million decreased 14.7% compared to the fourth quarter of 2007. The 14.7% revenue decline for the quarter consisted of 12.8% growth from acquisitions completed within the last 12 months offset by a 27.5% decrease in organic revenue. We will continue our focus on aggressive cost management and maintaining a strong balance sheet. In response to the recession we have increased the number of branch closings. Primary factors influencing which branches to close included financial performance, ability to consolidate with another branch, tenure and quality of branch management, market potential of branch location, and long-term potential of the location. During 2008, we closed 73 branches. In December 2008, we sold the remaining 29 branches in the United Kingdom for a total reduction of 102 branches for 2008.
Page -21
The change in revenue for 2008 compared to 2007 and 2006, respectively, is made up of the following five components:
| |
2008 | 2007 | 2006 | ||||||||
|---|---|---|---|---|---|---|---|---|---|---|---|
Same branch (1) |
(13.4 | %) | (0.2 | %) | 4.0 | % | |||||
New branches (2) |
0.8 | % | 1.3 | % | 1.5 | % | |||||
Closed branches |
(3.0 | %) | (1.7 | %) | (0.8 | %) | |||||
Currency and other |
(0.1 | %) | 0.6 | % | 0.1 | % | |||||
Total organic revenue growth (decline) |
(15.7 | %) | 0.0 | % | 4.8 | % | |||||
Acquisitions within last 12 months |
15.6 | % | 2.7 | % | 4.3 | % | |||||
Total sales growth (decline) |
(0.1 | %) | 2.7 | % | 9.1 | % | |||||
Revenue from our international operations for 2008 was approximately 5.5% of our total revenue compared to 7.0% and 6.3%, respectively, for 2007 and 2006.
Gross profit. Gross profit as a percentage of revenue was 29.8% for 2008 compared to 31.9% for 2007. Workers' compensation costs as a percentage of revenue for 2008 were approximately 4.1% compared to 4.7% for 2007. The improvement in workers' compensation expense is due primarily due to the continued success of our accident prevention and risk management programs that have been implemented over several years. The decrease in workers' compensation costs was partially offset by an increase in wages paid to temporary workers. There were 48 state minimum wage increases during 2008 as well as minimum wage increases in our international operations. While we have increased the bill rates to our customers for these pay increases, we have not yet fully passed through our standard markup due to an increased level of price sensitivity with our customers associated with slower economic conditions. As a result, our average pay rate increased 3.2% while our average bill rate increased 2.3%.
Gross profit as a percentage of revenue was 31.9% for 2007 compared to 32.1% in 2006. Workers' compensation costs as a percentage of revenue for 2007 were approximately 4.7% compared to 5.6% for 2006. The improvement in workers' compensation expense is primarily due to the success of our accident prevention and risk management programs that have been implemented over several years. The decrease in workers' compensation costs was partially offset by an increase in wages paid to temporary workers. There were 45 state minimum wage increases during 2007 as well as minimum wage increases in our international operations. While we increased the bill rates to our customers for these pay increases, we did not fully pass through our standard markup due to an increased level of price sensitivity with our customers associated with slowing economic conditions. As a result, our average pay rate increased 4.0% while our average bill rate increased 2.3%.
Selling, general, and administrative expenses. SG&A expenses as a percentage of revenue were 24.0% for 2008 and 24.3% and 23.6% for 2007 and 2006, respectively. The decrease in SG&A expense as a percentage of revenue was largely attributed to the impact of acquisitions and cost control measures offset by a decline in organic revenue. SG&A expense as a percentage of revenue for acquired companies was lower than that of our core business creating a decrease in the overall blended SG&A. A variety of cost control measures were also implemented in 2008 to decrease SG&A expense. However, the impact of a lower organic revenue base to spread our fixed costs across largely offset the impact from acquisitions and cost control measures.
The increase in SG&A expenses during 2007 compared to 2006 was primarily due to the decrease in same store branch revenue coupled with general increases in our cost structure. Cost control measures commenced in the prior year were partially offset by lease termination and other costs related to closing 58 branches, transition and integration costs related to acquisitions, and sales development expenses.
Goodwill and Intangible Asset Impairment. Net loss for 2008 includes a goodwill and intangible asset impairment charge of $61 million. We test goodwill and indefinite-lived intangible assets for impairment annually and whenever events or circumstances arise that indicate an impairment may exist such as a significant adverse change in the business climate. Our annual impairment test is performed during the fourth fiscal quarter. Our annual impairment test did not indicate an impairment of our goodwill and indefinite-lived intangible assets. However, in the fourth quarter of 2008, we experienced a significant decline in our stock price. As a result of the decline in stock price, our market capitalization fell significantly below the recorded value of our consolidated net assets. The reduced market capitalization reflected, in part, the current economic climate as well as expected continued weakness in pricing and demand for our temporary staffing services. Further,
Page -22
the decline in demand for our services accelerated in the fourth quarter. Revenue for the quarter decreased by 14.7% compared to the same quarter a year ago. The 14.7% revenue decline consisted of growth from acquisitions completed within the last 12 months of 12.8%, offset by a decline in organic revenue of 27.5%. On a monthly same branch basis, the year over year decline dropped from 19.8% in October to 29.0% in December. This decline was not isolated to a particular brand or market. The decline in revenue and the corresponding decline in operating results as well as expected continued weakness in pricing and demand for our temporary staffing services is expected to continue during the current recession. Accordingly, we performed an interim assessment of goodwill for impairment. Statement of Financial Accounting Standards No. 142, Goodwill and Other Intangible Assets ("SFAS 142"), requires that goodwill be tested for impairment at a reporting unit level. We have determined that our reporting units are our brands based on our organizational structure and the financial information that is provided to and reviewed by management. As a result of this analysis, we concluded that the carrying amounts of goodwill for the CLP Resources (which includes SSC), Spartan Staffing (which includes PMI) and TLC reporting units exceeded their implied fair values and we recorded non-cash impairment losses of $46 million, which is included in impairment of goodwill and intangible assets on TrueBlue's Consolidated Statement of Operations. Our assessment of goodwill impairment indicated that as of December 26, 2008, the fair value of each of the Labor Ready and PlaneTechs reporting units exceeded its carrying value and therefore goodwill was not impaired.
SFAS No. 144, Accounting for the Impairment or Disposal of Long-Lived Assets, requires that long-lived assets, including amortizable intangible assets, be reviewed for impairment whenever events and circumstances indicate the carrying value may not be recoverable. As a result of the indicators discussed above, we tested our amortizable intangible assets for impairment and determined that certain intangible assets associated with the CLP Resources (which includes SSC), Spartan Staffing (which includes PMI) and TLC asset groups, primarily customer relationships, were impaired mainly due to the revised lower revenue and profit forecasts associated with those customer relationships acquired with the acquisitions of CLP, Spartan Staffing and TLC. We measured the amount of impairment by calculating the amount by which the carrying value of these assets exceeded their estimated fair values, which were based on projected undiscounted future net cash flows. As a result of this review, we recorded non-cash impairment losses totaling $15 million prior to our SFAS 142 impairment test. The non-cash impairment loss is included in impairment of goodwill and intangible assets on TrueBlue's Consolidated Statement of Operations.
Depreciation and amortization expense. Depreciation and amortization expense is $16.8 million for 2008 and $12.2 million and $10.4 million for 2007 and 2006, respectively. The portion of the $16.8 million in depreciation and amortization related to the amortization of intangibles as a result of our acquisitions over the past 5 years is $7.0 million for 2008. The portion of the 2007 and 2006 depreciation of acquired intangibles is $3.1 million and $2.5 million, respectively. The increase during 2008 was primarily due to depreciation of our investments in technology and increased amortization of intangibles as a result of the TLC and PMI acquisitions as well as a full year of amortization of intangibles related to the acquisition of PlaneTechs in 2007. The increase during 2007 as compared to 2006 was primarily attributable to the increased amortization of intangibles as a result of the SSC acquisition and depreciation of our investments in technology.
Interest and other income, net. We recorded net interest and other income of $5.5 million for 2008 compared to $11.0 million for 2007 and $11.9 million for 2006. Net interest income was lower primarily due to lower yields on invested cash. The decrease during 2007 compared to 2006 was attributable to the use of cash to purchase our common stock and for the acquisition of SSC and PlaneTechs which resulted in a decrease in the amount of cash available for investment.
Income tax. Our effective income tax rate was 151% in 2008. Results for 2008 include a goodwill and intangible asset impairment charge of $61 million. Excluding this impairment charge, net income would have been $45.2 million or an effective tax rate of 34.7% as compared to 36.7% in 2007 and 34.2% in 2006. The principal difference between the statutory federal income tax rate of 35.0% and our effective income tax rate results from state income taxes, federal tax credits, tax exempt interest income, and certain non-deductible expenses. Our 2008 effective tax rate of 34.7% excluding the effect of the impairment charge was lower than our 2007 rate primarily due to the favorable resolution of certain state income tax matters during the second quarter of 2008. Our 2006 effective tax rate was lower than our 2007 rate due to the retroactive renewal of certain tax credits and favorable resolution of other income tax matters during the fourth quarter of 2006.
LIQUIDITY AND CAPITAL RESOURCES
Our principal source of liquidity is operating cash flows. Our net income and, consequently, our cash provided from operations are impacted by sales volume, seasonal sales patterns and profit margins. Over the past three years, cash from operations provided approximately $299.2 million.
Page -23
Cash flows from operating activities
Our cash flows provided by operating activities were as follows (in thousands):
| |
2008 | 2007 | 2006 | ||||||||
|---|---|---|---|---|---|---|---|---|---|---|---|
Net income (loss) |
$ | (4,159 | ) | $ | 66,198 | $ | 76,472 | ||||
Goodwill and intangible asset impairment |
61,000 | – | – | ||||||||
Depreciation and amortization |
16,774 | 12,223 | 10,364 | ||||||||
Provision for doubtful accounts |
9,374 | 9,987 | 7,215 | ||||||||
Stock-based compensation |
7,706 | 6,943 | 6,377 | ||||||||
Excess tax benefits from stock-based compensation |
– | (1,451 | ) | (3,527 | ) | ||||||
Deferred income taxes |
2,960 | (8,696 | ) | (3,169 | ) | ||||||
Other operating activities |
(311 | ) | 401 | 56 | |||||||
Changes in operating assets and liabilities, exclusive of businesses acquired: |
|||||||||||
Accounts receivable |
36,602 | (10,897 | ) | (5,429 | ) | ||||||
Income taxes |
(25,170 | ) | 12,359 | 4,797 | |||||||
Workers' compensation |
1,680 | 5,748 | 21,576 | ||||||||
Accounts payable and accrued expenses |
(14,014 | ) | (2,271 | ) | (3,866 | ) | |||||
Other |
(4 | ) | 8,110 | (2,715 | ) | ||||||
Net cash provided by operating activities |
$ | 92,438 | $ | 98,654 | $ | 108,151 | |||||
Page -24
Cash flows from investing activities
Our cash flows used in investing activities were as follows (in thousands):
| |
2008 | 2007 | 2006 | ||||||||
|---|---|---|---|---|---|---|---|---|---|---|---|
Capital expenditures |
$ | (26,137 | ) | $ | (21,040 | ) | $ | (13,007 | ) | ||
Purchases of marketable securities |
(27,158 | ) | (191,032 | ) | (88,266 | ) | |||||
Maturities of marketable securities |
38,087 | 271,580 | 90,301 | ||||||||
Acquisitions of businesses, net of cash acquired |
(22,390 | ) | (76,902 | ) | – | ||||||
Change in restricted cash |
12,174 | 11,234 | 8,948 | ||||||||
Other |
(11 | ) | (167 | ) | 214 | ||||||
Net cash used in investing activities |
$ | (25,435 | ) | $ | (6,327 | ) | $ | (1,810 | ) | ||
Cash flows from financing activities
Our cash flows used in financing activities were as follows (in thousands):
| |
2008 | 2007 | 2006 | ||||||||
|---|---|---|---|---|---|---|---|---|---|---|---|
Purchases and retirement of common stock |
$ | (15,997 | ) | $ | (150,310 | ) | $ | (88,744 | ) | ||
Net proceeds from sale of stock through options and employee benefit plans |
3,488 | 5,712 | 6,457 | ||||||||
Shares withheld for taxes upon vesting of restricted stock |
(1,018 | ) | (997 | ) | (1,164 | ) | |||||
Excess tax benefits from stock-based compensation |
– | 1,451 | 3,527 | ||||||||
Payments on debt |
(250 | ) | (909 | ) | (1,212 | ) | |||||
Other |
(229 | ) | – | – | |||||||
Net cash used in financing activities |
$ | (14,006 | ) | $ | (145,053 | ) | $ | (81,136 | ) | ||
Future outlook
We expect to continue to face a very difficult economic environment throughout fiscal 2009. We are in a severe global recession of an uncertain length. We believe we are in a strong position to cope with the pressure on operating cash flows as highlighted below.
Page -25
Capital resources
On April 15, 2008, we entered into an Amended and Restated Credit Agreement (the "Amended and Restated Credit Agreement") with Wells Fargo Bank and Bank of America, which amended and restated the previous revolving credit facility. The Amended and Restated Credit Agreement extended the term of the revolving credit facility from November 2008 to April 2011. The Amended and Restated Credit Agreement provides capacity for the lesser of $80 million, or 2.50 times EBITDA as defined by the Amended and Restated Credit Agreement ("Bank EBITDA"). The Bank EBITDA has, among other things, additional items added back to net income including the non-cash expenses related to stock options and restricted stock. In addition, we may request (in no more than three instances) that the Amended and Restated Credit Agreement be increased from $80 million up to $160 million in the aggregate, subject to bank approval. In light of current credit market conditions, this additional availability could be difficult to obtain, or might not be available under commercially reasonable terms, or at all. Except as set forth above, the Amended and Restated Credit Agreement did not materially change the terms of the previous revolving credit facility. The Amended and Restated Credit Agreement, which is secured by substantially all our assets except our real estate, provides us with access to loan advances and letters of credit. At December 26, 2008, we had $52.9 million of letters of credit issued against the borrowing capacity leaving us with $27.1 million available for future borrowings. There can be no assurance, however, that the cost or availability of future borrowings will not be impacted by the ongoing credit market instability or that the amount of current available future borrowings will not decrease. If we needed additional cash, and we were unable to borrow against our credit facility, we would look to asset sales, borrowing against unsecured assets to gain, or looking to the public capital markets to access additional cash. Under current market conditions, however, this may not be possible.
Under the terms of the Amended and Restated Credit Agreement, we pay a variable rate of interest based on a margin above LIBOR for borrowings and a variable unused commitment fee, both based on a ratio of consolidated total debt to consolidated Bank EBITDA (the "Consolidated Leverage Ratio"). The bank definition of consolidated total debt includes outstanding letters of credit under the Amended and Restated Credit Agreement. Fees for letters of credit are based on the margin in effect plus a fee of 0.05%. As of December 26, 2008, our margin was 0.50% and our unused capacity fee was 0.125%. If our financial condition deteriorates, our Consolidated Leverage Ratio will rise. At a Consolidated Leverage Ratio of 1.75 times, up to our maximum allowable Consolidated Leverage Ratio of 2.50 times, our margin would be 1.00% and our unused capacity fee would be 0.20%.
The Amended and Restated Credit Agreement requires that we comply with certain financial covenants. Among other things, these covenants require us to stay below a maximum Consolidated Leverage Ratio, and to stay above a minimum Fixed Charge Coverage Ratio ("Fixed Charge Coverage Ratio"). The Fixed Charge Coverage Ratio is calculated by dividing an adjusted EBITDA by fixed charges. Adjusted EBITDA is calculated by removing items such as income tax expense, stock repurchases, capital expenditures, and other items from the bank definition of EBITDA. Fixed charges include items such as interest expense, letter of credit fees, principal payments, and other items. We are currently in compliance with all covenants set forth in the Amended and Restated Credit Agreement. However, should our financial condition deteriorate, our Consolidated Leverage Ratio would rise, and our Fixed Charge Coverage ratio would fall. At a Consolidated Leverage Ratio above 2.50 times, we would be in default under the Amended and Restated Credit Agreement. Similarly, at a Fixed Charge Coverage ratio below 1.50 times, we would also be in default. This would require us to put up cash to back the letters of credit in order to get the Consolidated Leverage Ratio below 2.50 times, or renegotiate the Consolidated Leverage Ratio. In the event of a default, we may not have access to the required cash, or the banks may be unwilling to renegotiate the covenant.
We have agreements with certain financial institutions through our wholly-owned and consolidated subsidiary, Workers' Assurance of Hawaii, Inc. (our "Workers' Assurance Program"), that allow us to restrict cash for the purpose of providing cash-backed instruments for our workers' compensation collateral. These instruments include cash-backed letters of credit, cash held in trusts, as well as cash deposits held by our insurance carriers. At December 26, 2008, we had restricted cash in our Workers' Assurance Program totaling $114.9 million. Of this cash, $114.6 million was committed to insurance carriers leaving $0.3 million available for future needs. The majority of our collateral is held by AIG Commercial Insurance ("AIGCI"), a subsidiary of American International Group, Inc. ("AIG").
Included in cash and cash equivalents at December 26, 2008 and December 28, 2007 is cash held within branch cash dispensing machines ("CDMs") for payment of temporary payrolls in the amount of $17.2 million and $19.0 million, respectively.
We believe that cash provided from operations and our capital resources will be adequate to meet our cash requirements over the next twelve months. However, should economic conditions further deteriorate, our financial results would be
Page -26
adversely impacted and we may need to seek additional sources of capital. These additional sources of financing may not be available, or may not be available on commercially reasonable terms, or at all.
Workers' compensation collateral and claims reserves
We provide workers' compensation insurance for our temporary and permanent employees. While we have primary responsibility for all claims, our insurance coverage provides reimbursement for certain losses and expenses beyond our deductible limits. Our workers' compensation insurance policies are renewed annually. We had coverage with various insurance subsidiaries of AIGCI for occurrences during the period from July 2007 to July 2008 and renewed our coverage with AIGCI effective July 2008 to July 2009. For workers' compensation claims originating in states where we are self-insured, the majority of our current workers' compensation insurance policies cover claims for a particular event above a $2.0 million deductible limit, on a "per occurrence" basis. This results in our being substantially self-insured. Furthermore, we have full liability for all further payments on claims which originated between January 2001 and June 2003, without recourse to any third party insurer as the result of a novation agreement we entered into with Kemper Insurance Company in December 2004.
Our workers' compensation reserve is established using estimates of the future cost of claims and related expenses that have been reported but not settled, as well as those that have been incurred but not reported. Generally, our workers' compensation reserve for estimated claims increases as temporary labor services are provided and decreases as payments are made on these claims. Although the estimated claims are expensed as incurred, the claim payments are made over a weighted average period of approximately six years. We maintain reserves for workers' compensation claims, including the excess claims portion above our deductible limits, using actuarial estimates of the future cost of claims and related expenses. Our workers' compensation claims reserves are discounted to their estimated net present value using discount rates based on average returns of "risk-free" U.S. Treasury instruments with maturities comparable to the weighted average lives of our workers' compensation claims. At December 26, 2008, our reserves are discounted at rates ranging from 3.29% to 4.74%.
Our workers' compensation reserves include not only estimated expenses for claims within our self-insured limit but also estimated expenses related to claims above our deductible limits. We record an estimated receivable for the insurance coverage on excess claims based on the contractual policy agreements we have with insurance companies. We discount this receivable to its estimated net present value using the risk-free rates associated with the weighted average lives of our excess claims. The weighted average claim lives are actuarially determined. When appropriate, based on our best estimate, we record a valuation allowance against the insurance receivable to reflect amounts that may not be realized.
Throughout the year, management evaluates the adequacy of the workers' compensation reserves in conjunction with an independent quarterly actuarial assessment. Factors we consider in establishing and adjusting these reserves include the estimates provided by our independent actuaries, appropriate discount rates, and estimated payment patterns. Factors that have caused our estimated losses for prior years to change include, among other things, (1) inflation of medical and indemnity costs at a rate higher than originally anticipated, (2) regulatory and legislative developments that have increased benefits and settlement requirements in several states, (3) a different mix of business than previously anticipated, (4) the impact of safety initiatives implemented, and (5) positive or adverse development of claim reserves. Adjustments to prior period reserves are charged or credited to expense in the period in which the estimate changes. Due to the timing difference between recognition of expense and claim payments we generally anticipate that our reserves will continue to grow.
Changes in reserve estimates are reflected in the income statement in the period when the changes in estimates are made. Changes related to prior years reserves (net of discount) were $21.0 million for the fifty-two weeks ended December 26, 2008 and $19.5 million for the fifty-two weeks ended December 28, 2007.
We are required by our insurance carriers and certain state workers' compensation programs to collateralize a portion of our workers' compensation obligation with cash and cash-backed instruments, irrevocable letters of credit, or surety bonds. AIGCI holds the majority of the restricted cash collateralizing our self-insured workers' compensation policies. In connection with the renewal of our policy, insurance carriers annually assess the amount of collateral they will require from us relative to our workers' compensation obligation for which they become responsible should we become insolvent. Such amounts can increase or decrease independent of our assessments and reserves. We generally anticipate that our collateral obligations will continue to grow. Should our financial results deteriorate, our insurance carriers may require additional collateral, or we may see a shortening of the amount of time that the insurance carriers allow us to pay our premiums and deposit collateral. For our most recent insurance renewal, we were allowed to pay our premiums and
Page -27
deposit our collateral in twelve monthly installments. If our financial condition deteriorates, the insurance carriers may require us to pay these amounts over a shorter period, or all up-front.
At December 26, 2008 and December 28, 2007 we had provided our insurance carriers and certain states with commitments in the form and amounts outlined below (in millions):
| |
December 26, 2008 |
December 28, 2007 |
||||||
|---|---|---|---|---|---|---|---|---|
Workers' Assurance Program – committed collateral (1) |
$ | 114.6 | $ | 126.4 | ||||
Letters of credit |
52.9 | 34.5 | ||||||
Surety bonds (2) |
17.1 | 17.2 | ||||||
Other cash-backed instruments |
1.1 | 1.2 | ||||||
Total Collateral Commitments |
$ | 185.7 | $ | 179.3 | ||||
We have agreements with certain financial institutions through our wholly-owned and consolidated subsidiary, Workers' Assurance of Hawaii, Inc. (our "Workers' Assurance Program"), that allow us to restrict cash for the purpose of providing cash-backed instruments for our workers' compensation collateral. Our Workers' Assurance Program cash and cash-backed instruments include cash-backed letters of credit, cash held in trusts and cash deposits held by our insurance carriers. The fees related to those instruments subject to an annual fee were approximately 0.57% as of December 26, 2008.
Our surety bonds are issued by independent insurance companies on our behalf and bear annual fees based on a percentage of the bond, which is determined by each independent surety carrier, but do not exceed 2.0% of the bond amount, subject to a minimum charge. The terms of these bonds are subject to review and renewal every one to four years and most bonds can be canceled by the sureties with as little as 60 days notice. Should our financial results deteriorate the surety carriers may require more cash to be deposited to back up the surety bonds that they have issued. This cash requirement could equal as much as the difference between the total outstanding amount of surety bonds, and the current amount of cash backing them.
The following table provides a reconciliation of our collateral commitments to our workers' compensation reserve as of the period end dates presented (in millions):
| |
December 26, 2008 |
December 28, 2007 |
|||||
|---|---|---|---|---|---|---|---|
Ending workers' compensation reserve: |
$ | 203.6 | $ | 197.4 | |||
Discount on reserves (1) |
44.7 | 44.2 | |||||
Collateral posted with providers in comparison to obligation incurred (2) |
(35.6 | ) | (37.3 | ) | |||
Discounted reserves for claims above our deductible (3) |
(27.0 | ) | (25.0 | ) | |||
Total Collateral Commitments |
$ | 185.7 | $ | 179.3 | |||
Our total collateral commitments differ from our workers' compensation reserve due to several factors including the following which are reconciled above:
Page -28
The following table provides an analysis of changes in our workers' compensation claims reserves (in millions). Changes in reserve estimates are reflected in the income statement for the period when the changes in estimates are made.
| |
2008 | 2007 | 2006 | ||||||||
|---|---|---|---|---|---|---|---|---|---|---|---|
Beginning balance |
$ | 197.4 | $ | 189.4 | $ | 167.8 | |||||
Self-insurance reserve expenses |
|||||||||||
Expenses related to current year (net of discount) |
45.9 | 64.0 | 64.2 | ||||||||
Changes related to prior years (net of discount) |
(21.0 | ) | (19.5 | ) | (7.9 | ) | |||||
Total |
24.9 | 44.5 | 56.3 | ||||||||
Amortization of prior years' discount |
2.1 |
1.1 |
2.1 |
||||||||
Payments |
|||||||||||
Payments related to current year claims |
(11.4 | ) | (11.6 | ) | (9.0 | ) | |||||
Payments related to claims from prior years |
(15.9 | ) | (30.9 | ) | (29.6 | ) | |||||
Total |
(27.3 | ) | (42.5 | ) | (38.6 | ) | |||||
Net change in excess claims reserve (1) |
1.9 |
2.7 |
1.8 |
||||||||
Liability assumed from acquired businesses, net of discount |
4.6 | 2.2 | – | ||||||||
Ending balance |
203.6 |
197.4 |
189.4 |
||||||||
Less current portion |
51.4 | 52.4 | 52.2 | ||||||||
Long-term portion |
$ | 152.2 | $ | 145.0 | $ | 137.2 | |||||
CONTRACTUAL OBLIGATIONS AND COMMITMENTS
We have various contractual obligations that are recorded as liabilities in our consolidated financial statements. Certain contractual obligations, such as operating lease obligations, are not recognized as liabilities in our consolidated financial statements, but are required to be disclosed. There were no material changes outside the ordinary course of business in our contractual obligations during 2008.
The following table provides a summary of our contractual obligations as of the end of fiscal 2008:
| |
Payments Due by Period (in millions) | |||||||||||||||
|---|---|---|---|---|---|---|---|---|---|---|---|---|---|---|---|---|
| Contractual Obligations | Total | 2009 | 2010 through 2011 |
2012 through 2013 |
2014 and later |
|||||||||||
Capital lease obligations (1) |
$ | 1.2 | $ | 0.4 | $ | 0.8 | – | – | ||||||||
Operating leases (2) |
17.9 | 6.2 | 8.1 | 3.2 | 0.4 | |||||||||||
Purchase obligations (3) |
32.2 | 15.9 | 16.3 | – | – | |||||||||||
Other Obligations (4) |
1.9 | 1.9 | – | – | – | |||||||||||
Total Contractual Cash Obligations |
$ | 53.2 | $ | 24.4 | $ | 25.2 | $ | 3.2 | $ | 0.4 | ||||||
Page -29
SUMMARY OF CRITICAL ACCOUNTING ESTIMATES
Management's Discussion and Analysis of Financial Condition and Results of Operations discusses our consolidated financial statements, which have been prepared in accordance with accounting principles generally accepted in the United States of America. The preparation of these financial statements requires management to make estimates and assumptions that affect the reported amounts of assets and liabilities and the disclosure of contingent assets and liabilities at the date of the consolidated financial statements and the reported amounts of revenue and expenses during the reporting period. On an on-going basis, management evaluates its estimates and judgments. Management bases its estimates and judgments on historical experience and on various other factors that are believed to be reasonable under the circumstances, the results of which form the basis for making judgments about the carrying value of assets and liabilities that are not readily apparent from other sources. Actual results may differ from these estimates under different assumptions or conditions.
Management believes that the following accounting estimates are the most critical to aid in fully understanding and evaluating our reported financial results, and they require management's most difficult, subjective or complex judgments, resulting from the need to make estimates about the effect of matters that are inherently uncertain.
Workers' compensation reserves. We maintain reserves for workers' compensation claims, including the excess claims portion above our deductible, using actuarial estimates of the future cost of claims and related expenses. These estimates are impacted by claims that have been reported but not settled and claims that have been incurred but not reported. These reserves, which reflect potential liabilities to be paid in future periods based on estimated payment patterns, are discounted to estimated net present value using discount rates based on average returns on "risk-free" U.S. Treasury instruments, which are evaluated on a quarterly basis. We evaluate the reserves regularly throughout the year and make adjustments accordingly. If the actual cost of such claims and related expenses exceeds the amounts estimated, additional reserves may be required.
Our workers' compensation reserves include not only estimated expenses for claims within our self-insured limit but also estimated expenses related to claims above our deductible limits. We record an estimated receivable for the insurance coverage on excess claims based on the contractual policy agreements we have with insurance companies. We discount this receivable to its estimated net present value using the risk-free rates associated with the weighted average lives of our excess claims. The weighted average claim lives are actuarially determined. When appropriate, based on our best estimate, we record a valuation allowance against the insurance receivable to reflect amounts that may not be realized. Two of the workers' compensation insurance companies ("Troubled Insurance Companies") with which we formerly did business are in liquidation and have failed to pay a number of excess claims to date.
Allowance for doubtful accounts. We establish an allowance for doubtful accounts for estimated losses resulting from the failure of our customers to make required payments. The allowance for doubtful accounts is determined based on historical write-off experience and current economic data and represents our best estimate of the amount of probable credit losses. The allowance for doubtful accounts is reviewed quarterly and past due balances are written-off when it is probable the receivable will not be collected. If the financial condition of our customers were to deteriorate, resulting in an impairment of their ability to make payments, additional allowances may be required.
Goodwill and intangible assets. We test goodwill and indefinite-lived intangible assets for impairment annually and whenever events or circumstances make it more likely than not that an impairment may have occurred, such as a significant adverse change in the business climate. Our annual impairment test is done during the fourth fiscal quarter. Goodwill is tested for impairment using a two-step process. In the first step, the fair value of each reporting unit is compared to the carrying value of the net assets assigned to the unit. If the fair value of the reporting unit exceeds its carrying value, goodwill is considered not impaired. If the carrying value of the reporting unit exceeds its fair value, then the second step of the impairment test must be performed in order to determine the implied fair value of the reporting unit's goodwill. Determining the implied fair value of goodwill requires valuation of all of our tangible and intangible assets and liabilities. If the carrying value of a reporting unit's goodwill exceeds its implied fair value, then we would record an impairment loss equal to the difference.
Determining our reporting units, the fair value of a reporting unit, the fair value of assets and liabilities within a reporting unit, and when to test for impairment, requires judgment and involves the use of significant estimates and assumptions. These estimates and assumptions include revenue growth rates and operating margins used to calculate projected future cash flows, risk-adjusted discount rates, future economic and market conditions and determination of appropriate market comparables. We base fair value estimates on assumptions we believe to be reasonable but that are unpredictable and
Page -30
inherently uncertain. Actual future results may differ from those estimates. In addition, judgments and assumptions are required to allocate assets and liabilities to reporting units.
We test our long-lived intangible assets for impairment whenever events and circumstances indicate the carrying value may not be recoverable. We measure the amount of impairment by calculating the amount by which the carrying value of these assets exceeded their estimated fair values, which are based on projected undiscounted future net cash flows. Estimating fair values involves significant assumptions, especially regarding future sales prices, sales volumes, and costs.
Reserves for contingent legal and regulatory liabilities. We have established reserves for contingent legal and regulatory liabilities. We record a liability when our management judges that it is probable that a legal claim will result in an adverse outcome and the amount of liability can be reasonably estimated. We evaluate this reserve regularly throughout the year and make adjustments as needed. If the actual outcome of these matters is different than expected, an adjustment is charged or credited to expense in the period the outcome occurs or the period in which the estimate changes.
Income taxes and related valuation allowances. We account for income taxes by recording taxes payable or refundable for the current year and deferred tax assets and liabilities for the future tax consequences of events that have been recognized in our financial statements or tax returns. We measure these expected future tax consequences based upon the provisions of tax law as currently enacted; the effects of future changes in tax laws are not anticipated. Future tax law changes, such as a change in the corporate tax rate, could have a material impact on our financial condition or results of operations. When appropriate, we record a valuation allowance against deferred tax assets to offset future tax benefits that may not be realized. In determining whether a valuation allowance is appropriate, we consider whether it is more likely than not that all or some portion of our deferred tax assets will not be realized, based in part upon management's judgments regarding future events and past operating results.
NEW ACCOUNTING STANDARDS
On December 29, 2007, we partially adopted SFAS No. 157, Fair Value Measurements ("SFAS 157"). Our partial adoption is in accordance with FASB Staff Position No. 157-2 Effective Date of FASB Statement No. 157 ("FSP 157-2"). FSP 157-2 delays the effective date of SFAS 157 for nonfinancial assets and nonfinancial liabilities, except those that are recognized or disclosed on a recurring basis, to fiscal years beginning after November 15, 2008. SFAS 157 establishes a framework for measuring fair value and requires expanded disclosure about the information used to measure fair value. SFAS 157 clarifies that fair value is an exit price, representing the amount that would be received to sell an asset or paid to transfer a liability in an orderly transaction between market participants. As such, fair value is a market-based measurement that should be determined based on assumptions that market participants would use in pricing an asset or liability. As a basis for considering such assumptions, SFAS 157 establishes a three-tier value hierarchy, which prioritizes the inputs used in measuring fair value. Our partial adoption of SFAS 157 did not have a material effect on our consolidated financial position, results of operations or cash flows nor do we anticipate further adoption of the provision for nonfinancial assets and liabilities to have a material impact on our consolidated financial position, results of operations or cash flows. See Note 5 of the Notes to Consolidated Financial Statements found in Item 8 of Part II of this Form 10-K for additional information.
In December 2007, the FASB issued SFAS No. 141 (revised 2007), Business Combinations ("SFAS 141R"), which replaces SFAS 141. SFAS 141R establishes principles and requirements for how an acquirer recognizes and measures in its financial statements the identifiable assets acquired, the liabilities assumed, any resulting goodwill, and any non-controlling interest in the acquiree. SFAS 141R also provides for disclosures to enable users of the financial statements to evaluate the nature and financial effects of the business combination. SFAS 141R is effective for fiscal years beginning after December 15, 2008. We will adopt SFAS 141R beginning in the first fiscal quarter of 2009, which will be applied prospectively to business combinations completed on or after that date. For acquisitions completed prior to January 1, 2009, the new standard requires that changes in deferred tax asset valuation allowances and acquired income tax uncertainties after the measurement period must be recognized in earnings rather than as an adjustment to the cost of the acquisition. We do not expect this new guidance to have a significant impact on our consolidated financial statements.
In April 2008, the FASB issued FSP No. 142-3, Determination of the Useful Life of Intangible Assets ("FSP 142-3"). This FSP amends the factors that should be considered in developing renewal or extension assumptions used to determine the useful life of a recognized intangible asset under SFAS No. 142, Goodwill and Other Intangible Assets. The FSP is effective for fiscal years beginning after December 15, 2008 and early adoption is prohibited. The adoption of FSP 142-3 will not have a material effect on our consolidated financial position, results of operations or cash flows.
Page -31
Item 7A. QUANTITATIVE AND QUALITATIVE DISCLOSURES ABOUT MARKET RISK
We are exposed to market risk related to changes in interest rates and foreign currency exchange rates, each of which could adversely affect the value of our investments. We do not currently use derivative financial instruments. As of December 26, 2008, our purchased investments included in cash and cash equivalents had maturities of less than 90 days. Therefore, an increase or decrease in interest rates immediately and uniformly by 10% from our 2008 year end levels would not have a material effect upon our cash and cash equivalent balances, operating results or cash flows.
We have a certain amount of assets and liabilities denominated in certain foreign currencies related to our international operations. We have not hedged our foreign currency translation risk and we have the ability to hold our foreign-currency denominated assets indefinitely and do not expect that a sudden or significant change in foreign exchange rates will have a material impact on future operating results or cash flows.
Page -32
Item 8. FINANCIAL STATEMENTS AND SUPPLEMENTARY DATA
The following consolidated financial statements of the Company and its subsidiaries are included herein as indicated below:
| |
|
||||
|---|---|---|---|---|---|
Consolidated Financial Statements |
|||||
Consolidated Balance Sheets – December 26, 2008 and December 28, 2007 |
|||||
Consolidated Statements of Operations – Fiscal years ended December 26, 2008, December 28, 2007 and December 29, 2006 |
|||||
Consolidated Statements of Shareholders' Equity and Comprehensive Income (Loss) – Fiscal years ended December 26, 2008, December 28, 2007 and December 29, 2006 |
|||||
Consolidated Statements of Cash Flows – Fiscal years ended December 26, 2008, December 28, 2007 and December 29, 2006 |
|||||
Notes to Consolidated Financial Statements |
|||||
Report of Independent Registered Public Accounting Firm |
|||||
Selected Quarterly Financial Data (unaudited) |
|||||
Page -33
TrueBlue, Inc.
Consolidated Balance Sheets
In Thousands (Except Par Values)
| |
December 26, 2008 |
December 28, 2007 |
|||||||
|---|---|---|---|---|---|---|---|---|---|
ASSETS |
|||||||||
Current assets: |
|||||||||
Cash and cash equivalents |
$ | 108,102 | $ | 57,008 | |||||
Marketable securities |
– | 10,954 | |||||||
Accounts receivable, net of allowance for doubtful accounts |
104,979 | 140,027 | |||||||
Prepaid expenses, deposits and other current assets |
9,061 | 14,032 | |||||||
Income tax receivable |
15,821 | – | |||||||
Deferred income taxes |
4,841 | 7,487 | |||||||
Total current assets |
242,804 | 229,508 | |||||||
Property and equipment, net |
61,542 | 44,909 | |||||||
Restricted cash |
120,323 | 132,497 | |||||||
Deferred income taxes |
12,831 | 9,998 | |||||||
Goodwill |
36,960 | 71,065 | |||||||
Intangible assets, net |
26,404 | 40,739 | |||||||
Other assets, net |
18,811 | 16,533 | |||||||
Total assets |
$ |
519,675 |
$ |
545,249 |
|||||
LIABILITIES AND SHAREHOLDERS' EQUITY |
|||||||||
Current liabilities: |
|||||||||
Accounts payable and other accrued expenses |
$ | 21,852 | $ | 25,026 | |||||
Accrued wages and benefits |
19,750 | 25,207 | |||||||
Current portion of workers' compensation claims reserve |
51,414 | 52,360 | |||||||
Income tax payable |
– | 7,377 | |||||||
Other current liabilities |
2,292 | 4,568 | |||||||
Total current liabilities |
95,308 | 114,538 | |||||||
Workers' compensation claims reserve, less current portion |
152,178 | 145,042 | |||||||
Other non-current liabilities |
2,060 | 1,842 | |||||||
Total liabilities |
249,546 | 261,422 | |||||||
Commitments and contingencies |
|||||||||
Shareholders' equity: |
|||||||||
Preferred stock, $0.131 par value, 20,000 shares authorized; no shares issued and outstanding |
– | – | |||||||
Common stock, no par value, 100,000 shares authorized; 43,340 and 43,917 shares issued and outstanding |
1 | 1 | |||||||
Accumulated other comprehensive income |
1,992 | 3,738 | |||||||
Retained earnings |
268,136 | 280,088 | |||||||
Total shareholders' equity |
270,129 |
283,827 |
|||||||
Total liabilities and shareholders' equity |
$ |
519,675 |
$ |
545,249 |
|||||
See accompanying notes to consolidated financial statements
Page -34
TrueBlue, Inc.
Consolidated Statements of Operations
Fiscal years ended December 26, 2008, December 28, 2007 and December 29, 2006
In Thousands
(Except Per Share Data)
| |
2008 | 2007 | 2006 | ||||||||
|---|---|---|---|---|---|---|---|---|---|---|---|
Revenue from services |
$ | 1,384,269 | $ | 1,385,656 | $ | 1,349,118 | |||||
Cost of services |
971,757 |
943,563 |
915,773 |
||||||||
Gross profit |
412,512 | 442,093 | 433,345 | ||||||||
Selling, general and administrative expenses |
332,113 |
336,220 |
318,681 |
||||||||
Goodwill and intangible asset impairment |
61,000 | – | – | ||||||||
Depreciation and amortization |
16,774 | 12,223 | 10,364 | ||||||||
Income from operations |
2,625 | 93,650 | 104,300 | ||||||||
Interest expense |
(803 |
) |
(965 |
) |
(775 |
) |
|||||
Interest and other income |
6,333 | 11,918 | 12,648 | ||||||||
Interest and other income, net |
5,530 | 10,953 | 11,873 | ||||||||
Income before tax expenses |
8,155 |
104,603 |
116,173 |
||||||||
Income tax expense |
12,314 |
38,405 |
39,701 |
||||||||
Net income (loss) |
$ |
(4,159 |
) |
$ |
66,198 |
$ |
76,472 |
||||
Net income (loss) per common share: |
|||||||||||
Basic |
$ | (0.10 | ) | $ | 1.45 | $ | 1.46 | ||||
Diluted |
$ | (0.10 | ) | $ | 1.44 | $ | 1.45 | ||||
Weighted average shares outstanding: |
|||||||||||
Basic |
42,885 | 45,683 | 52,418 | ||||||||
Diluted |
43,073 | 45,960 | 52,853 | ||||||||
See accompanying notes to consolidated financial statements
Page -35
TrueBlue, Inc.
Consolidated Statements of Shareholders' Equity and Comprehensive Income (Loss)
Fiscal years ended December 26, 2008, December 28, 2007 and
December 29, 2006
In Thousands
| |
|
|
|
Accumulated other comprehensive income |
|
||||||||||||
|---|---|---|---|---|---|---|---|---|---|---|---|---|---|---|---|---|---|
| |
Common stock | Retained earnings |
Total shareholders' equity |
||||||||||||||
| |
Shares | Amount | |||||||||||||||
Balances, December 30, 2005 |
53,838 | $ | 149,415 | $ | 196,946 | $ | 2,237 | $ | 348,598 | ||||||||
Net income |
76,472 | 76,472 | |||||||||||||||
Foreign currency translation adjustment, net of tax |
456 | 456 | |||||||||||||||
Unrealized gain on marketable securities |
35 | 35 | |||||||||||||||
Total comprehensive income |
76,963 | ||||||||||||||||
Purchases and retirement of common stock |
(4,244 | ) | (88,744 | ) | (88,744 | ) | |||||||||||
Common stock issued on the exercise of options including tax benefits |
758 | 8,674 | 8,674 | ||||||||||||||
Common stock issued through employee benefit plans |
89 | 1,467 | 1,467 | ||||||||||||||
Restricted stock grants |
256 | – | – | ||||||||||||||
Restricted stock cancellations |
(59 | ) | – | – | |||||||||||||
Stock withheld for tax purposes- restricted stock |
(56 | ) | (1,164 | ) | (1,164 | ) | |||||||||||
Stock-based compensation |
38 | 6,377 | 6,377 | ||||||||||||||
Common stock bonus and incentive |
17 | 347 | 347 | ||||||||||||||
Balances, December 29, 2006 |
50,637 | $ | 76,372 | $ | 273,418 | $ | 2,728 | $ | 352,518 | ||||||||
Net income |
66,198 | 66,198 | |||||||||||||||
Foreign currency translation adjustment, net of tax |
1,018 | 1,018 | |||||||||||||||
Unrealized loss on marketable securities |
(8 | ) | (8 | ) | |||||||||||||
Total comprehensive income |
67,208 | ||||||||||||||||
Purchases and retirement of common stock |
(7,600 | ) | (90,782 | ) | (59,528 | ) | (150,310 | ) | |||||||||
Common stock issued on the exercise of options including tax benefits |
440 | 7,041 | 7,041 | ||||||||||||||
Common stock issued through employee benefit plans |
88 | 1,424 | 1,424 | ||||||||||||||
Restricted stock grants |
419 | – | – | ||||||||||||||
Restricted stock cancellations |
(62 | ) | – | – | |||||||||||||
Stock withheld for tax purposes-restricted stock |
(51 | ) | (997 | ) | (997 | ) | |||||||||||
Stock-based compensation |
46 | 6,943 | 6,943 | ||||||||||||||
Balances, December 28, 2007 |
43,917 | $ | 1 | $ | 280,088 | $ | 3,738 | $ | 283,827 | ||||||||
Net loss |
(4,159 | ) | (4,159 | ) | |||||||||||||
Foreign currency translation adjustment, net of tax |
(1,695 | ) | (1,695 | ) | |||||||||||||
Unrealized loss on marketable securities |
(51 | ) | (51 | ) | |||||||||||||
Total comprehensive loss |
(5,905 | ) | |||||||||||||||
Purchases and retirement of common stock |
(1,232 | ) | (8,204 | ) | (7,793 | ) | (15,997 | ) | |||||||||
Common stock issued on the exercise of options including tax benefits |
177 | 104 | 104 | ||||||||||||||
Common stock issued through employee benefit plans |
135 | 1,412 | 1,412 | ||||||||||||||
Restricted stock grants |
483 | – | – | ||||||||||||||
Restricted stock cancellations |
(121 | ) | – | – | |||||||||||||
Stock withheld for tax purposes-restricted stock |
(79 | ) | (1,018 | ) | (1,018 | ) | |||||||||||
Stock-based compensation |
60 | 7,706 | 7,706 | ||||||||||||||
Balances, December 26, 2008 |
43,340 | $ | 1 | $ | 268,136 | $ | 1,992 | $ | 270,129 | ||||||||
See accompanying notes to consolidated financial statements
Page -36
TrueBlue, Inc.
Consolidated Statements of Cash Flows
Fiscal years ended December 26, 2008, December 28, 2007 and December 29, 2006
In Thousands
| |
2008 | 2007 | 2006 | ||||||||
|---|---|---|---|---|---|---|---|---|---|---|---|
Cash flows from operating activities: |
|||||||||||
Net income (loss) |
$ | (4,159 | ) | $ | 66,198 | $ | 76,472 | ||||
Adjustments to reconcile net income (loss) to net cash provided by operating activities: |
|||||||||||
Depreciation and amortization |
16,774 | 12,223 | 10,364 | ||||||||
Goodwill and intangible asset impairment |
61,000 | – | – | ||||||||
Provision for doubtful accounts |
9,374 | 9,987 | 7,215 | ||||||||
Stock-based compensation |
7,706 | 6,943 | 6,377 | ||||||||
Excess tax benefits from stock-based compensation |
– | (1,451 | ) | (3,527 | ) | ||||||
Deferred income taxes |
2,960 | (8,696 | ) | (3,169 | ) | ||||||
Other operating activities |
(311 | ) | 401 | 56 | |||||||
Changes in operating assets and liabilities, exclusive of businesses acquired: |
|||||||||||
Accounts receivable |
36,602 | (10,897 | ) | (5,429 | ) | ||||||
Income taxes |
(25,170 | ) | 12,359 | 4,797 | |||||||
Other assets |
3,133 | 3,734 | (2,677 | ) | |||||||
Accounts payable and other accrued expenses |
(5,199 | ) | 270 | (3,068 | ) | ||||||
Accrued wages and benefits |
(8,815 | ) | (2,541 | ) | (798 | ) | |||||
Workers' compensation claims reserve |
1,680 | 5,748 | 21,576 | ||||||||
Other liabilities |
(3,137 | ) | 4,376 | (38 | ) | ||||||
Net cash provided by operating activities |
92,438 | 98,654 | 108,151 | ||||||||
Cash flows from investing activities: |
|||||||||||
Capital expenditures |
(26,137 | ) | (21,040 | ) | (13,007 | ) | |||||
Purchases of marketable securities |
(27,158 | ) | (191,032 | ) | (88,266 | ) | |||||
Maturities of marketable securities |
38,087 | 271,580 | 90,301 | ||||||||
Acquisitions of businesses, net of cash acquired |
(22,390 | ) | (76,902 | ) | – | ||||||
Change in restricted cash |
12,174 | 11,234 | 8,948 | ||||||||
Other |
(11 | ) | (167 | ) | 214 | ||||||
Net cash used in investing activities |
(25,435 | ) | (6,327 | ) | (1,810 | ) | |||||
Cash flows from financing activities: |
|||||||||||
Purchases and retirement of common stock |
(15,997 | ) | (150,310 | ) | (88,744 | ) | |||||
Net proceeds from sale of stock through options and employee benefit plans |
3,488 | 5,712 | 6,457 | ||||||||
Shares withheld for taxes upon vesting of restricted stock |
(1,018 | ) | (997 | ) | (1,164 | ) | |||||
Excess tax benefits from stock-based compensation |
– | 1,451 | 3,527 | ||||||||
Payments on debt |
(250 | ) | (909 | ) | (1,212 | ) | |||||
Other |
(229 | ) | – | – | |||||||
Net cash used in financing activities |
(14,006 | ) | (145,053 | ) | (81,136 | ) | |||||
Effect of exchange rates on cash |
(1,903 | ) | 1,790 | 584 | |||||||
Net change in cash and cash equivalents |
51,094 | (50,936 | ) | 25,789 | |||||||
CASH AND CASH EQUIVALENTS, beginning of year |
57,008 | 107,944 | 82,155 | ||||||||
CASH AND CASH EQUIVALENTS, end of year |
$ | 108,102 | $ | 57,008 | $ | 107,944 | |||||
See accompanying notes to consolidated financial statements
Page -37
TrueBlue, Inc.
Notes to Consolidated Financial Statements
NOTE 1: SUMMARY OF SIGNIFICANT ACCOUNTING POLICIES
Description of business
TrueBlue, Inc. ("TrueBlue," "we," "us," "our") is an international provider of temporary blue-collar staffing. In 2008, we put approximately 500,000 people to work through the following brands: Labor Ready for general labor, Spartan Staffing for light industrial services, and CLP Resources, PlaneTechs, and TLC for skilled trades. Headquartered in Tacoma, Washington, we serve approximately 250,000 small to mid-sized businesses in the construction, warehousing, hospitality, landscaping, transportation, light manufacturing, retail, wholesale, facilities, sanitation, and aviation industries.
We began operations in 1989 under the name Labor Ready, Inc. providing on-demand, general labor staffing services. Starting in 2004, we began acquiring additional brands to expand our service offerings to customers in the blue-collar staffing market. Effective December 18, 2007, Labor Ready, Inc. changed its name to TrueBlue, Inc. The name change reflects our vision to be the leading provider of blue-collar staffing with multiple brands serving the temporary staffing industry. Our former company name of Labor Ready remains as our primary brand name for on-demand, general labor staffing services.
Basis of presentation
The consolidated financial statements include the accounts of TrueBlue, Inc. and all of its wholly-owned subsidiaries. All significant intercompany balances and transactions have been eliminated in consolidation. The consolidated financial statements and accompanying notes are prepared in accordance with accounting principles generally accepted in the United States of America.
TrueBlue operations are one reportable segment. Our operations are all in the blue-collar staffing sector of the temporary labor market and focus on supplying customers with temporary employees. All our brands have the following similar characteristics:
We expect similar operating margins for our brands based on historical experience. The long-term performance expectations of all our brands are similar as are the underlying financial and economic metrics used to manage those brands.
Our international operations are not significant to our total operations for segment reporting purposes. In December 2008 we sold the remaining Labor Ready branches in the United Kingdom. Total revenues from operations in the United Kingdom in 2008 were less than 2% of consolidated revenues.
Fiscal year end
The consolidated financial statements are presented on a 52/53-week fiscal year end basis, with the last day of the fiscal year ending on the last Friday of December. In fiscal years consisting of 53 weeks the final quarter will consist of 14 weeks while in 52-week years all quarters will consist of 13 weeks. Our next 53-week year will be fiscal 2010.
Use of estimates
The preparation of consolidated financial statements in conformity with accounting principles generally accepted in the United States of America requires management to make estimates and assumptions that affect the amounts reported in our financial statements and accompanying notes. Although these estimates are based on our knowledge of current events and actions we may undertake in the future, actual results may ultimately differ from those estimates.
Page -38
Revenue recognition
Revenue from services is recognized at the time the service is provided and is net of adjustments related to customer credits. Revenue includes cash dispensing machine fees, billable travel, and other reimbursable costs, which are immaterial for all periods presented. Customer discounts or other incentives are recognized in the period the related revenue is earned.
Cost of services
Cost of services primarily includes wages of temporary employees and related payroll taxes and workers' compensation expenses. Cost of services also includes billable travel and other reimbursable costs, which are immaterial for all periods presented.
Advertising costs
We expense production costs of print, radio, and other advertisements as of the first date the advertisements take place. Advertising expenses included in selling, general and administrative expenses were $5.2 million in 2008, $9.5 million in 2007 and $9.2 million in 2006.
Cash and cash equivalents
We consider all highly liquid instruments purchased with a maturity of three months or less at date of purchase to be cash equivalents.
Accounts receivable and allowance for doubtful accounts
Accounts receivable are recorded at the invoiced amount together with interest for certain past due accounts. We establish an allowance for doubtful accounts for estimated losses resulting from the failure of our customers to make required payments. The allowance for doubtful accounts is determined based on historical write-off experience and current economic data and represents our best estimate of the amount of probable credit losses. The allowance for doubtful accounts is reviewed quarterly and past due balances are written-off when it is probable the receivable will not be collected. Our allowance for doubtful accounts was $5.4 million and $6.0 million as of December 26, 2008 and December 28, 2007, respectively.
Property and equipment
Property and equipment are stated at cost and consist of the following (in millions):
| |
December 26, 2008 |
December 28, 2007 |
|||||
|---|---|---|---|---|---|---|---|
Buildings and land |
$ | 24.1 | $ | 23.7 | |||
Computers and software |
53.3 | 23.5 | |||||
Cash dispensing machines |
12.2 | 13.7 | |||||
Furniture and equipment |
9.5 | 9.6 | |||||
Construction in progress |
7.6 | 13.1 | |||||
|
106.7 | 83.6 | |||||
Less accumulated depreciation and amortization |
(45.2 | ) | (38.7 | ) | |||
|
$ | 61.5 | $ | 44.9 | |||
Construction in progress consists primarily of internally developed software. We capitalize costs incurred to develop internal-use software during the application development stage. Capitalization of software development costs occurs after the preliminary project stage is complete, management authorizes the project, and it is probable that the project will be completed and the software will be used for the function intended. We expense costs incurred in the post-implementation stage for training and maintenance. A subsequent addition, modification or upgrade to internal-use software is capitalized only to the extent that it enables the software to perform a task it previously could not perform. As of December 26, 2008 and December 28, 2007, capitalized software costs, net of accumulated amortization, were $27.5 million and $3.9 million, respectively, excluding amounts in Construction in progress.
We compute depreciation and amortization of Property and equipment using the straight-line method over the estimated useful lives of the assets. Depreciation and amortization of Property and equipment totaled $9.8 million, $9.0 million and
Page -39
$7.9 million in 2008, 2007 and 2006, respectively. It is our policy is to use the following estimated useful lives for depreciation and amortization of our assets:
| |
Years | |||
|---|---|---|---|---|
Buildings |
40 | |||
Computers and software |
3 - 7 | |||
Cash dispensing machines |
7 | |||
Furniture and equipment |
3 - 10 | |||
Leasehold improvements, the costs of which are included in Buildings and land, are amortized over the shorter of the related non-cancelable lease term, which is typically 90 days, or their estimated useful lives.
Property under capital lease consists primarily of computer equipment. The related depreciation for capital lease assets is included in depreciation expense.
Goodwill and intangible assets
We test goodwill and indefinite-lived intangible assets for impairment annually and whenever events or circumstances make it more likely than not that an impairment may have occurred, such as a significant adverse change in the business climate. Our annual impairment test is done during the fourth fiscal quarter. Goodwill is tested for impairment using a two-step process. In the first step, the fair value of each reporting unit is compared to the carrying value of the net assets assigned to the unit. If the fair value of the reporting unit exceeds its carrying value, goodwill is considered not impaired. If the carrying value of the reporting unit exceeds its fair value, then the second step of the impairment test must be performed in order to determine the implied fair value of the reporting unit's goodwill. Determining the implied fair value of goodwill requires valuation of all of our tangible and intangible asset and liabilities. If the carrying value of a reporting unit's goodwill exceeds its implied fair value, then we would record an impairment loss equal to the difference.
Determining our reporting units, the fair value of a reporting unit, the fair value of assets and liabilities within a reporting unit, and when to test for impairment, requires judgment and involves the use of significant estimates and assumptions. These estimates and assumptions include revenue growth rates and operating margins used to calculate projected future cash flows, risk-adjusted discount rates, future economic and market conditions and determination of appropriate market comparables. We base fair value estimates on assumptions we believe to be reasonable but that are unpredictable and inherently uncertain. Actual future results may differ from those estimates. In addition, judgments and assumptions are required to allocate assets and liabilities to reporting units.
We test our long-lived intangible assets for impairment whenever events and circumstances indicate the carrying value may not be recoverable. We measure the amount of impairment by calculating the amount by which the carrying value of these assets exceeded their estimated fair values, which are based on projected undiscounted future net cash flows. Estimating fair values involves significant assumptions, especially regarding future sales prices, sales volumes, and costs.
Other assets, net
Other assets consist primarily of receivables from insurance companies, net of related valuation allowance.
Workers' compensation reserves
We maintain reserves for workers' compensation claims, including the excess claims portion above our deductible, using actuarial estimates of the future cost of claims and related expenses. These estimates are impacted by claims that have been reported but not settled and claims that have been incurred but not reported. These reserves, which reflect potential liabilities to be paid in future periods based on estimated payment patterns, are discounted to estimated net present value using discount rates based on average returns of "risk-free" U.S. Treasury instruments, which are evaluated on a quarterly basis. We evaluate the reserves regularly throughout the year and make adjustments accordingly. If the actual cost of such claims and related expenses exceeds the amounts estimated, additional reserves may be required.
Our workers' compensation reserves include not only estimated expenses for claims within our self-insured limit but also estimated expenses related to claims above our deductible limits. We record an estimated receivable for the insurance coverage on excess claims based on the contractual policy agreements we have with insurance companies. We discount this receivable to its estimated net present value using the risk-free rates associated with the weighted average lives of our excess claims. The weighted average claim lives are actuarially determined. When appropriate, based on our best estimate, we record a valuation allowance against the insurance receivable to reflect amounts that may not be realized. Two of the
Page -40
workers' compensation insurance companies ("Troubled Insurance Companies") with which we formerly did business are in liquidation and have failed to pay a number of excess claims to date.
Reserves for contingent legal and regulatory liabilities
We have established reserves for contingent legal and regulatory liabilities. We record a liability when management judges that it is probable that a legal claim will result in an adverse outcome and the amount of liability can be reasonably estimated. We evaluate this reserve regularly throughout the year and make adjustments as needed. If the actual outcome of these matters is different than expected, an adjustment is charged or credited to expense in the period the outcome occurs or the period in which the estimate changes.
Income taxes and related valuation allowance
We account for income taxes by recording taxes payable or refundable for the current year and deferred tax assets and liabilities for the future tax consequences of events that have been recognized in our financial statements or tax returns. As required under Statement of Financial Accounting Standards No. 109, Accounting for Income Taxes, ("SFAS 109") these expected future tax consequences are measured based on provisions of tax law as currently enacted; the effects of future changes in tax laws are not anticipated. Future tax law changes, such as a change in the corporate tax rate, could have a material impact on our financial condition or results of operations. When appropriate, we record a valuation allowance against deferred tax assets to offset future tax benefits that may not be realized. In determining whether a valuation allowance is appropriate, we consider whether it is more likely than not that all or some portion of our deferred tax assets will not be realized, based in part upon management's judgments regarding future events and past operating results. Based on that analysis, we have determined that a valuation allowance is appropriate for certain foreign net operating losses that we expect will not be utilized within the permitted carry forward periods as of December 26, 2008 and December 28, 2007. We adopted the provisions of FASB Interpretation No. 48, Accounting for Uncertainty in Income Taxes ("FIN 48") on December 30, 2006, the first day of our fiscal 2007 year. See Note 10 for further discussion.
Foreign currency
Cumulative foreign currency translation adjustments relate to our consolidated foreign subsidiaries. Assets and liabilities recorded in foreign currencies are translated at the applicable exchange rate on the balance sheet date. Revenue and expenses are translated at average rates of exchange prevailing during the year. Unrealized translation adjustments resulting from our investments in our foreign entities that will not be repaid in the foreseeable future are charged or credited to the cumulative foreign currency translation account as a component of accumulated other comprehensive income in the Shareholders' equity section of our Consolidated Balance Sheets. Unrealized translation adjustments on U.S. denominated loans to our foreign entities that will be repaid in the foreseeable future are reported in our Consolidated Statements of Operations.
Purchases and retirement of our common stock
Purchases of our common stock are not displayed separately as treasury stock on the Consolidated Balance Sheets in accordance with the Washington Business Corporation Act, which requires the retirement of purchased shares. As a result, shares of our common stock that we purchase are retired immediately. It is our accounting policy to first record these purchases as a reduction to our Common stock account. Once the Common stock account has been reduced to a nominal balance, remaining purchases are recorded as a reduction to our Retained earnings account. See Note 9 for further discussion of share purchases.
Shares outstanding
Shares outstanding for reportable purposes include shares of unvested restricted stock. Unvested restricted stock included in reportable shares outstanding was 0.8 million shares and 0.7 million shares as of December 26, 2008 and December 28, 2007, respectively. Shares of unvested restricted stock are excluded from our calculation of basic weighted average shares outstanding, but their dilutive impact is added back in the calculation of diluted weighted average shares outstanding.
Reclassifications
Certain amounts in the consolidated financial statements for the fifty-two weeks ended December 28, 2007 and December 29, 2006 have been reclassified to conform to the 2008 presentation. These reclassifications had no effect on the operating results of either period.
Recent Accounting Pronouncements
On December 29, 2007, we partially adopted SFAS No. 157, Fair Value Measurements ("SFAS 157"). Our partial adoption is in accordance with FASB Staff Position No. 157-2 Effective Date of FASB Statement No. 157 ("FSP 157-2"). FSP 157-2
Page -41
delays the effective date of SFAS 157 for nonfinancial assets and nonfinancial liabilities, except those that are recognized or disclosed on a recurring basis, to fiscal years beginning after November 15, 2008. SFAS 157 establishes a framework for measuring fair value and requires expanded disclosure about the information used to measure fair value. SFAS 157 clarifies that fair value is an exit price, representing the amount that would be received to sell an asset or paid to transfer a liability in an orderly transaction between market participants. As such, fair value is a market-based measurement that should be determined based on assumptions that market participants would use in pricing an asset or liability. As a basis for considering such assumptions, SFAS 157 establishes a three-tier value hierarchy, which prioritizes the inputs used in measuring fair value. Our partial adoption of SFAS 157 did not have a material effect on our consolidated financial position, results of operations or cash flows nor do we anticipate further adoption of the provision for nonfinancial assets and liabilities to have a material impact on our consolidated financial position, results of operations or cash flows. See Note 5 for additional information.
In December 2007, the FASB issued SFAS No. 141 (revised 2007), Business Combinations ("SFAS 141R"), which replaces SFAS 141. SFAS 141R establishes principles and requirements for how an acquirer recognizes and measures in its financial statements the identifiable assets acquired, the liabilities assumed, any resulting goodwill, and any non-controlling interest in the acquiree. SFAS 141R also provides for disclosures to enable users of the financial statements to evaluate the nature and financial effects of the business combination. SFAS 141R is effective for fiscal years beginning after December 15, 2008. We will adopt SFAS 141R beginning in the first fiscal quarter of 2009, which will be applied prospectively to business combinations completed on or after that date. For acquisitions completed prior to December 27, 2008, the new standard requires that changes in deferred tax asset valuation allowances and acquired income tax uncertainties after the measurement period must be recognized in earnings rather than as an adjustment to the cost of the acquisition. We do not expect this new guidance to have a significant impact on our consolidated financial statements.
In April 2008, the FASB issued FSP No. 142-3, Determination of the Useful Life of Intangible Assets. This FSP amends the factors that should be considered in developing renewal or extension assumptions used to determine the useful life of a recognized intangible asset under SFAS No. 142, Goodwill and Other Intangible Assets. The FSP is effective for fiscal years beginning after December 15, 2008 and early adoption is prohibited. The adoption of FSP 142-3 will not have a material effect on our consolidated financial position, results of operations or cash flows.
NOTE 2: BUSINESS COMBINATIONS
We account for acquired businesses using the purchase method of accounting. Under the purchase method, our consolidated financial statements reflect an acquired business starting from the completion of the acquisition. In addition, the assets acquired and liabilities assumed were recorded at the date of acquisition at their respective estimated fair values, with any excess of the purchase price over the estimated fair values of the net assets acquired recorded as goodwill. The following summarizes our acquisition activity since the beginning of 2006:
See Note 7 related to goodwill and intangible asset impairment.
Page -42
NOTE 3: MARKETABLE SECURITIES
Management determines the appropriate classification, pursuant to SFAS No. 115, Accounting for Certain Investments in Debt and Equity Securities, of our investments in debt and equity securities ("Marketable Securities") at the time of purchase and re-evaluates such determination at each balance sheet date. Marketable Securities consist of revenue bonds and other municipal obligations, which usually have maturities or reset dates of one year or less. We did not hold any marketable securities at the end of 2008. At the end of 2007, those securities were classified as available-for-sale and stated at fair value, with the unrealized holding gains and losses reported as a component of Accumulated other comprehensive income in the Shareholders' equity section of our Consolidated Balance Sheets. There were no material unrealized holding gains or losses at December 26, 2008 or December 28, 2007. The specific identification method is used for computing realized gains and losses on the sale of available-for-sale securities. For the fiscal years 2008, 2007 and 2006, there were no material realized gains and losses on sales of available-for-sale securities.
NOTE 4: RESTRICTED CASH
Restricted cash consists primarily of cash held by our insurance carrier as collateral for our workers' compensation program. We have agreements with certain financial institutions through our wholly-owned and consolidated subsidiary, Workers' Assurance of Hawaii, Inc. (our "Workers' Assurance Program"), that allow us to restrict cash for the purpose of providing cash-backed instruments for our workers' compensation collateral. These instruments include cash-backed letters of credit, cash held in trusts and cash deposits held by our insurance carriers. Committed collateral represents instruments that have been provided or pledged to an insurance company for either the direct payment of claims, or to cover the cost of claims in the event we are unable to make payment. The majority of our collateral is held by AIG Commercial Insurance ("AIGCI"), a subsidiary of American International Group, Inc. ("AIG").
The following is a summary of restricted cash (in millions):
| |
December 26, 2008 |
December 28, 2007 |
|||||
|---|---|---|---|---|---|---|---|
Workers' Assurance Program-committed collateral |
$ | 114.6 | $ | 126.4 | |||
Cash collateralizing surety bonds and deposits-committed collateral |
3.8 | 5.1 | |||||
Other |
1.9 | 1.0 | |||||
Total Restricted Cash |
$ | 120.3 | $ | 132.5 | |||
NOTE 5: FAIR VALUE MEASUREMENT
Effective December 29, 2007, we adopted the required portion of SFAS 157. Our partial adoption is in accordance with FSP 157-2, which allows for the delay of the effective date of SFAS 157 for nonfinancial assets and nonfinancial liabilities.
SFAS 157 requires certain disclosures regarding fair value based on the inputs used to measure fair value. The following is a list of the defined levels in the fair value hierarchy based on the data and/or methods used to determine fair value:
Our cash equivalents and investment instruments are classified within Level 1 of the fair value hierarchy. Our Level 1 investments are valued using quoted market prices in active markets. As of December 26, 2008, our Level 1 investments consisted of money market accounts totaling $55.2 million and were recorded as Cash and cash equivalents in our Consolidated Balance Sheets. We held no Level 2 or Level 3 investments as of December 26, 2008.
NOTE 6: WORKERS' COMPENSATION INSURANCE AND RESERVES
We provide workers' compensation insurance for our temporary and permanent employees. While we have primary responsibility for all claims, our insurance coverage provides reimbursement for certain losses and expenses beyond our deductible limits. Our workers' compensation insurance policies are renewed annually. We had coverage with various insurance subsidiaries of AIGCI for occurrences during the period from July 2007 to July 2008 and renewed our coverage with AIGCI effective July 2008 to July 2009. For workers' compensation claims originating in states where we are self-insured, the majority of our current workers' compensation insurance policies cover any claims for a particular event
Page -43
above a $2.0 million deductible limit, on a "per occurrence" basis. This results in our being substantially self-insured. Furthermore, we have full liability for all further payments on claims which originated between January 2001 and June 2003, without recourse to any third party insurer as the result of a novation agreement we entered into with Kemper Insurance Company in December 2004.
Our workers' compensation reserve is discounted to its estimated net present value using discount rates based on average returns of "risk-free" U.S. Treasury instruments, which are evaluated on a quarterly basis. At December 26, 2008, our reserves are discounted at rates ranging from 3.29% to 4.74%. Included in the accompanying Consolidated Balance Sheets as of December 26, 2008 and December 28, 2007 are discounted workers' compensation claims reserves in the amounts of $203.6 million and $197.4 million, respectively.
For workers' compensation claims originating in Washington, North Dakota, Ohio, Wyoming, Canada and Puerto Rico (our "monopolistic jurisdictions") we pay workers' compensation insurance premiums and obtain full coverage under government-administered programs (with the exception of our Labor Ready brand in the state of Ohio where we have a self-insured policy). Accordingly, because we are not the primary obligor, our financial statements do not reflect the liability for workers' compensation claims in these monopolistic jurisdictions. As of July 1, 2008 we have a self-insured policy in the state of West Virginia. Claims originating in the state of West Virginia prior to July 1, 2008 are covered under the government-administered programs.
Our workers' compensation reserves include not only estimated expenses for claims within our self-insured layer but also estimated expenses related to claims above our self-insured limits ("excess claims"). We record an estimated receivable for the insurance coverage on excess claims based on the contractual policy agreements we have with insurance companies. We discount this receivable to its estimated net present value using the risk-free rates associated with the weighted average lives of our excess claims. The weighted average claim lives are actuarially determined. When appropriate, based on our best estimate, we record a valuation allowance against the insurance receivable to reflect amounts that may not be realized. The Troubled Insurance Companies have failed to pay a number of excess claims to date. These excess claims have been presented to the state guaranty funds of the states in which the claims originated. Certain of these excess claims have been rejected by the state guaranty funds due to statutory eligibility limitations. Our valuation allowance against receivables from Troubled Insurance Companies as of December 26, 2008 and December 28, 2007 is $6.9 million and $7.1 million, respectively. Total discounted receivables from insurance companies, net of related valuation allowance, as of December 26, 2008 and December 28, 2007 are $17.0 million and $14.9 million, respectively and are included in Other assets, net in the accompanying Consolidated Balance Sheets.
Workers' compensation expense is recorded as part of our cost of services and consists of the following components: self-insurance reserves net of changes in discount, monopolistic jurisdictions premiums, insurance premiums, any changes in the valuation allowance related to receivables from insurance companies as described above and other miscellaneous expenses. Workers' compensation expense of $56.2 million, $65.3 million and $76.1 million was recorded for 2008, 2007 and 2006 respectively.
NOTE 7: GOODWILL AND INTANGIBLE ASSETS
We test goodwill and indefinite-lived intangible assets for impairment annually and whenever events or circumstances arise that indicate an impairment may exist such as a significant adverse change in the business climate. Our annual impairment test is performed during the fourth fiscal quarter. Our annual impairment test did not indicate an impairment of our goodwill and indefinite-lived intangible assets. However, in the fourth quarter of 2008, we experienced a significant decline in our stock price. As a result of the decline in stock price, our market capitalization fell significantly below the recorded value of our consolidated net assets. The reduced market capitalization reflected, in part, the current economic climate as well as expected continued weakness in pricing and demand for our temporary staffing services. Further, the decline in demand for our services accelerated in the fourth quarter. Revenue for the quarter decreased by 14.7% compared to the same quarter a year ago. The 14.7% revenue decline consisted of growth from acquisitions completed within the last 12 months of 12.8%, offset by a decline in organic revenue of 27.5%. On a monthly same branch basis, the year over year decline dropped from 19.8% in October to 29.0% in December. This decline was not isolated to a particular brand or market. The decline in revenue and the corresponding decline in operating results as well as expected continued weakness in pricing and demand for our temporary staffing services is expected to continue during the current recession. Accordingly, we performed an interim assessment of goodwill for impairment. Statement of Financial Accounting Standards No. 142, Goodwill and Other Intangible Assets ("SFAS 142"), requires that goodwill be tested for impairment at a reporting unit level. We have determined that our reporting units are our brands based on our organizational structure
Page -44
and the financial information that is provided to and reviewed by management. As a result of this analysis, we concluded that the carrying amounts of goodwill for the CLP Resources (which includes SSC), Spartan Staffing (which includes PMI) and TLC reporting units exceeded their implied fair values and we recorded non-cash impairment losses of $46 million, which is included in Goodwill and intangible asset impairment on TrueBlue's Consolidated Statements of Operations. Our assessment of goodwill impairment indicated that as of December 26, 2008, the fair value of the Labor Ready and PlaneTechs reporting units exceeded its carrying value and therefore goodwill was not impaired.
SFAS No. 144, Accounting for the Impairment or Disposal of Long-Lived Assets, requires that long-lived assets, including amortizable intangible assets, be reviewed for impairment whenever events and circumstances indicate the carrying value may not be recoverable. As a result of the indicators discussed above, we tested our amortizable intangible assets for impairment and determined that certain intangible assets associated with the CLP Resources (which includes SSC), Spartan Staffing (which includes PMI) and TLC asset groups, primarily customer relationships, were impaired mainly due to the revised lower revenue and profit forecasts associated with those customer relationships acquired with the acquisitions of CLP, Spartan Staffing and TLC. We measured the amount of impairment by calculating the amount by which the carrying value of these assets exceeded their estimated fair values, which were based on projected undiscounted future net cash flows. As a result of this review, we recorded non-cash impairment losses totaling $15 million prior to our SFAS 142 impairment test. The non-cash impairment loss is included in Goodwill and intangible asset impairment on TrueBlue's Consolidated Statements of Operations.
Intangible assets other than Goodwill are broken out separately on our Consolidated Balance Sheets for 2008 and 2007. The following table presents our purchased intangible assets other than Goodwill (in millions):
| |
December 26, 2008 | December 28, 2007 | ||||||||||||||||||
|---|---|---|---|---|---|---|---|---|---|---|---|---|---|---|---|---|---|---|---|---|
| |
Gross Carrying Amount |
Accumulated Amortization |
Impairment Adjustment |
Net Carrying Amount |
Gross Carrying Amount |
Net Carrying Amount |
||||||||||||||
Amortizable intangible assets (1): |
||||||||||||||||||||
Customer relationships |
$ | 39.9 | $ | (10.5 | ) | $ | (13.6 | ) | $ | 15.8 | $ | 35.3 | $ | 30.1 | ||||||
Trade name/trademarks |
3.5 | (0.5 | ) | – | 3.0 | 3.2 | 3.0 | |||||||||||||
Non-compete agreements |
3.3 | (1.0 | ) | (0.5 | ) | 1.8 | 1.3 | 1.1 | ||||||||||||
|
$ | 46.7 | $ | (12.0 | ) | $ | (14.1 | ) | $ | 20.6 | $ | 39.8 | $ | 34.2 | ||||||
Indefinite-lived intangible assets: |
||||||||||||||||||||
Trade name/trademarks |
$ | 6.6 | – | $ | (0.8 | ) | $ | 5.8 | $ | 6.5 | $ | 6.5 | ||||||||
Intangible assets other than goodwill recorded in 2008 as a result of the TLC acquisition totaled $2.8 million and as a result of the PMI acquisition totaled $4.7 million. Intangible assets other than goodwill recorded in 2007 as a result of the PlaneTechs acquisition totaled $21.8 million and as a result of the SSC acquisition totaled $7.7 million. Intangible assets are amortized using the straight line method over their estimated useful lives. We evaluate the recoverability of intangible assets periodically and take into account events or circumstances that warrant revised estimates of useful lives or that indicate that impairment exists. The following are the estimated lives used for amortizable intangible assets:
Amortization expense related to our amortizable intangible assets was $7.0 million, $3.2 million and $2.5 million for 2008, 2007 and 2006, respectively. All amortizable intangible assets pertaining to the 2004 Spartan Staffing acquisition were fully amortized at the end of 2006.
Page -45
The following table provides estimated amortization expense of intangible assets other than Goodwill for the next five years and thereafter (in millions):
2009 |
$ | 2.9 | ||
2010 |
2.9 | |||
2011 |
2.8 | |||
2012 |
2.7 | |||
2013 |
2.3 | |||
Thereafter |
7.0 | |||
|
$ | 20.6 | ||
NOTE 8: PREFERRED STOCK
We have authorized 20,000,000 shares of blank check preferred stock. The blank check preferred stock is issuable in one or more series, each with such designations, preferences, rights, qualifications, limitations and restrictions as our Board of Directors may determine and set forth in supplemental resolutions at the time of issuance, without further shareholder action.
The initial series of blank check preferred stock authorized by the Board of Directors was designated as Series A Preferred Stock. We had no outstanding shares of preferred stock in any of the years presented.
NOTE 9: COMMON STOCK
Under our authorized share purchase program, we purchased and retired 1.2 million shares of our common stock for a total amount of $16.0 million during 2008, including commissions. As of December 26, 2008 we had $21.5 million worth of our common stock available to us for future purchases under the current authorization. During 2007 we purchased 7.6 million shares at a total cost of $150.3 million, including commissions. During 2006 we purchased 4.2 million shares at a total cost of $88.7 million, including commissions.
NOTE 10: INCOME TAXES
The provision for income taxes is comprised of the following (in millions):
| |
2008 | 2007 | 2006 | ||||||||
|---|---|---|---|---|---|---|---|---|---|---|---|
Current taxes: |
|||||||||||
Federal |
$ | 8.1 | $ | 37.4 | $ | 39.5 | |||||
State |
0.3 | 8.3 | 2.9 | ||||||||
Foreign |
1.0 | 0.9 | 0.4 | ||||||||
Total current taxes |
9.4 |
46.6 |
42.8 |
||||||||
Deferred taxes: |
|||||||||||
Federal |
3.6 | (6.2) | (3.5) | ||||||||
State |
(0.8) | (2.1) | (0.2) | ||||||||
Foreign |
0.1 | 0.1 | 0.6 | ||||||||
Total deferred taxes |
2.9 |
(8.2) |
(3.1) |
||||||||
Provision for income taxes |
$ |
12.3 |
$ |
38.4 |
$ |
39.7 |
|||||
Page -46
The items accounting for the difference between income taxes computed at the statutory federal income tax rate and income taxes reported in the consolidated statements of operations are as follows (in millions):
| |
2008 | % | 2007 | % | 2006 | % | ||||||||||
|---|---|---|---|---|---|---|---|---|---|---|---|---|---|---|---|---|
Income tax expense based on statutory rate |
$ | 2.8 | 35% | $ | 36.6 | 35% | $ | 40.7 | 35% | |||||||
Increase (decrease) resulting from: |
||||||||||||||||
Goodwill and intangible asset impairment |
11.5 | 141% | – | – | – | – | ||||||||||
State income taxes, net of federal benefit |
0.8 | 10% | 3.1 | 3% | 3.7 | 3% | ||||||||||
Tax credits, net |
(2.8) | (35%) | (2.9) | (3%) | (3.1) | (3%) | ||||||||||
Other, net |
– | – | 1.6 | 2% | (1.6) | (1%) | ||||||||||
Total taxes on income |
$ | 12.3 | 151% | $ | 38.4 | 37% | $ | 39.7 | 34% | |||||||
Our effective income tax rate was 151% in 2008. The results of operations include a goodwill and intangible asset impairment charge of $61 million. The principal difference between the statutory federal income tax rate of 35% and our effective income tax rate results from the goodwill and intangible asset impairment charge that was only partially deductible for tax purposes, state income taxes, federal tax credits, tax exempt interest income, and certain non-deductible expenses. Our 2006 effective tax rate was lower than 2008 and 2007 rates due to the retroactive renewal of certain tax credits and favorable resolution of other income tax matters during the fourth quarter of 2006.
The components of deferred tax assets and liabilities were as follows (in millions):
| |
December 26, 2008 |
December 28, 2007 |
|||||
|---|---|---|---|---|---|---|---|
Deferred tax assets: |
|||||||
Allowance for doubtful accounts |
$ | 2.1 | $ | 2.2 | |||
Workers' compensation claims reserve |
11.5 | 13.9 | |||||
Accounts payable and other accrued expenses |
3.3 | 3.8 | |||||
Net operating loss carry-forwards |
0.5 | 14.5 | |||||
Accrued wages and benefits |
3.2 | 3.4 | |||||
Foreign currency translation adjustment |
0.4 | – | |||||
Other |
0.2 | 0.2 | |||||
Total |
21.2 | 38.0 | |||||
Valuation allowance for net operating loss carry-forwards |
(0.5) | (14.5) | |||||
Total deferred tax asset, net of valuation allowance |
$ | 20.7 | $ | 23.5 | |||
Deferred tax liabilities: |
|||||||
Prepaid expenses, deposits and other current assets |
$ | (1.0) | $ | (1.0) | |||
Depreciation and amortization |
(0.9) | (3.4) | |||||
Foreign currency translation adjustment |
– | (1.5) | |||||
Other |
(1.2) | (0.1) | |||||
Total deferred tax liabilities |
$ | (3.1) | $ | (6.0) | |||
Net deferred tax asset, end of year |
$ | 17.6 | $ | 17.5 | |||
Net deferred tax asset, current |
4.8 | 7.5 | |||||
Net deferred tax asset, non-current |
$ | 12.8 | $ | 10.0 | |||
At December 26, 2008, Labor Ready Puerto Rico, Inc. has net operating loss carry-forwards of approximately $1.4 million expiring in 2010 through 2015. A valuation allowance has been established against our carry-forward tax benefits based on our history of past losses.
We adopted the provisions of FIN 48 on December 30, 2006, the first day of our 2007 fiscal year. At adoption our liability for unrecognized tax benefits was $1.9 million. Our policy is to include interest and penalties related to unrecognized tax
Page -47
benefits in income tax expense. As of December 26, 2008 our liability for unrecognized tax benefits was $1.9 million, all of which, if recognized, would impact our effective tax rate. This liability is recorded in other current liabilities in our Consolidated Balance Sheet. In general, the tax years 2004 through 2007 remain open to examination by the major taxing jurisdictions where we conduct business.
The aggregate changes in the balance of unrecognized tax benefits were as follows (in millions):
Balance, beginning of year |
$ | 4.4 | ||
Decreases related to settlements |
(3.1) | |||
Increases for tax positions related to the current year |
0.9 | |||
Increases for tax positions related to prior years |
0.1 | |||
Decreases for tax positions related to prior years |
– | |||
Reductions due to lapsed statute of limitations |
(0.4) | |||
Balance, end of year |
$ | 1.9 | ||
NOTE 11: NET INCOME PER SHARE
Basic net income per share is calculated by dividing net income by the weighted average number of common shares outstanding during the period. Diluted net income per share is calculated by dividing adjusted net income by the weighted average number of common shares and potential common shares outstanding during the period. Potential common shares include the dilutive effects of outstanding options and non-vested restricted stock except where their inclusion would be anti-dilutive.
Anti-dilutive shares associated with our stock options relate to those stock options with a grant price higher than the average market value of our stock during the periods presented. Anti-dilutive shares also include in-the-money options for which the sum of the assumed proceeds, including unrecognized compensation expense, exceeds the average stock price during the periods presented. The weighted average number of anti-dilutive stock options and non-vested restricted stock not considered as part of our diluted net income per share calculation was 1.4 million in 2008, 0.7 million in 2007, and 0.4 million in 2006.
Adjusted net income and diluted common shares were calculated as follows (in thousands except per share amounts):
| |
2008 | 2007 | 2006 | |||||||
|---|---|---|---|---|---|---|---|---|---|---|
Net income (loss) |
$ | (4,159) | $ | 66,198 | $ | 76,472 | ||||
Weighted average number of common shares used in basic net income per common share |
42,885 | 45,683 | 52,418 | |||||||
Dilutive effect of outstanding stock options and non-vested restricted stock |
188 | 277 | 435 | |||||||
Weighted average number of common shares used in diluted net income per common share |
43,073 | 45,960 | 52,853 | |||||||
Net income (loss) per common share: |
||||||||||
Basic |
$ | (0.10) | $ | 1.45 | $ | 1.46 | ||||
Diluted |
$ | (0.10) | $ | 1.44 | $ | 1.45 | ||||
NOTE 12: COMMITMENTS AND CONTINGENCIES
Revolving credit facility
On April 15, 2008, we entered into an Amended and Restated Credit Agreement (the "Amended and Restated Credit Agreement") with Wells Fargo Bank and Bank of America, which amended and restated the previous revolving credit facility. The Amended and Restated Credit Agreement extended the term of the revolving credit facility from November 2008 to April 2011. The Amended and Restated Credit Agreement provides capacity for the lesser of $80 million, or 2.50 times EBITDA as defined by the Amended and Restated Credit Agreement ("Bank EBITDA"). The Bank EBITDA has, among other things, additional items added back to net income including the non-cash expenses related to stock options and restricted stock. In addition, we may request (in no more than three instances) that the Amended and Restated Credit Agreement be increased from $80 million up to $160 million in the aggregate, subject to bank approval. In light of current credit market conditions, this additional availability would be difficult to obtain, or might not be available under
Page -48
commercially reasonable terms, or at all. Except as set forth above, the Amended and Restated Credit Agreement did not materially change the terms of the previous revolving credit facility. The Amended and Restated Credit Agreement, which is secured by substantially all our assets except our real estate, provides us with access to loan advances and letters of credit. At December 26, 2008, we had $52.9 million of letters of credit issued against the borrowing capacity leaving us with $27.1 million available for future borrowings.
Under the terms of the Amended and Restated Credit Agreement, we pay a variable rate of interest based on a margin above LIBOR for borrowings and a variable unused commitment fee, both based on a ratio of consolidated total debt to consolidated Bank EBITDA (the "Consolidated Leverage Ratio"). The bank definition of consolidated total debt includes outstanding letters of credit under the Amended and Restated Credit Agreement. Fees for letters of credit are based on the margin in effect plus a fee of 0.05%. As of December 26, 2008, our margin was 0.50% and our unused capacity fee was 0.125%.
The Amended and Restated Credit Agreement requires that we comply with certain financial covenants. Among other things, these covenants require us to stay below a maximum Consolidated Leverage Ratio, and to stay above a minimum Fixed Charge Coverage Ratio ("Fixed Charge Coverage Ratio"). The Fixed Charge Coverage Ratio is calculated by dividing an adjusted EBITDA by fixed charges. Adjusted EBITDA is calculated by removing items such as income tax expense, stock repurchases, capital expenditures, and other items from the bank definition of EBITDA. Fixed charges are items like interest expense, letter of credit fees, principal payments, and other items. We are currently in compliance with all covenants set forth in the Amended and Restated Credit Agreement.
Workers' compensation commitments
We are required by our insurance carriers and certain state workers' compensation programs to collateralize a portion of our workers' compensation obligation with cash and cash-backed instruments, irrevocable letters of credit, or surety bonds. The letters of credit issued against the Revolving Credit Facility bear fluctuating annual fees of approximately 0.55% of the principal amount of the letters of credit outstanding as of December 26, 2008. The letters of credit issued related to our Workers' Assurance Program bear fluctuating annual fees of approximately 0.58% of the principal amount of the letters of credit outstanding as of December 26, 2008. The surety bonds bear annual fees based on a percentage of the bond, which are determined by each independent surety carrier but do not exceed 2.0% of the bond amount, subject to a minimum charge.
At December 26, 2008 and December 28, 2007 we had provided our insurance carriers and certain states with commitments in the form and amounts outlined below (in millions):
December 26, 2008 |
December 28, 2007 |
|||||||
|---|---|---|---|---|---|---|---|---|
Workers' Assurance Program – committed collateral (1) |
$ | 114.6 | $ | 126.4 | ||||
Letters of credit |
52.9 | 34.5 | ||||||
Surety bonds (2) |
17.1 | 17.2 | ||||||
Other cash-backed instruments |
1.1 | 1.2 | ||||||
Total Collateral Commitments |
$ | 185.7 | $ | 179.3 | ||||
Capital leases
We have property held under non-cancelable capital leases reported in Property and equipment, net on the Consolidated Balance Sheets totaling $1.0 million and $0.3 million, net of accumulated depreciation at December 26, 2008 and December 28, 2007, respectively. Our capital lease obligations are reported in other current and non-current liabilities in the Consolidated Balance Sheet. Future minimum lease payments under these non-cancelable capital leases as of December 26, 2008 are $0.4 million for 2009, 2010 and 2011, respectively.
Page -49
Operating leases
We have contractual commitments in the form of operating leases related to branch offices, vehicles and equipment. Future non-cancelable minimum lease payments under our operating lease commitments as of December 26, 2008 are as follows for each of the next five years and thereafter (in millions):
2009 |
$ | 6.0 | ||
2010 |
4.6 | |||
2011 |
3.2 | |||
2012 |
2.3 | |||
2013 |
0.9 | |||
Thereafter |
0.4 | |||
Total |
$ | 17.4 | ||
The majority of operating leases pertaining to our branch offices provide for renewal options ranging from three to five years. Operating leases are generally renewed in the normal course of business, and most of the options are negotiated at the time of renewal. However, for the majority of our leases, both parties to the lease have the right to cancel the lease with 90 days notice. Accordingly, we have not included the leases with 90 day cancellation provisions in our disclosure of future minimum lease payments. Total branch office rent expense for 2008, 2007 and 2006 was approximately $29.0 million, $28.5 million and $25.2 million, respectively.
Legal contingencies and developments
From time to time we are subject to compliance audits by federal, state and local authorities relating to a variety of regulations including wage and hour laws, taxes, workers' compensation, immigration and safety. From time to time we are also subject to legal proceedings in the ordinary course of our operations. A summary of our most significant pending litigation and regulatory proceedings is set forth below. It is not possible at this time for us to determine fully the effect of all legal proceedings on our consolidated financial position, results of operations or liquidity; however, to the extent possible, where legal liabilities can be reasonably estimated and are considered probable, we have recorded a liability. To the extent that an insurance company is contractually obligated to reimburse us for a liability, we record a receivable for the amount of the probable reimbursement. We have established reserves for our contingent legal and regulatory liabilities in the amount of $4.3 million at December 26, 2008 and $4.8 million at December 28, 2007. We believe that none of the currently pending legal proceedings, individually or in the aggregate, will have a material adverse impact on our financial position, results of operations or cash flows beyond amounts that have been accrued in the financial statements, although we can make no assurances in this regard.
On January 12, 2005, the New Jersey Division of Taxation (the "Division") filed a Notice of Assessment Related to Final Audit Determination asserting that we owe $7.0 million for delinquent sales taxes, penalties and interest for the period October 1, 2000 through September 30, 2004. The amount of the assessment is based on the Division's assertion that 100% of our revenue from New Jersey operations is subject to sales tax. We disputed the Division's position that we provide taxable services under New Jersey law and filed an administrative protest. The administrative protest was handled internally by the Division and did not involve any outside or independent governmental bodies. On September 19, 2006, the Division issued a final determination on our administrative protest increasing the amount that we allegedly owe for delinquent sales taxes, penalties and interest to $8.1 million. Interest continues to accrue on this amount. We have sought independent review of this determination by filing a complaint with the Tax Court of New Jersey on December 15, 2006. On September 17, 2008, the Court heard our motion for summary judgment, as well as a cross-motion for summary judgment by the Division, and ordered the parties to conduct additional discovery.
On July 16, 2003, Alecia Recio, Elizabeth Esquivel, Debbie Owen and Barry Selbts, each a current or former employee of ours, jointly filed an action in United States District Court for the Central District of California, alleging failure to pay overtime under state and federal law and seeking unspecified damages and certification of a class of similarly situated employees (this matter now includes the claims of Scott Romer and Shawna Clark previously pursued in a separate action). On September 23, 2003, the court dismissed the case for improper venue. On October 1, 2003, Recio re-filed her case in California State Court, Los Angeles County, seeking similar relief on behalf of our employees employed in the State of California. The case went to mediation on September 27, 2007 and on October 12, 2007. Subsequently, the parties entered into a settlement which resolved all claims. The settlement received final approval from the court on September 22, 2008. All amounts related to the settlement are accounted for in our established reserves for our contingent legal and regulatory liabilities.
Page -50
On August 2, 2002, a New York State Department of Labor audit of a single Labor Ready branch located in New York resulted in an administrative finding that the CDM fees collected at that branch violated New York labor laws. We appealed this administrative finding to the New York Board of Industrial Appeals, which overruled the Department of Labor and issued a unanimous finding that CDM fees did not violate New York wage payment laws. On October 24, 2005, the New York Appellate Division reversed the decision of the Board of Industrial Appeals. We appealed this decision and on November 16, 2006, the Court of Appeals affirmed the decision of the Appellate Division. Thereafter, we promptly shut down the CDMs in the State of New York. Recently, the New York Attorney General ("NYAG") has threatened to file a lawsuit against us seeking restitution for fees collected at all of our New York branches for a six-year period. The total claimed restitution is $1.6 million. In addition to this amount, the NYAG is also seeking interest and penalties.
NOTE 13: STOCK BASED COMPENSATION
We account for stock-based compensation in accordance with the provisions of SFAS No. 123 (Revised), Share-Based Payment ("SFAS 123R"), using the modified-prospective transition method. Compensation cost for all stock-based awards is recognized using the straight-line method. Total stock-based compensation expense recognized in the consolidated financial statements before income taxes was $7.7 million for 2008, $6.9 million for 2007 and $6.4 million for 2006. The total related tax benefit was $2.7 million for 2008, $2.5 million for 2007 and $2.3 million for 2006. No stock-based compensation was capitalized during 2008, 2007 or 2006.
Stock options
We have stock option and incentive plans for directors, officers, and employees, which provide for nonqualified stock options and incentive stock options. We issue new shares of common stock upon exercise of stock options. The majority of our unvested stock options "cliff vest" in three years from the date of grant and expire if not exercised within seven years from the date of grant. The maximum contractual term for our outstanding awards is ten years.
Determination of Fair Value under SFAS 123R
Valuation and amortization method. We estimate the fair value of stock-based awards granted using the Black-Scholes option valuation model. We amortize the fair value of all awards on a straight-line basis over the requisite service periods, which are generally the vesting periods.
Expected life. The expected life of awards granted represents the period of time that they are expected to be outstanding. We take several factors into account when determining expected life including contractual terms, vesting schedules, expected exercises as well as our historical experience with similar awards.
Expected volatility. We estimate the volatility of our common stock at the date of grant based on historical volatility of our common stock. Our volatility is based on our historical stock prices over the most recent period commensurate with the estimated expected life of the award.
Risk-free interest rate. We base the risk-free interest rate used in the Black-Scholes option valuation model on the yield at the time of grant on U.S. Treasury zero-coupon issues with an equivalent remaining term equal to the expected life of the award.
Expected dividend yield. No cash dividends have been declared on our common stock to date nor have any decisions been made to pay a dividend in the future. As a result, our expected dividend yield is zero in our option valuation model.
Expected forfeitures. We consider our historical data in our estimate of pre-vesting option forfeitures. We record stock-based compensation only for those awards that are expected to vest.
Page -51
A summary of the weighted average assumptions and results for options granted during the periods presented is as follows:
| |
2008 | 2007 | 2006 | |
|||||||
|---|---|---|---|---|---|---|---|---|---|---|---|
Expected life (in years) |
3.48 | 3.48 | 3.48 | ||||||||
Expected volatility |
43.5% | 40.5% | 43.5% | ||||||||
Risk-free interest rate |
2.2% | 4.9% | 4.3% | ||||||||
Expected dividend yield |
0.0% | 0.0% | 0.0% | ||||||||
Weighted average fair value of options granted during the period |
$ | 5.07 | $ | 6.74 | $ | 7.80 | |||||
Stock option activity for the year ended December 26, 2008 is as follows (shares in thousands):
| |
|
|||||||
|---|---|---|---|---|---|---|---|---|
| |
2008 | |
||||||
| |
Shares | Price (1) | |
|||||
Outstanding at beginning of the year |
1,025 | $ | 16.88 | |||||
Granted |
239 | $ | 14.85 | |||||
Exercised |
(226 | ) | $ | 11.69 | ||||
Forfeited |
(87 | ) | $ | 17.83 | ||||
Expired |
(45 | ) | $ | 15.29 | ||||
Outstanding at the end of the year |
906 | $ | 17.60 | |||||
Exercisable at the end of the year |
432 | $ | 17.89 | |||||
As of December 26, 2008, total unrecognized stock-based compensation expense related to non-vested stock options was approximately $1.4 million, which is expected to be recognized over a weighted average period of 1.7 years through 2012.
The aggregate intrinsic value of options outstanding and options exercisable at December 26, 2008 was $0.06 million and $0.06 million, respectively, and is calculated as the difference between the market price of the underlying common stock at December 26, 2008 and the exercise price of the option for options that had exercise prices lower than the closing market price of our common stock at December 26, 2008. The total intrinsic value of options exercised during 2008, 2007 and 2006 was $0.6 million, $4.6 million and $11.7 million, respectively, determined as of the date of exercise. The weighted average remaining contractual term of options outstanding and options exercisable at December 26, 2008 was 4.3 years and 3.2 years, respectively.
Cash received from option exercises, net of tax withholdings, during 2008, 2007 and 2006 was $2.1 million, $4.3 million and $5.0 million, respectively. The actual tax benefit realized for the tax deduction from option exercises during the 2008, 2007 and 2006 totaled $1.3 million, $2.8 million and $3.7 million, respectively.
Restricted stock
Restricted stock is granted to directors, officers, and key employees and vests over periods ranging from three to four years. Compensation cost of restricted stock is calculated based on the grant-date market value. We recognize compensation cost on a straight line basis over the vesting period for the awards that are expected to vest.
Page -52
Restricted stock activity for the year ended December 26, 2008 is as follows (shares in thousands):
| |
|
|||||||
|---|---|---|---|---|---|---|---|---|
| |
2008 | |
||||||
| |
Shares | Price (1) | |
|||||
Nonvested at beginning of the year |
663 | $ | 19.70 | |||||
Granted |
483 | $ | 14.39 | |||||
Vested |
(241 | ) | $ | 19.40 | ||||
Forfeited |
(121 | ) | $ | 18.53 | ||||
Nonvested at the end of the year |
784 | $ | 16.51 | |||||
As of December 26, 2008, total unrecognized stock-based compensation expense related to non-vested restricted stock was approximately $9.4 million, which is expected to be recognized over a weighted average period of 1.7 years through 2012. The total fair value of restricted shares vesting during 2008, 2007 and 2006 was $4.7 million, $3.1 million, and $2.6 million, respectively.
Employee stock purchase plan
Our Employee Stock Purchase Plan (the "ESPP") provides substantially all permanent employees who have completed six months of service and meet certain limited qualifications, an opportunity to purchase shares of our common stock through payroll deductions. The ESPP permits payroll deductions up to 10% of eligible after-tax compensation. Participant account balances are used to purchase shares of common stock at the lesser of 85% of the fair market value of shares on either the first day or the last day of each month. Under the ESPP, 1.9 million shares of common stock have been reserved for purchase, of which 1.6 million shares have been issued and 0.3 million shares remain available for future issuance. The ESPP expires on June 30, 2010. During 2008, 2007 and 2006, participants purchased 135,000, 88,000 and 89,000 shares in the ESPP for cash proceeds of $1.4 million, $1.4 million and $1.5 million, respectively.
We consider our ESPP to be compensatory under SFAS No. 123R and accordingly we recognize compensation expense over the requisite service period for stock purchases made under the plan. The requisite service period begins on the enrollment date and ends on the purchase date, the duration of which is one month.
NOTE 14: SECTION 401K PLAN
We have a defined contribution plan, which qualifies under Section 401(k) of the Internal Revenue Code ("IRC"). All permanent employees who are 21 years of age or older and who have completed six months of service are eligible to participate. Eligible employees may contribute up to 15% of compensation subject to certain limitations under the IRC. Employer matching contributions are contributed in cash at each payroll period. Matching contributions were $1.3 million, $0.9 million and $0.9 million for 2008, 2007, and 2006.
NOTE 15: SUPPLEMENTAL CASH FLOW INFORMATION
| |
|
|||||||||||
|---|---|---|---|---|---|---|---|---|---|---|---|---|
| |
2008 | 2007 | 2006 | |
||||||||
| |
(Amounts in Millions) |
|
||||||||||
Cash paid during the year for: |
||||||||||||
Interest |
$ | 0.6 | $ | 0.7 | $ | 0.6 | ||||||
Income taxes |
36.2 | 30.6 | 38.0 | |||||||||
Non-cash investing and financing activities: |
||||||||||||
Assets acquired with capital lease obligations |
$ | 1.1 | $ | – | $ | 0.3 | ||||||
Page -53
Report of Independent Registered Public Accounting Firm
To the Board of Directors and Shareholders of TrueBlue, Inc.
In our opinion, the accompanying consolidated balance sheets and the related consolidated statements of operations, of shareholders' equity and comprehensive income and of cash flows present fairly, in all material respects, the financial position of TrueBlue, Inc. and its subsidiaries at December 26, 2008 and December 28, 2007, and the results of their operations and their cash flows for each of the three years in the period ended December 26, 2008 in conformity with accounting principles generally accepted in the United States of America. In addition, in our opinion, the schedule of valuation and qualifying accounts appearing under Item 15 presents fairly, in all material respects, the information set forth therein when read in conjunction with the related consolidated financial statements. Also in our opinion, the Company maintained, in all material respects, effective internal control over financial reporting as of December 26, 2008, based on criteria established in Internal Control – Integrated Framework issued by the Committee of Sponsoring Organizations of the Treadway Commission (COSO). The Company's management is responsible for these financial statements and financial statement schedule, for maintaining effective internal control over financial reporting and for its assessment of the effectiveness of internal control over financial reporting, included in Management's Annual Report on Internal Control Over Financial Reporting appearing under Item 9A. Our responsibility is to express opinions on these financial statements, on the financial statement schedule, and on the Company's internal control over financial reporting based on our integrated audits. We conducted our audits in accordance with the standards of the Public Company Accounting Oversight Board (United States). Those standards require that we plan and perform the audits to obtain reasonable assurance about whether the financial statements are free of material misstatement and whether effective internal control over financial reporting was maintained in all material respects. Our audits of the financial statements included examining, on a test basis, evidence supporting the amounts and disclosures in the financial statements, assessing the accounting principles used and significant estimates made by management, and evaluating the overall financial statement presentation. Our audit of internal control over financial reporting included obtaining an understanding of internal control over financial reporting, assessing the risk that a material weakness exists, and testing and evaluating the design and operating effectiveness of internal control based on the assessed risk. Our audits also included performing such other procedures as we considered necessary in the circumstances. We believe that our audits provide a reasonable basis for our opinions.
As discussed in Notes 1 and 10 to the consolidated financial statements, the Company adopted the provisions of Interpretation No. 48, Accounting for Uncertainty in Income Taxes – an interpretation of FASB Statement No. 109, as of December 30, 2006.
A company's internal control over financial reporting is a process designed to provide reasonable assurance regarding the reliability of financial reporting and the preparation of financial statements for external purposes in accordance with generally accepted accounting principles. A company's internal control over financial reporting includes those policies and procedures that (i) pertain to the maintenance of records that, in reasonable detail, accurately and fairly reflect the transactions and dispositions of the assets of the company; (ii) provide reasonable assurance that transactions are recorded as necessary to permit preparation of financial statements in accordance with generally accepted accounting principles, and that receipts and expenditures of the company are being made only in accordance with authorizations of management and directors of the company; and (iii) provide reasonable assurance regarding prevention or timely detection of unauthorized acquisition, use, or disposition of the company's assets that could have a material effect on the financial statements.
Because of its inherent limitations, internal control over financial reporting may not prevent or detect misstatements. Also, projections of any evaluation of effectiveness to future periods are subject to the risk that controls may become inadequate because of changes in conditions, or that the degree of compliance with the policies or procedures may deteriorate.
As described in Management's Annual Report on Internal Control Over Financial Reporting, management has excluded Transportation Logistics Company, LLC and Personnel Management, Inc. from its assessment of internal control over financial reporting as of December 26, 2008 because they were acquired by the Company in purchase business combinations during 2008. We have also excluded Transportation Logistics Company, LLC and Personnel Management, Inc. from our audit of internal control over financial reporting. Transportation Logistics Company, LLC and Personnel Management, Inc. are wholly-owned subsidiaries whose total assets represent 1% and 2%, respectively, and whose total revenues represent 2% and 5%, respectively, of the related consolidated financial statement amounts as of and for the year ended December 26, 2008.
/s/
PricewaterhouseCoopers LLP
Seattle, Washington
February 18, 2009
Page -54
Selected Quarterly Financial Data (unaudited)
in Thousands (except per share data)
| |
First | Second | Third | Fourth | |||||||||
|---|---|---|---|---|---|---|---|---|---|---|---|---|---|
2008 |
|||||||||||||
Revenue from services |
$ | 324,016 | $ | 370,710 | $ | 387,914 | $ | 301,629 | |||||
Cost of services |
225,661 |
260,167 |
272,736 |
213,193 |
|||||||||
Gross profit |
98,355 | 110,543 | 115,178 | 88,436 | |||||||||
Selling, general and administrative expenses |
82,484 |
84,569 |
86,226 |
78,834 |
|||||||||
Goodwill and intangible asset impairment |
– | – | – | 61,000 | |||||||||
Depreciation and amortization |
3,908 | 3,967 | 3,988 | 4,911 | |||||||||
Income (loss) from operations |
11,963 | 22,007 | 24,964 | (56,309) | |||||||||
Interest expense |
(132) |
(251) |
(295) |
(125) |
|||||||||
Interest and other income |
2,028 | 1,875 | 1,344 | 1,086 | |||||||||
Interest and other income, net |
1,896 | 1,624 | 1,049 | 961 | |||||||||
Income (loss) before tax expense (benefit) |
13,859 |
23,631 |
26,013 |
(55,348) |
|||||||||
Income tax expense (benefit) |
5,058 |
6,903 |
9,678 |
(9,325) |
|||||||||
Net income (loss) |
$ |
8,801 |
$ |
16,728 |
$ |
16,335 |
$ |
(46,023) |
|||||
Net income (loss) per common share: |
|||||||||||||
Basic |
$ | 0.20 | $ | 0.39 | $ | 0.38 | $ | (1.08) | |||||
Diluted |
$ | 0.20 | $ | 0.39 | $ | 0.38 | $ | (1.08) | |||||
2007 |
|||||||||||||
Revenue from services |
$ | 290,237 | $ | 351,131 | $ | 390,672 | $ | 353,616 | |||||
Cost of services |
197,446 |
239,244 |
265,168 |
241,705 |
|||||||||
Gross profit |
92,791 | 111,887 | 125,504 | 111,911 | |||||||||
Selling, general and administrative expenses |
77,376 |
81,902 |
89,077 |
87,865 |
|||||||||
Depreciation and amortization |
2,401 | 2,858 | 3,402 | 3,562 | |||||||||
Income from operations |
13,014 | 27,127 | 33,025 | 20,484 | |||||||||
Interest expense |
(262) |
(424) |
(116) |
(163) |
|||||||||
Interest and other income |
3,544 | 2,862 | 2,620 | 2,892 | |||||||||
Interest and other income, net |
3,282 | 2,438 | 2,504 | 2,729 | |||||||||
Income before tax expenses |
16,296 | 29,565 | 35,529 | 23,213 | |||||||||
Income tax expense |
5,948 |
10,791 |
12,806 |
8,860 |
|||||||||
Net Income |
$ |
10,348 |
$ |
18,774 |
$ |
22,723 |
$ |
14,353 |
|||||
Net income per common share: |
|||||||||||||
Basic |
$ | 0.21 | $ | 0.41 | $ | 0.51 | $ | 0.33 | |||||
Diluted |
$ | 0.21 | $ | 0.41 | $ | 0.51 | $ | 0.33 | |||||
Page -55
Item 9. CHANGES IN AND DISAGREEMENTS WITH ACCOUNTANTS ON ACCOUNTING AND FINANCIAL DISCLOSURE
None.
Item 9A. CONTROLS AND PROCEDURES
Conclusion Regarding the Effectiveness of Disclosure Controls and Procedures. Under the supervision and with the participation of our management, including the Chief Executive Officer and Chief Financial Officer of the company, we have evaluated the effectiveness of our disclosure controls and procedures as required by Exchange Act Rule 13a-15(e) as of the end of the period covered by this report. Based on that evaluation, the Chief Executive Officer and Chief Financial Officer have concluded that these disclosure controls and procedures are effective.
Management's Annual Report on Internal Control Over Financial Reporting. Our management is responsible for establishing and maintaining adequate internal control over financial reporting for the company. Internal control over financial reporting is a process to provide reasonable assurance regarding the reliability of our financial reporting for external purposes in accordance with accounting principles generally accepted in the United States of America. Internal control over financial reporting includes maintaining records that in reasonable detail accurately and fairly reflect our transactions; providing reasonable assurance that transactions are recorded as necessary for preparation of our financial statements; providing reasonable assurance that receipts and expenditures of company assets are made in accordance with management authorization; and providing reasonable assurance that unauthorized acquisition, use, or disposition of company assets that could have a material effect on our financial statements would be prevented or detected on a timely basis. Because of its inherent limitations, internal control over financial reporting may not prevent or detect misstatements.
Management conducted an evaluation of the effectiveness of our internal control over financial reporting based on the framework in Internal Control – Integrated Framework issued by the Committee of Sponsoring Organizations of the Treadway Commission. Based on this evaluation, management concluded that the Company's internal control over financial reporting was effective as of December 26, 2008. The effectiveness of our internal control over financial reporting as of December 26, 2008 has been audited by PricewaterhouseCoopers LLP, an independent registered public accounting firm, as stated in their report which is included herein.
We excluded Transportation Logistics Company, LLC and Personnel Management, Inc from our assessment of internal control over financial reporting as of December 26, 2008 because these businesses were acquired during 2008. Transportation Logistics Company, LLC and Personnel Management, Inc are wholly-owned subsidiaries whose total assets represent 1% and 2%, respectively, and whose total revenues represent 2% and 5%, respectively, of the related consolidated financial statement amounts as of and for the year ended December 26, 2008.
Changes in Internal Control Over Financial Reporting. During the fourth quarter ended December 26, 2008, there were no changes in our internal control over financial reporting that have materially affected, or are reasonably likely to materially affect, our internal control over financial reporting.
None.
Page -56
Item 10. DIRECTORS, EXECUTIVE OFFICERS AND CORPORATE GOVERNANCE
Information regarding our directors and nominees for directorship is presented under the heading "Election of Directors" in our definitive proxy statement for use in connection with the 2009 Annual Meeting of Shareholders (the "Proxy Statement") to be filed within 120 days after our fiscal year ended December 26, 2008, and is incorporated herein by this reference thereto. Information concerning our executive officers is set forth under the heading "Executive Officers" in our Proxy Statement, and is incorporated herein by reference thereto. Information regarding compliance with Section 16(a) of the Exchange Act, our code of business conduct and ethics and certain information related to the Company's Audit Committee and Governance Committee is set forth under the heading "Corporate Governance" in our Proxy Statement, and is incorporated herein by reference thereto.
New York Stock Exchange Certification. The certification of the Chief Executive Officer required by the New York Stock Exchange Listing Standards, Section 303A.12(a), relating to TrueBlue's compliance with the New York Stock Exchange Corporate Governance Listing Standards, was submitted to the New York Stock Exchange on June 6, 2008.
In addition, the Company's CEO and CFO certifications required under Section 302 of the Sarbanes Oxley Act of 2002 are filed as exhibits to this Form 10-K.
Item 11. EXECUTIVE COMPENSATION
Information regarding the compensation of our directors and executive officers and certain information related to the Company's Compensation Committee is set forth under the headings "Executive Compensation," "Director Compensation," "Compensation Discussion and Analysis," "Compensation Committee Report" and "Compensation Committee Interlocks and Insider Participation" in our Proxy Statement, and is incorporated herein by this reference thereto.
Item 12. SECURITY OWNERSHIP OF CERTAIN BENEFICIAL OWNERS AND MANAGEMENT AND RELATED STOCKHOLDER MATTERS
Information with respect to security ownership of certain beneficial owners and management is set forth under the headings "Security Ownership of Certain Beneficial Owners and Management" and "Equity Compensation Plan Information" in our Proxy Statement, and is incorporated herein by this reference thereto.
Item 13. CERTAIN RELATIONSHIPS AND RELATED TRANSACTIONS, AND DIRECTOR INDEPENDENCE
Information regarding certain relationships and related transactions and director independence is presented under the heading "Corporate Governance" in our Proxy Statement, and is incorporated herein by this reference thereto.
Item 14. PRINCIPAL ACCOUNTANT FEES AND SERVICES
Information concerning principal accounting fees and services is presented under the heading "Fees Paid to Independent Public Accountant for Fiscal Years 2008 and 2007" in our Proxy Statement, and is incorporated herein by this reference thereto.
Page -57
Item 15. EXHIBITS, FINANCIAL STATEMENT SCHEDULES.
Pursuant to the requirements of Section 13 or 15(d) of the Securities Exchange Act of 1934, the registrant has duly caused this report to be signed on its behalf by the undersigned, thereunto duly authorized.
| TrueBlue, Inc. | ||||||
/s/ Steven C. Cooper |
2/17/09 |
|||||
|
|
||||||
| Signature | Date | |||||
| By: | Steven C. Cooper, Director, Chief Executive Officer and President | |||||
/s/ Derrek L. Gafford |
2/17/09 |
|||||
|
|
||||||
| Signature | Date | |||||
| By: | Derrek L. Gafford, Chief Financial Officer and Executive Vice President | |||||
/s/ Norman H. Frey |
2/17/09 |
|||||
|
|
||||||
| Signature | Date | |||||
| By: | Norman H. Frey, Chief Accounting Officer and Corporate Controller | |||||
Pursuant to the requirements of the Securities Exchange Act of 1934, this report has been signed by the following persons on behalf of the Registrant and in the capacities and on the dates indicated.
| /s/ Steven C. Cooper | 2/17/09 | /s/ Joseph P. Sambataro, Jr. | 2/17/09 | |||
|
|
|
|||||
| Signature | Date | Signature | Date | |||
| Steven C. Cooper, Director, Chief Executive Officer and President | Joseph P. Sambataro, Jr., Chairman of the Board | |||||
/s/ Craig Tall |
2/17/09 |
/s/ William W. Steele |
2/17/09 |
|||
|
|
|
|||||
| Signature | Date | Signature | Date | |||
| Craig Tall, Director | William W. Steele, Director | |||||
/s/ Thomas E. McChesney |
2/17/09 |
/s/ Robert J. Sullivan |
2/17/09 |
|||
|
|
|
|||||
| Signature | Date | Signature | Date | |||
| Thomas E. McChesney, Director | Robert J. Sullivan, Director | |||||
/s/ Gates McKibbin |
2/17/09 |
|||||
|
|
||||||
| Signature | Date | |||||
| Gates McKibbin, Director | ||||||
Page -58
Schedule II, Valuation and Qualifying Accounts (in millions)
Allowance for doubtful accounts activity was as follows:
| |
2008 | 2007 | 2006 | ||||||
|---|---|---|---|---|---|---|---|---|---|
Balance, beginning of the year |
$ | 6.0 | $ | 5.1 | $ | 5.4 | |||
Charged to expense, net of recoveries |
9.4 |
10.0 |
7.2 |
||||||
Write-offs |
(10.0) | (9.1) | (7.5) | ||||||
Balance, end of year |
$ |
5.4 |
$ |
6.0 |
$ |
5.1 |
|||
Workers' Compensation Claims Reserve activity was as follows:
| |
2008 | 2007 | 2006 | |||||||
|---|---|---|---|---|---|---|---|---|---|---|
Beginning balance |
$ | 197.4 | $ | 189.4 | $ | 167.8 | ||||
Self-insurance reserve expenses |
||||||||||
Expenses related to current year (net of discount) |
45.9 | 64.0 | 64.2 | |||||||
Changes related to prior years (net of discount) |
(21.0) | (19.5) | (7.9) | |||||||
Total |
24.9 | 44.5 | 56.3 | |||||||
Amortization of prior years' discount |
2.1 |
1.1 |
2.1 |
|||||||
Payments |
||||||||||
Payments related to current year claims |
(11.4) | (11.6) | (9.0) | |||||||
Payments related to claims from prior years |
(15.9) | (30.9) | (29.6) | |||||||
Total |
(27.3) | (42.5) | (38.6) | |||||||
Net change in excess claims reserve |
1.9 |
2.7 |
1.8 |
|||||||
Liability assumed from acquired businesses, net of discount |
4.6 | 2.2 | – | |||||||
Ending balance |
203.6 |
197.4 |
189.4 |
|||||||
Less current portion |
51.4 | 52.4 | 52.2 | |||||||
Long-term portion |
$ | 152.2 | $ | 145.0 | $ | 137.2 | ||||
Income tax valuation allowance activity was as follows:
| |
2008 | 2007 | 2006 | ||||||
|---|---|---|---|---|---|---|---|---|---|
Balance, beginning of the year |
$ | 14.5 | $ | 11.9 | $ | 8.1 | |||
Net operating losses in the United Kingdom and Puerto Rico |
(13.9) |
2.8 |
3.9 |
||||||
Other, net |
(0.1) | (0.2) | (0.1) | ||||||
Balance, end of year |
$ |
0.5 |
$ |
14.5 |
$ |
11.9 |
|||
Page -59
EXHIBIT INDEX
FORM 10-K
TrueBlue, Inc.
Exhibit Number |
Description | |
|||
|---|---|---|---|---|---|
| 3.1(a) | Amended and Restated Articles of Incorporation | (1) | |||
| 3.1(b) | Articles of Amendment to Amended and Restated Articles of Incorporation, dated December 18, 2007 | (2) | |||
| 3.2 | Amended and Restated Company Bylaws | (3) | |||
| 10.1 | 1996 Employee Stock Option and Incentive Plan | (4) | |||
| 10.2 | 2000 Stock Option Plan (Last Amended January 14, 2002) | (5) | |||
| 10.3 | 2002 U.K. Stock Option Plan | (5) | |||
| 10.4 | Assumption and Novation Agreement among Labor Ready, Inc. and Lumbermen's Mutual Casualty Company, American Motorist Insurance Company, American Protection Insurance Company and American Manufacturers Mutual Insurance Company and National Union Fire Insurance Company of Pittsburgh, PA, dated December 29, 2004 | (6) | |||
| 10.5 | Indemnification Agreement between Labor Ready, Inc. and National Union Fire Insurance Company of Pittsburgh, PA dated December 29, 2004 | (6) | |||
| 10.6 | 2005 Long Term Equity Compensation Program | (7) | |||
| 10.7 | Executive Employment Agreement between Labor Ready, Inc. and James E. Defebaugh, dated August 3, 2005 | (8) | |||
| 10.8 | Executive Employment Agreement between Labor Ready, Inc. and Steven C. Cooper, dated May 17, 2006 | (9) | |||
| 10.9 | Form Executive Employment Agreement as between Labor Ready, Inc. and Derrek Gafford, Wayne Larkin, and Noel Wheeler, dated December 31, 2006. | (10) | |||
| 10.10 | Form Executive Non-Compete Agreement between Labor Ready, Inc. and Steven Cooper, Jim Defebaugh, Derrek Gafford, Wayne Larkin, and Noel Wheeler. | (10) | |||
| 10.11 | Form Executive Indemnification Agreement between Labor Ready, Inc. and Steven Cooper, Jim Defebaugh, Derrek Gafford, Wayne Larkin, and Noel Wheeler. | (10) | |||
| 10.12 | Form Executive Change in Control Agreement between Labor Ready, Inc. and Steven Cooper, Jim Defebaugh, Derrek Gafford, Wayne Larkin, and Noel Wheeler. | (10) | |||
| 10.13 | Amended and Restated Credit Agreement between TrueBlue, Inc. and Wells Fargo Bank and Bank of America | (11) | |||
| 21 | Subsidiaries of TrueBlue, Inc. | ||||
| 23 | Consent of PricewaterhouseCoopers LLP – Independent Registered Public Accounting Firm | ||||
| 31.1 | Certification of Steven C. Cooper, Chief Executive Officer of TrueBlue, Inc., Pursuant to Rule 13a-14(a), as Adopted Pursuant to Section 302 of the Sarbanes-Oxley Act of 2002. | ||||
| 31.2 | Certification of Derrek L. Gafford, Chief Financial Officer of TrueBlue, Inc., Pursuant to Rule 13a-14(a), as Adopted Pursuant to Section 302 of the Sarbanes-Oxley Act of 2002. | ||||
| 32.1 | Certification of Steven C. Cooper, Chief Executive Officer of TrueBlue, Inc. and Derrek L. Gafford, Chief Financial Officer of TrueBlue, Inc., Pursuant to 18 U.S.C. Section 1350, as Adopted Pursuant to Section 906 of the Sarbanes-Oxley Act of 2002. | ||||
Page -60
EXHIBIT INDEX (continued)
Copies of Exhibits may be obtained upon request directed to Mr. James Defebaugh or Mr. Derrek Gafford, TrueBlue, Inc., PO Box 2910, Tacoma, Washington, 98401 and many are available at the SEC's website found at www.sec.gov.
Page -61