
Q4 2024 EARNINGS
2 Forward-looking statements and non-GAAP financial measures This presentation contains forward-looking statements relating to our plans and expectations including, without limitation, statements regarding the future performance and operations of our business, expectations regarding stabilization in demand, and expected growth from our digital investments, all of which are subject to risks and uncertainties. Such statements are based on management’s expectations and assumptions as of the date of this presentation and involve many risks and uncertainties that could cause actual results to differ materially from those expressed or implied in our forward-looking statements including: (1) national and global economic conditions, which can be negatively impacted by factors such as rising interest rates, inflation, political instability, epidemics and global trade uncertainty, (2) our ability to maintain profit margins, (3) our ability to successfully execute on business strategies and further digitalize our business model, (4) our ability to attract sufficient qualified candidates and employees to meet the needs of our clients, (5) our ability to attract and retain clients, (6) our ability to access sufficient capital to finance our operations, including our ability to comply with covenants contained in our revolving credit facility, (7) new laws, regulations, and government incentives that could affect our operations or financial results, (8) any reduction or change in tax credits we utilize, including the Work Opportunity Tax Credit, (9) our ability to successfully integrate acquired businesses, and (10) the timing and amount of common stock repurchases, if any, which will be determined at management’s discretion and depend upon several factors, including market and business conditions, the trading price of our common stock and the nature of other investment opportunities. Other information regarding factors that could affect our results is included in our Securities and Exchange Commission (SEC) filings, including the company’s most recent reports on Forms 10-K and 10-Q, copies of which may be obtained by visiting our website at www.trueblue.com under the Investor Relations section or the SEC’s website at www.sec.gov. We assume no obligation to update or revise any forward-looking statement, whether as a result of new information, future events, or otherwise, except as required by law. Any other references to future financial estimates are included for informational purposes only and subject to risk factors discussed in our most recent filings with the SEC. Any comparisons made herein to other periods are based on a comparison to the same period in the prior year unless otherwise stated. In addition, we use several non-GAAP financial measures when presenting our financial results in this presentation. Please refer to the reconciliations between our U.S. GAAP and non-GAAP financial measures in the appendix to this presentation and on our website at www.trueblue.com under the Investor Relations section for additional information on both current and historical periods. The presentation of these non-GAAP financial measures is used to enhance the understanding of certain aspects of our financial performance. It is not meant to be considered in isolation, superior to, or as a substitute for the directly comparable financial measures prepared in accordance with U.S. GAAP, and may not be comparable to similarly titled measures of other companies. Any comparisons made herein to other periods are based on a comparison to the same period in the prior year unless otherwise stated.
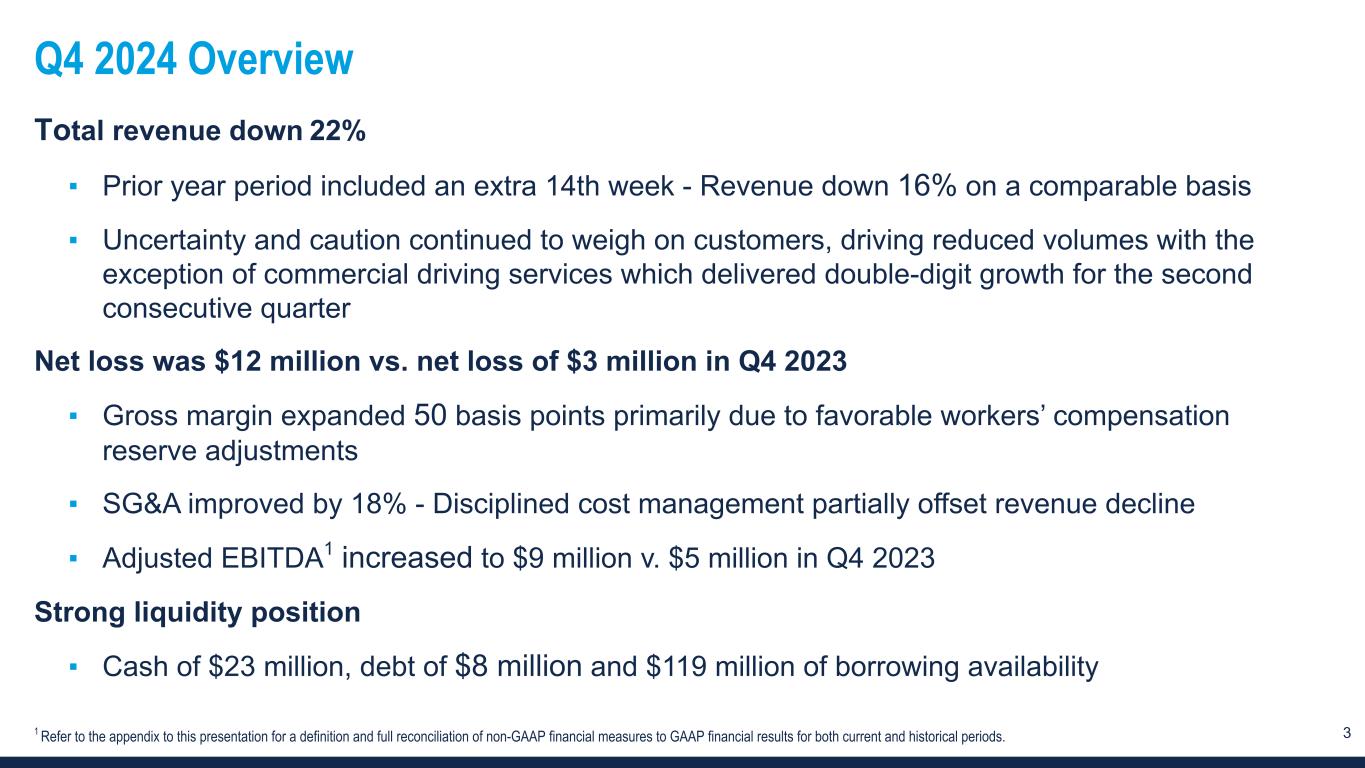
3 Q4 2024 Overview Total revenue down 22% ▪ Prior year period included an extra 14th week - Revenue down 16% on a comparable basis ▪ Uncertainty and caution continued to weigh on customers, driving reduced volumes with the exception of commercial driving services which delivered double-digit growth for the second consecutive quarter Net loss was $12 million vs. net loss of $3 million in Q4 2023 ▪ Gross margin expanded 50 basis points primarily due to favorable workers’ compensation reserve adjustments ▪ SG&A improved by 18% - Disciplined cost management partially offset revenue decline ▪ Adjusted EBITDA1 increased to $9 million v. $5 million in Q4 2023 Strong liquidity position ▪ Cash of $23 million, debt of $8 million and $119 million of borrowing availability 1 Refer to the appendix to this presentation for a definition and full reconciliation of non-GAAP financial measures to GAAP financial results for both current and historical periods.
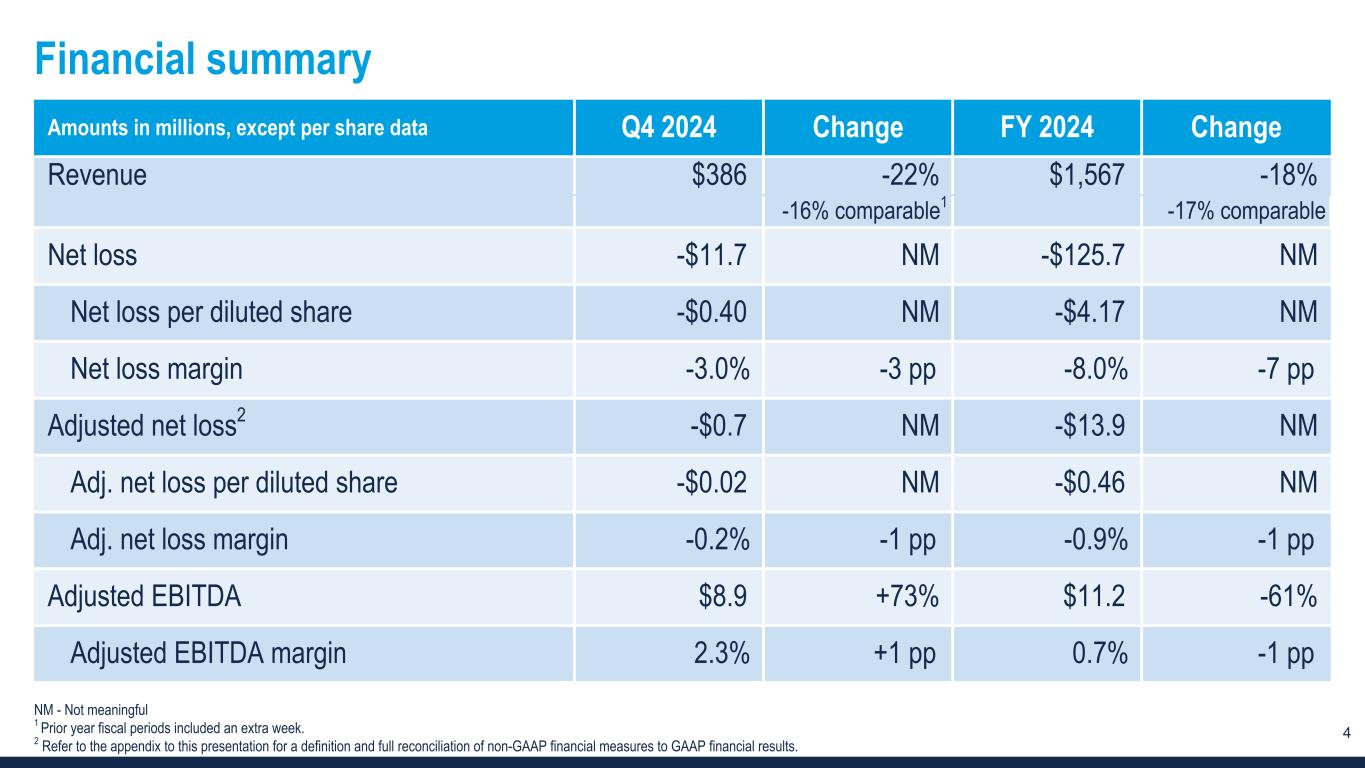
4 Financial summary Amounts in millions, except per share data Q4 2024 Change FY 2024 Change Revenue $386 -22 % $1,567 -18 % -16% comparable1 -17% comparable Net loss -$11.7 NM -$125.7 NM Net loss per diluted share -$0.40 NM -$4.17 NM Net loss margin -3.0 % -3 pp -8.0 % -7 pp Adjusted net loss2 -$0.7 NM -$13.9 NM Adj. net loss per diluted share -$0.02 NM -$0.46 NM Adj. net loss margin -0.2 % -1 pp -0.9 % -1 pp Adjusted EBITDA $8.9 +73 % $11.2 -61 % Adjusted EBITDA margin 2.3 % +1 pp 0.7 % -1 pp NM - Not meaningful 1 Prior year fiscal periods included an extra week. 2 Refer to the appendix to this presentation for a definition and full reconciliation of non-GAAP financial measures to GAAP financial results.
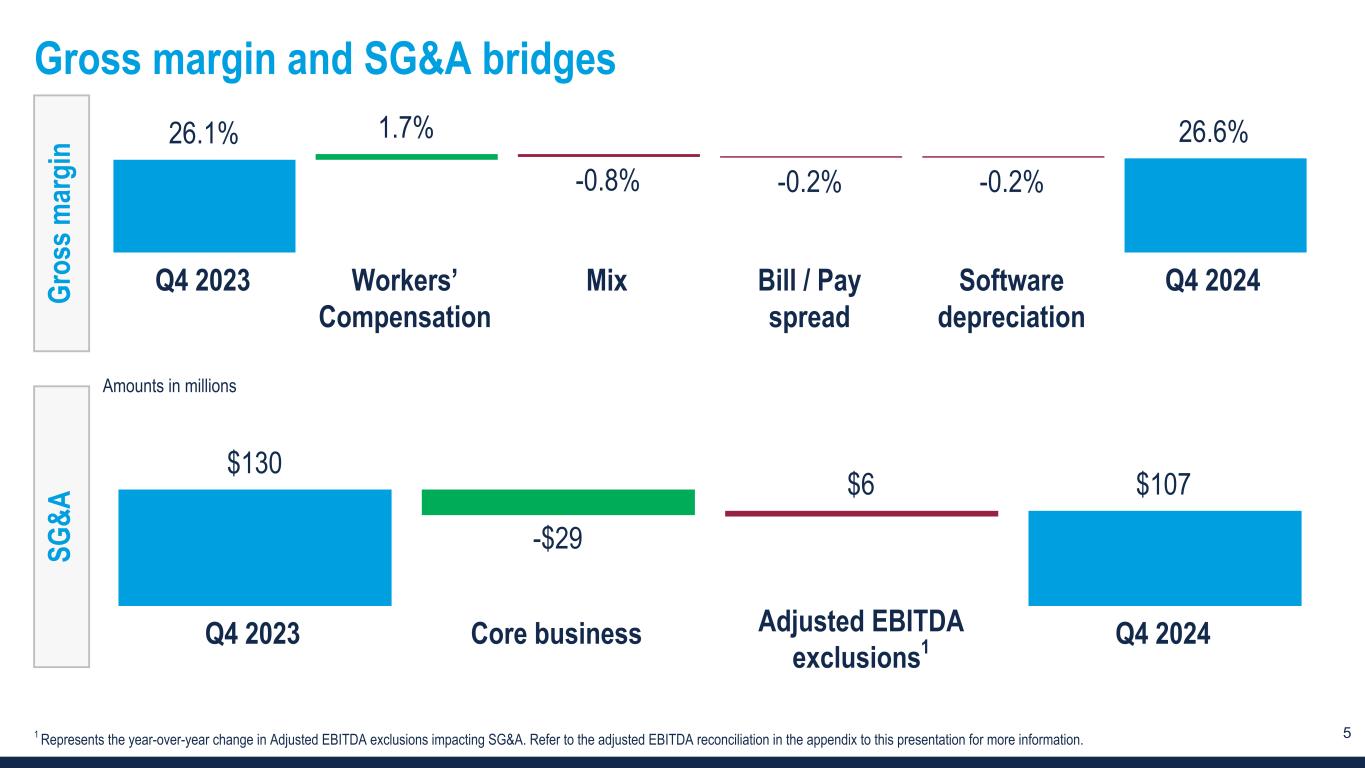
5 Gross margin and SG&A bridges Gr os s m ar gi n 26.1% 1.7% -0.8% -0.2% -0.2% 26.6% Q4 2023 Workers’ Compensation Mix Bill / Pay spread Software depreciation Q4 2024 SG &A $130 -$29 $6 $107 Q4 2023 Core business Q4 2024 Amounts in millions 1 Represents the year-over-year change in Adjusted EBITDA exclusions impacting SG&A. Refer to the adjusted EBITDA reconciliation in the appendix to this presentation for more information. Adjusted EBITDA exclusions1
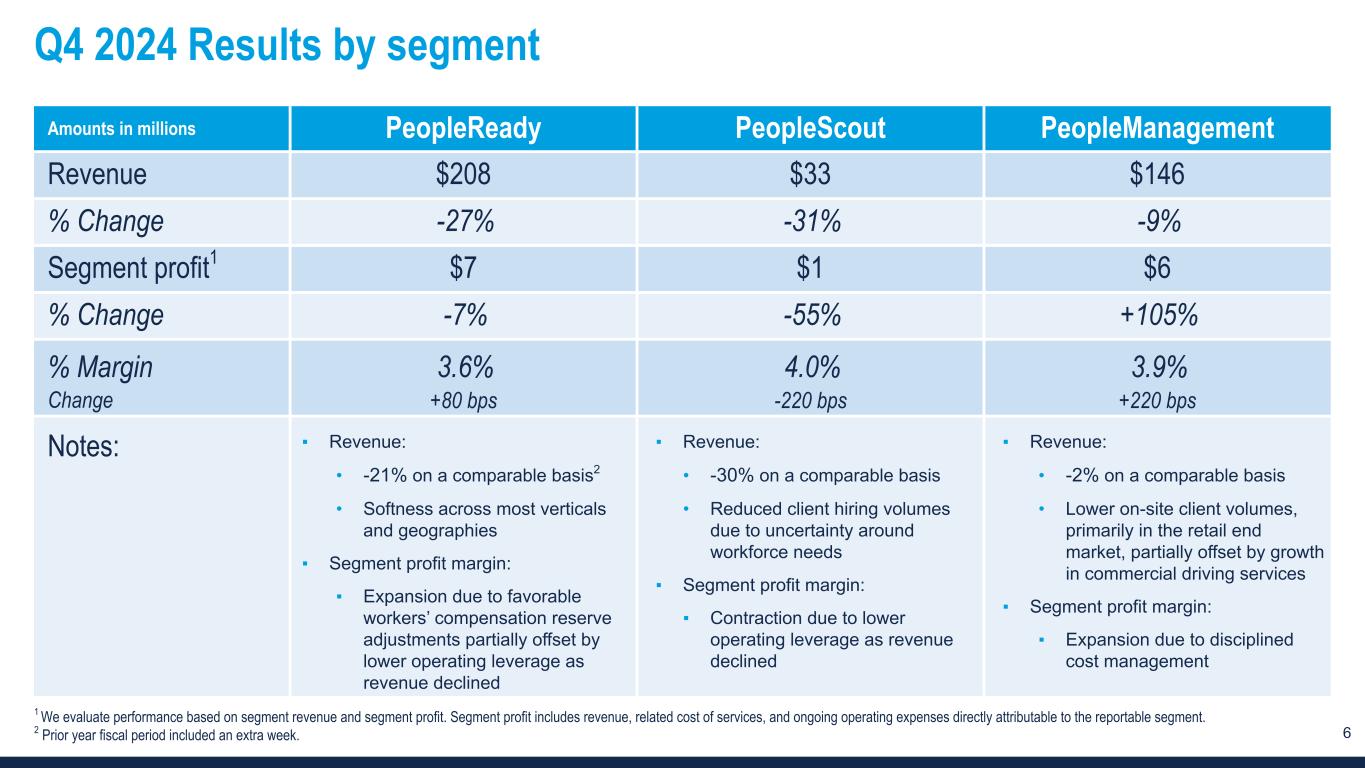
6 Q4 2024 Results by segment Amounts in millions PeopleReady PeopleScout PeopleManagement Revenue $208 $33 $146 % Change -27% -31% -9% Segment profit1 $7 $1 $6 % Change -7% -55% +105% % Margin 3.6% 4.0% 3.9% Change +80 bps -220 bps +220 bps Notes: ▪ Revenue: • -21% on a comparable basis2 • Softness across most verticals and geographies ▪ Segment profit margin: ▪ Expansion due to favorable workers’ compensation reserve adjustments partially offset by lower operating leverage as revenue declined ▪ Revenue: • -30% on a comparable basis • Reduced client hiring volumes due to uncertainty around workforce needs ▪ Segment profit margin: ▪ Contraction due to lower operating leverage as revenue declined ▪ Revenue: • -2% on a comparable basis • Lower on-site client volumes, primarily in the retail end market, partially offset by growth in commercial driving services ▪ Segment profit margin: ▪ Expansion due to disciplined cost management 1 We evaluate performance based on segment revenue and segment profit. Segment profit includes revenue, related cost of services, and ongoing operating expenses directly attributable to the reportable segment. 2 Prior year fiscal period included an extra week.
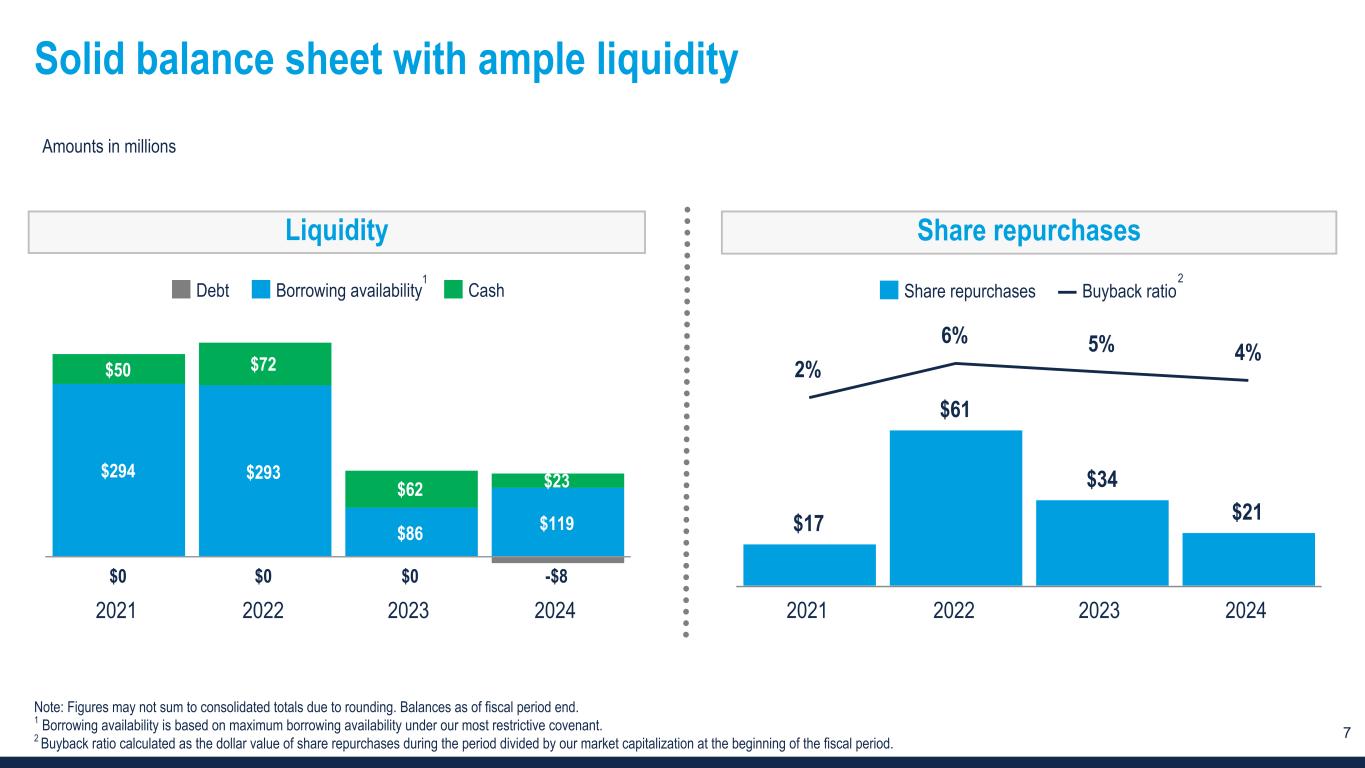
7 Solid balance sheet with ample liquidity $0 $0 $0 -$8 $294 $293 $86 $119 $50 $72 $62 $23 Debt Borrowing availability Cash 2021 2022 2023 2024 Amounts in millions Note: Figures may not sum to consolidated totals due to rounding. Balances as of fiscal period end. 1 Borrowing availability is based on maximum borrowing availability under our most restrictive covenant. 2 Buyback ratio calculated as the dollar value of share repurchases during the period divided by our market capitalization at the beginning of the fiscal period. Liquidity Share repurchases 1 $17 $61 $34 $21 2% 6% 5% 4% Share repurchases Buyback ratio 2021 2022 2023 2024 2

Outlook
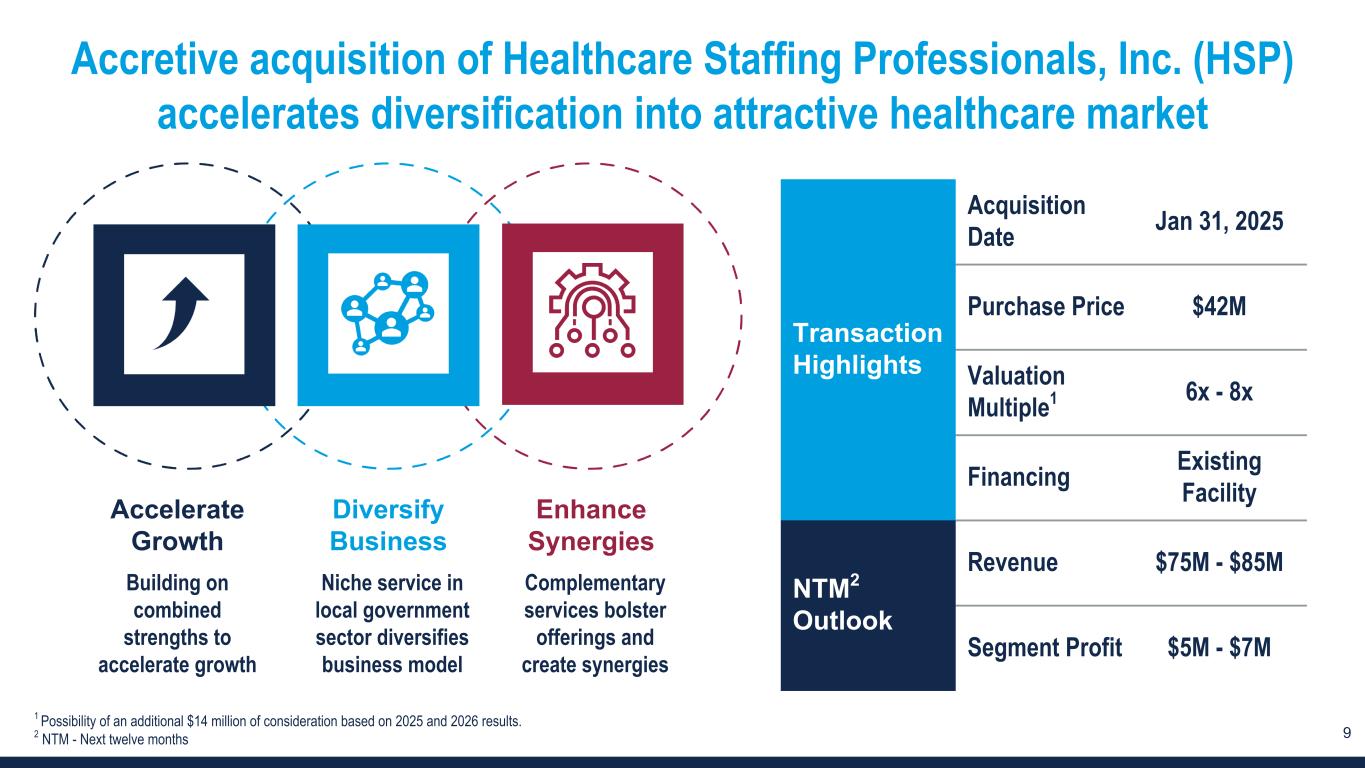
9 Accretive acquisition of Healthcare Staffing Professionals, Inc. (HSP) accelerates diversification into attractive healthcare market Transaction Highlights Acquisition Date Jan 31, 2025 Purchase Price $42M Valuation Multiple1 6x - 8x Financing Existing Facility NTM2 Outlook Revenue $75M - $85M Segment Profit $5M - $7M Accelerate Growth Building on combined strengths to accelerate growth Enhance Synergies Complementary services bolster offerings and create synergies Diversify Business Niche service in local government sector diversifies business model 1 Possibility of an additional $14 million of consideration based on 2025 and 2026 results. 2 NTM - Next twelve months
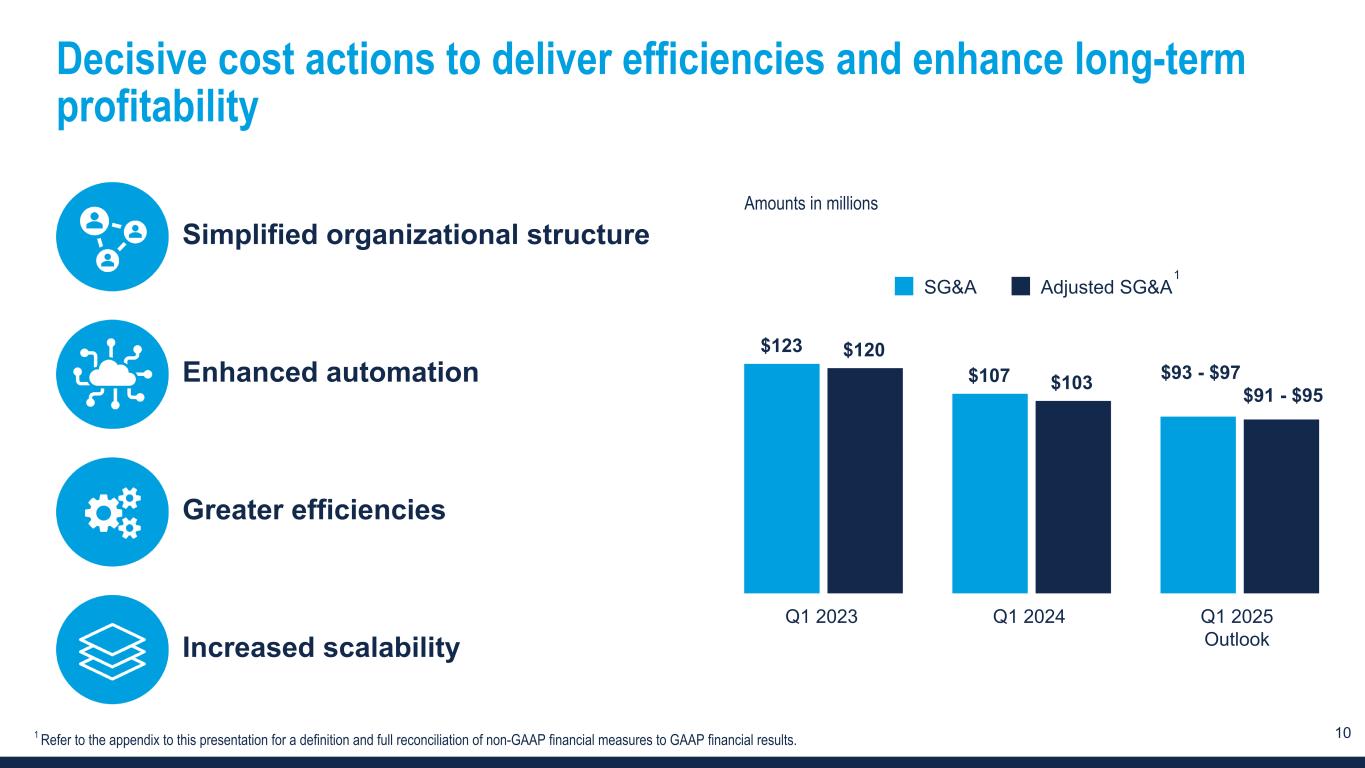
10 Decisive cost actions to deliver efficiencies and enhance long-term profitability $123 $107 $120 $103 SG&A Adjusted SG&A Q1 2023 Q1 2024 Q1 2025 Outlook Amounts in millions Simplified organizational structure Enhanced automation Greater efficiencies Increased scalability $93 - $97 $91 - $95 1 1 Refer to the appendix to this presentation for a definition and full reconciliation of non-GAAP financial measures to GAAP financial results.
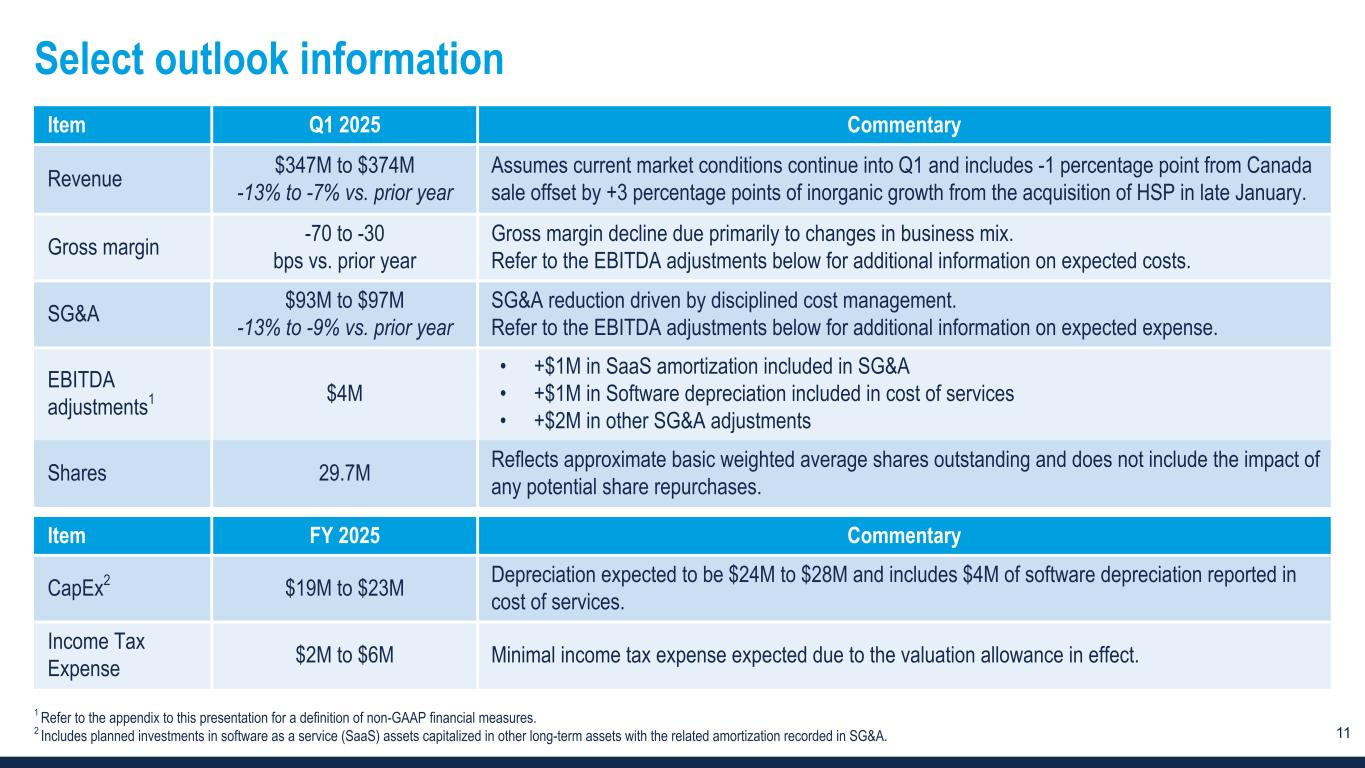
11 Select outlook information Item Q1 2025 Commentary Revenue $347M to $374M -13% to -7% vs. prior year Assumes current market conditions continue into Q1 and includes -1 percentage point from Canada sale offset by +3 percentage points of inorganic growth from the acquisition of HSP in late January. Gross margin -70 to -30 bps vs. prior year Gross margin decline due primarily to changes in business mix. Refer to the EBITDA adjustments below for additional information on expected costs. SG&A $93M to $97M -13% to -9% vs. prior year SG&A reduction driven by disciplined cost management. Refer to the EBITDA adjustments below for additional information on expected expense. EBITDA adjustments1 $4M • +$1M in SaaS amortization included in SG&A • +$1M in Software depreciation included in cost of services • +$2M in other SG&A adjustments Shares 29.7M Reflects approximate basic weighted average shares outstanding and does not include the impact of any potential share repurchases. Item FY 2025 Commentary CapEx2 $19M to $23M Depreciation expected to be $24M to $28M and includes $4M of software depreciation reported in cost of services. Income Tax Expense $2M to $6M Minimal income tax expense expected due to the valuation allowance in effect. 1 Refer to the appendix to this presentation for a definition of non-GAAP financial measures. 2 Includes planned investments in software as a service (SaaS) assets capitalized in other long-term assets with the related amortization recorded in SG&A.

Appendix
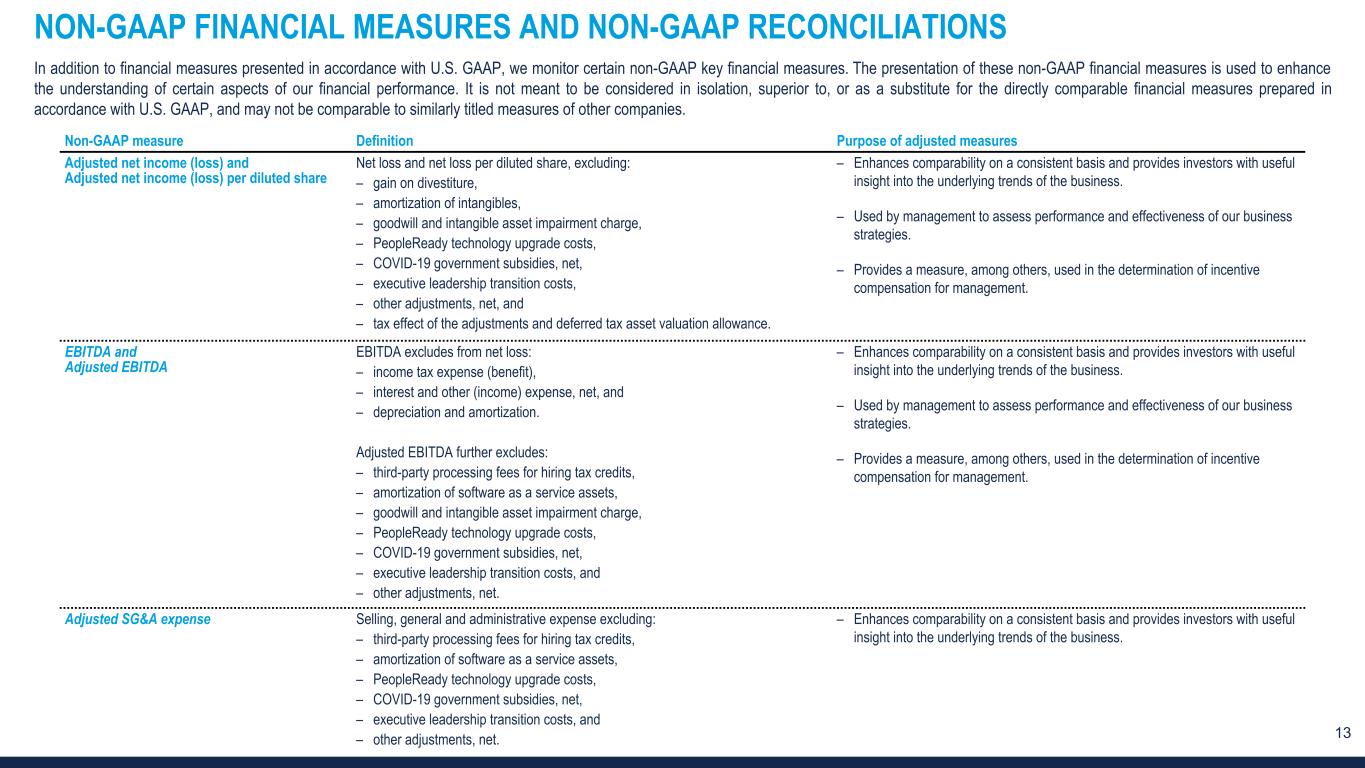
13 NON-GAAP FINANCIAL MEASURES AND NON-GAAP RECONCILIATIONS In addition to financial measures presented in accordance with U.S. GAAP, we monitor certain non-GAAP key financial measures. The presentation of these non-GAAP financial measures is used to enhance the understanding of certain aspects of our financial performance. It is not meant to be considered in isolation, superior to, or as a substitute for the directly comparable financial measures prepared in accordance with U.S. GAAP, and may not be comparable to similarly titled measures of other companies. Non-GAAP measure Definition Purpose of adjusted measures Adjusted net income (loss) and Adjusted net income (loss) per diluted share Net loss and net loss per diluted share, excluding: – gain on divestiture, – amortization of intangibles, – goodwill and intangible asset impairment charge, – PeopleReady technology upgrade costs, – COVID-19 government subsidies, net, – executive leadership transition costs, – other adjustments, net, and – tax effect of the adjustments and deferred tax asset valuation allowance. – Enhances comparability on a consistent basis and provides investors with useful insight into the underlying trends of the business. – Used by management to assess performance and effectiveness of our business strategies. – Provides a measure, among others, used in the determination of incentive compensation for management. EBITDA and Adjusted EBITDA EBITDA excludes from net loss: – income tax expense (benefit), – interest and other (income) expense, net, and – depreciation and amortization. Adjusted EBITDA further excludes: – third-party processing fees for hiring tax credits, – amortization of software as a service assets, – goodwill and intangible asset impairment charge, – PeopleReady technology upgrade costs, – COVID-19 government subsidies, net, – executive leadership transition costs, and – other adjustments, net. – Enhances comparability on a consistent basis and provides investors with useful insight into the underlying trends of the business. – Used by management to assess performance and effectiveness of our business strategies. – Provides a measure, among others, used in the determination of incentive compensation for management. Adjusted SG&A expense Selling, general and administrative expense excluding: – third-party processing fees for hiring tax credits, – amortization of software as a service assets, – PeopleReady technology upgrade costs, – COVID-19 government subsidies, net, – executive leadership transition costs, and – other adjustments, net. – Enhances comparability on a consistent basis and provides investors with useful insight into the underlying trends of the business.
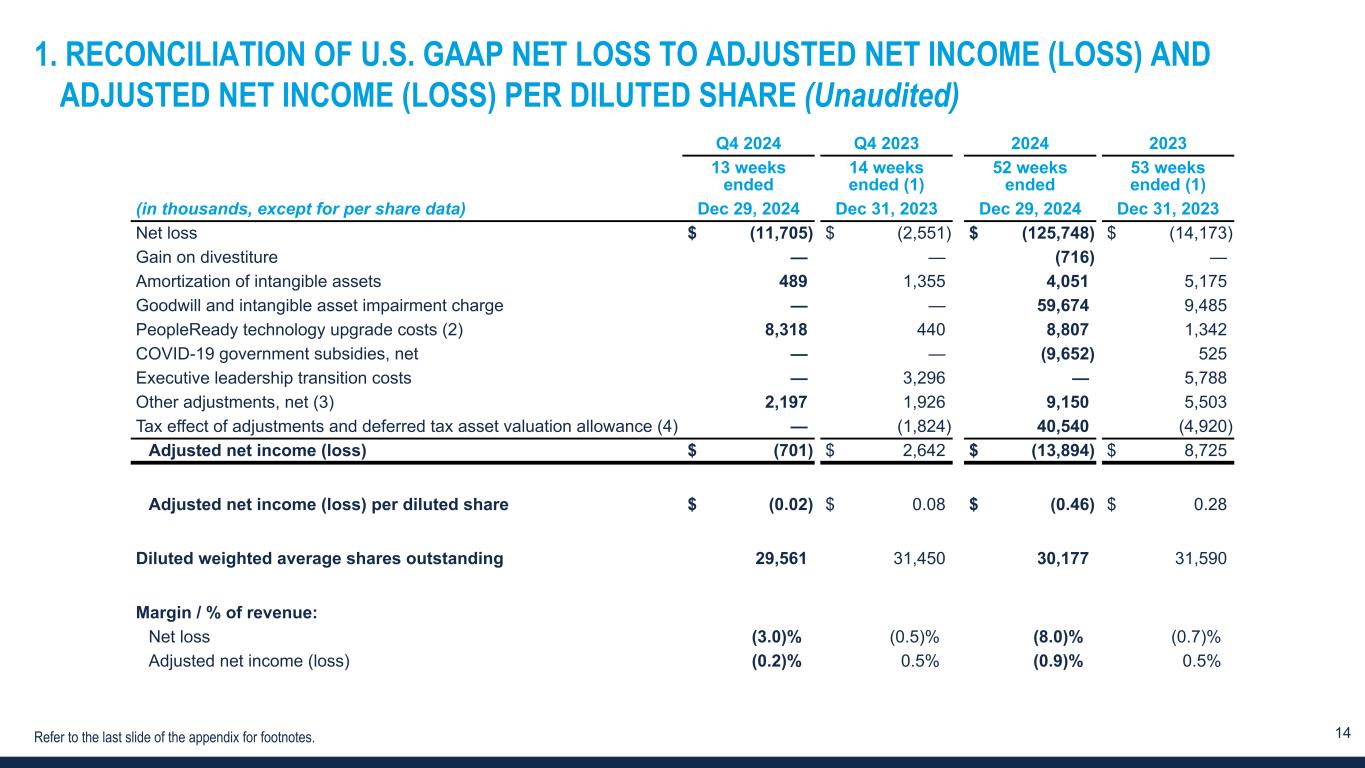
14 1. RECONCILIATION OF U.S. GAAP NET LOSS TO ADJUSTED NET INCOME (LOSS) AND ADJUSTED NET INCOME (LOSS) PER DILUTED SHARE (Unaudited) Q4 2024 Q4 2023 2024 2023 13 weeks ended 14 weeks ended (1) 52 weeks ended 53 weeks ended (1) (in thousands, except for per share data) Dec 29, 2024 Dec 31, 2023 Dec 29, 2024 Dec 31, 2023 Net loss $ (11,705) $ (2,551) $ (125,748) $ (14,173) Gain on divestiture — — (716) — Amortization of intangible assets 489 1,355 4,051 5,175 Goodwill and intangible asset impairment charge — — 59,674 9,485 PeopleReady technology upgrade costs (2) 8,318 440 8,807 1,342 COVID-19 government subsidies, net — — (9,652) 525 Executive leadership transition costs — 3,296 — 5,788 Other adjustments, net (3) 2,197 1,926 9,150 5,503 Tax effect of adjustments and deferred tax asset valuation allowance (4) — (1,824) 40,540 (4,920) Adjusted net income (loss) $ (701) $ 2,642 $ (13,894) $ 8,725 Adjusted net income (loss) per diluted share $ (0.02) $ 0.08 $ (0.46) $ 0.28 Diluted weighted average shares outstanding 29,561 31,450 30,177 31,590 Margin / % of revenue: Net loss (3.0) % (0.5) % (8.0) % (0.7) % Adjusted net income (loss) (0.2) % 0.5 % (0.9) % 0.5 % Refer to the last slide of the appendix for footnotes.
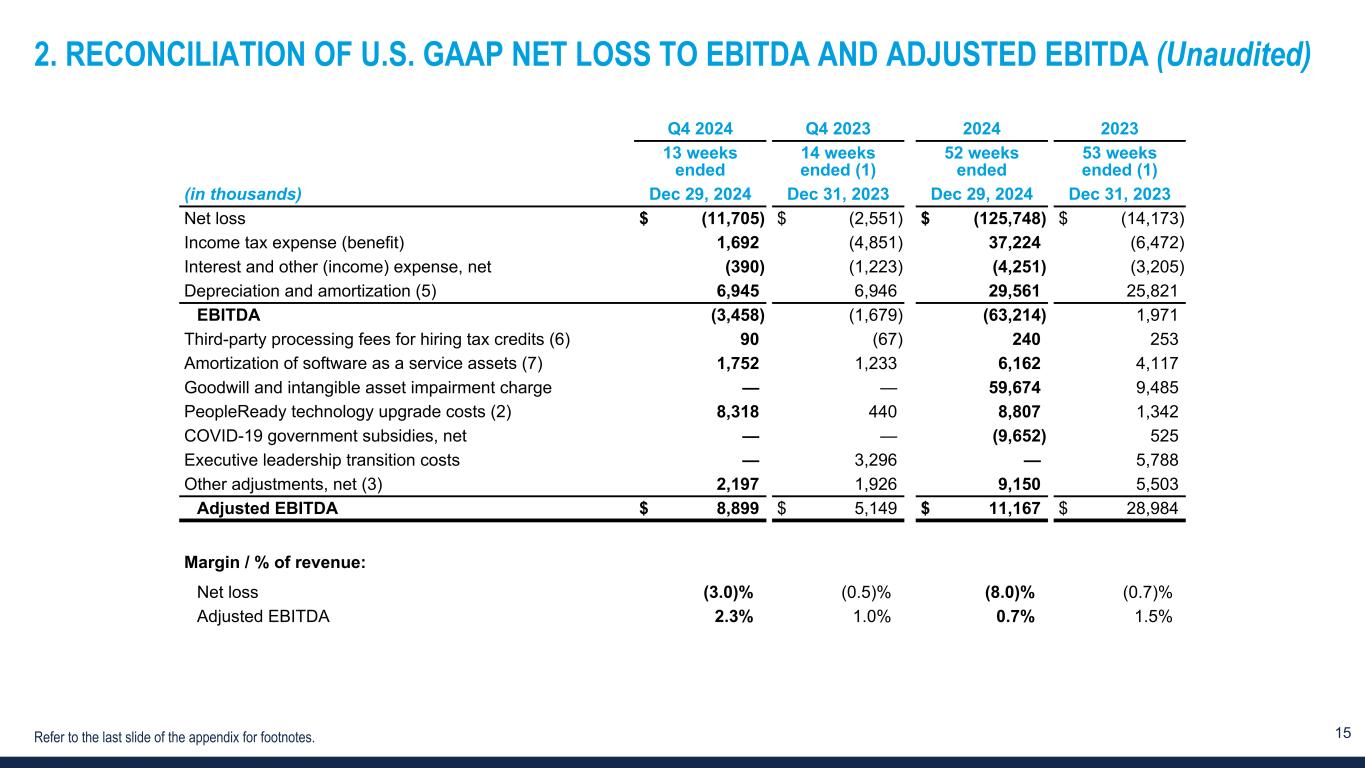
15 2. RECONCILIATION OF U.S. GAAP NET LOSS TO EBITDA AND ADJUSTED EBITDA (Unaudited) Refer to the last slide of the appendix for footnotes. Q4 2024 Q4 2023 2024 2023 13 weeks ended 14 weeks ended (1) 52 weeks ended 53 weeks ended (1) (in thousands) Dec 29, 2024 Dec 31, 2023 Dec 29, 2024 Dec 31, 2023 Net loss $ (11,705) $ (2,551) $ (125,748) $ (14,173) Income tax expense (benefit) 1,692 (4,851) 37,224 (6,472) Interest and other (income) expense, net (390) (1,223) (4,251) (3,205) Depreciation and amortization (5) 6,945 6,946 29,561 25,821 EBITDA (3,458) (1,679) (63,214) 1,971 Third-party processing fees for hiring tax credits (6) 90 (67) 240 253 Amortization of software as a service assets (7) 1,752 1,233 6,162 4,117 Goodwill and intangible asset impairment charge — — 59,674 9,485 PeopleReady technology upgrade costs (2) 8,318 440 8,807 1,342 COVID-19 government subsidies, net — — (9,652) 525 Executive leadership transition costs — 3,296 — 5,788 Other adjustments, net (3) 2,197 1,926 9,150 5,503 Adjusted EBITDA $ 8,899 $ 5,149 $ 11,167 $ 28,984 Margin / % of revenue: Net loss (3.0) % (0.5) % (8.0) % (0.7) % Adjusted EBITDA 2.3 % 1.0 % 0.7 % 1.5 %
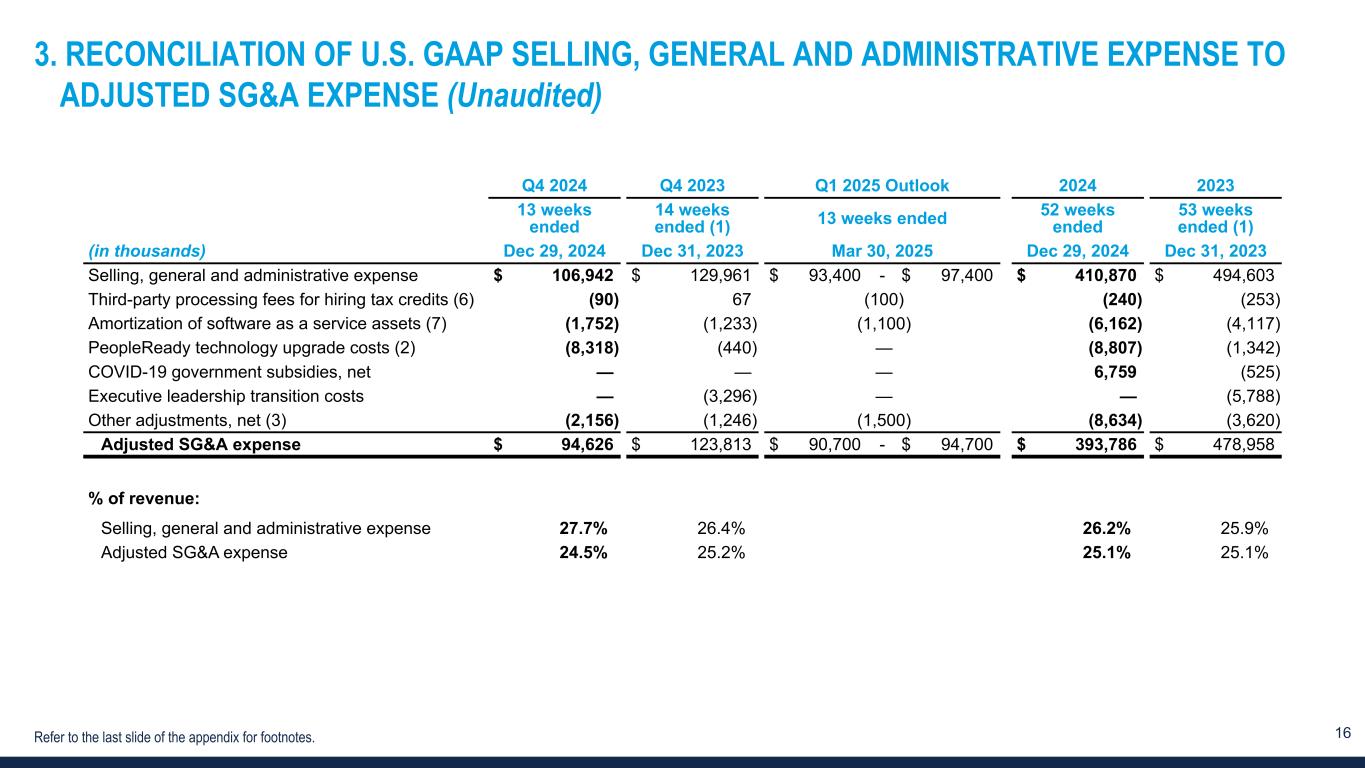
16 3. RECONCILIATION OF U.S. GAAP SELLING, GENERAL AND ADMINISTRATIVE EXPENSE TO ADJUSTED SG&A EXPENSE (Unaudited) Refer to the last slide of the appendix for footnotes. Q4 2024 Q4 2023 Q1 2025 Outlook 2024 2023 13 weeks ended 14 weeks ended (1) 13 weeks ended 52 weeks ended 53 weeks ended (1) (in thousands) Dec 29, 2024 Dec 31, 2023 Mar 30, 2025 Dec 29, 2024 Dec 31, 2023 Selling, general and administrative expense $ 106,942 $ 129,961 $ 93,400 - $ 97,400 $ 410,870 $ 494,603 Third-party processing fees for hiring tax credits (6) (90) 67 (100) (240) (253) Amortization of software as a service assets (7) (1,752) (1,233) (1,100) (6,162) (4,117) PeopleReady technology upgrade costs (2) (8,318) (440) — (8,807) (1,342) COVID-19 government subsidies, net — — — 6,759 (525) Executive leadership transition costs — (3,296) — — (5,788) Other adjustments, net (3) (2,156) (1,246) (1,500) (8,634) (3,620) Adjusted SG&A expense $ 94,626 $ 123,813 $ 90,700 - $ 94,700 $ 393,786 $ 478,958 % of revenue: Selling, general and administrative expense 27.7 % 26.4 % 26.2 % 25.9 % Adjusted SG&A expense 24.5 % 25.2 % 25.1 % 25.1 %
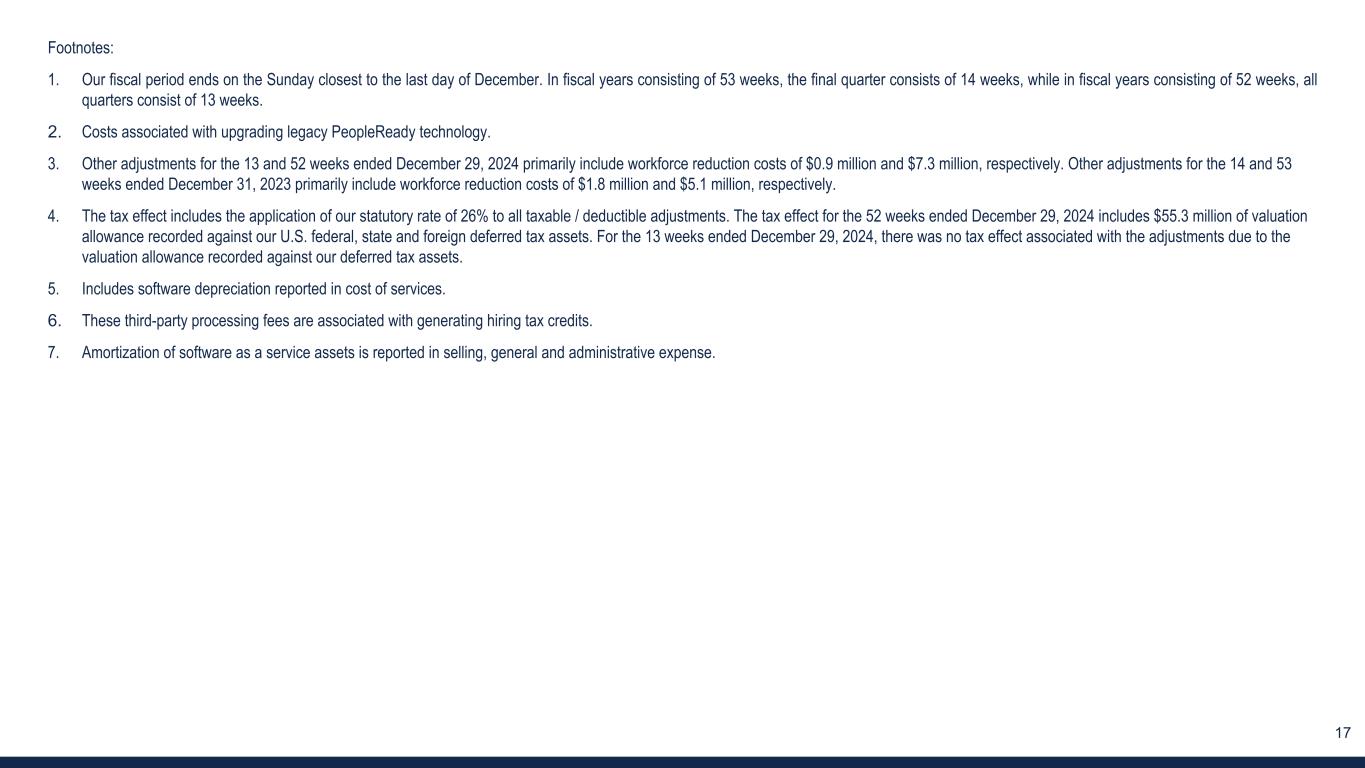
17 Footnotes: 1. Our fiscal period ends on the Sunday closest to the last day of December. In fiscal years consisting of 53 weeks, the final quarter consists of 14 weeks, while in fiscal years consisting of 52 weeks, all quarters consist of 13 weeks. 2. Costs associated with upgrading legacy PeopleReady technology. 3. Other adjustments for the 13 and 52 weeks ended December 29, 2024 primarily include workforce reduction costs of $0.9 million and $7.3 million, respectively. Other adjustments for the 14 and 53 weeks ended December 31, 2023 primarily include workforce reduction costs of $1.8 million and $5.1 million, respectively. 4. The tax effect includes the application of our statutory rate of 26% to all taxable / deductible adjustments. The tax effect for the 52 weeks ended December 29, 2024 includes $55.3 million of valuation allowance recorded against our U.S. federal, state and foreign deferred tax assets. For the 13 weeks ended December 29, 2024, there was no tax effect associated with the adjustments due to the valuation allowance recorded against our deferred tax assets. 5. Includes software depreciation reported in cost of services. 6. These third-party processing fees are associated with generating hiring tax credits. 7. Amortization of software as a service assets is reported in selling, general and administrative expense.