
Q1 2019 Earnings April 2019 www.TrueBlue.com
Forward-looking statements
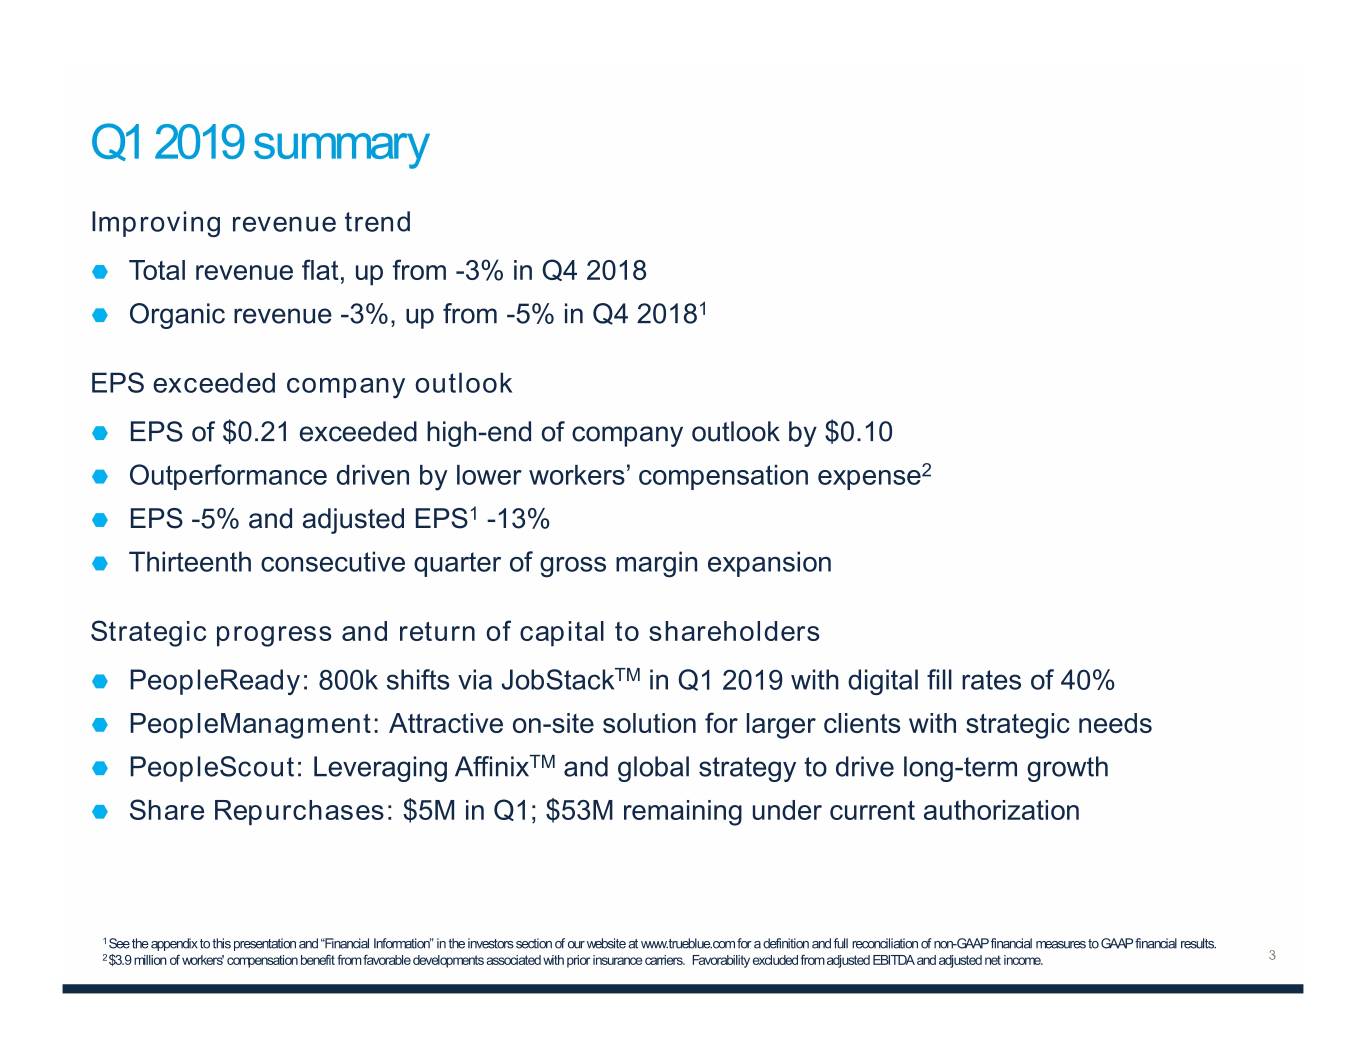
Q1 2019 summary Improving revenue trend Total revenue flat, up from -3% in Q4 2018 Organic revenue -3%, up from -5% in Q4 20181 EPS exceeded company outlook EPS of $0.21 exceeded high-end of company outlook by $0.10 Outperformance driven by lower workers’ compensation expense2 EPS -5% and adjusted EPS1 -13% Thirteenth consecutive quarter of gross margin expansion Strategic progress and return of capital to shareholders PeopleReady: 800k shifts via JobStackTM in Q1 2019 with digital fill rates of 40% PeopleManagment: Attractive on-site solution for larger clients with strategic needs PeopleScout: Leveraging AffinixTM and global strategy to drive long-term growth Share Repurchases: $5M in Q1; $53M remaining under current authorization 1 See the appendix to this presentation and “Financial Information” in the investors section of our website at www.trueblue.com for a definition and full reconciliation of non-GAAP financial measures to GAAP financial results. 2 $3.9 million of workers' compensation benefit from favorable developments associated with prior insurance carriers. Favorability excluded from adjusted EBITDA and adjusted net income.
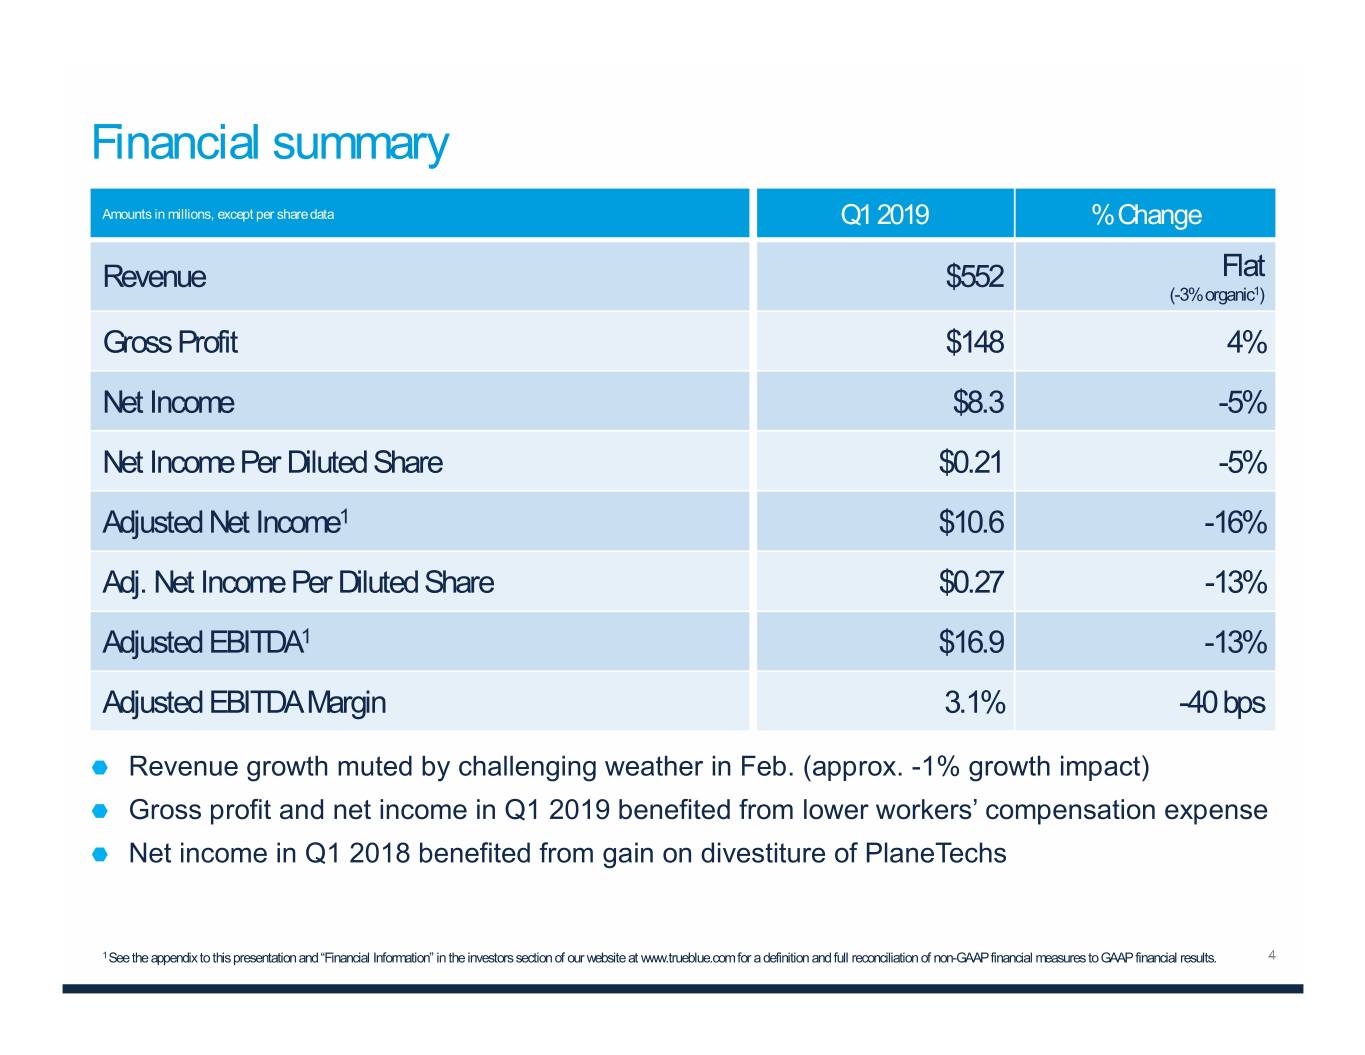
Financial summary Amounts in millions, except per share data Q1 2019 % Change Revenue $552 Flat (-3% organic1) Gross Profit $148 4% Net Income $8.3 -5% Net Income Per Diluted Share $0.21 -5% Adjusted Net Income1 $10.6 -16% Adj. Net Income Per Diluted Share $0.27 -13% Adjusted EBITDA1 $16.9 -13% Adjusted EBITDA Margin 3.1% -40 bps Revenue growth muted by challenging weather in Feb. (approx. -1% growth impact) Gross profit and net income in Q1 2019 benefited from lower workers’ compensation expense Net income in Q1 2018 benefited from gain on divestiture of PlaneTechs 1 See the appendix to this presentation and “Financial Information” in the investors section of our website at www.trueblue.com for a definition and full reconciliation of non-GAAP financial measures to GAAP financial results.
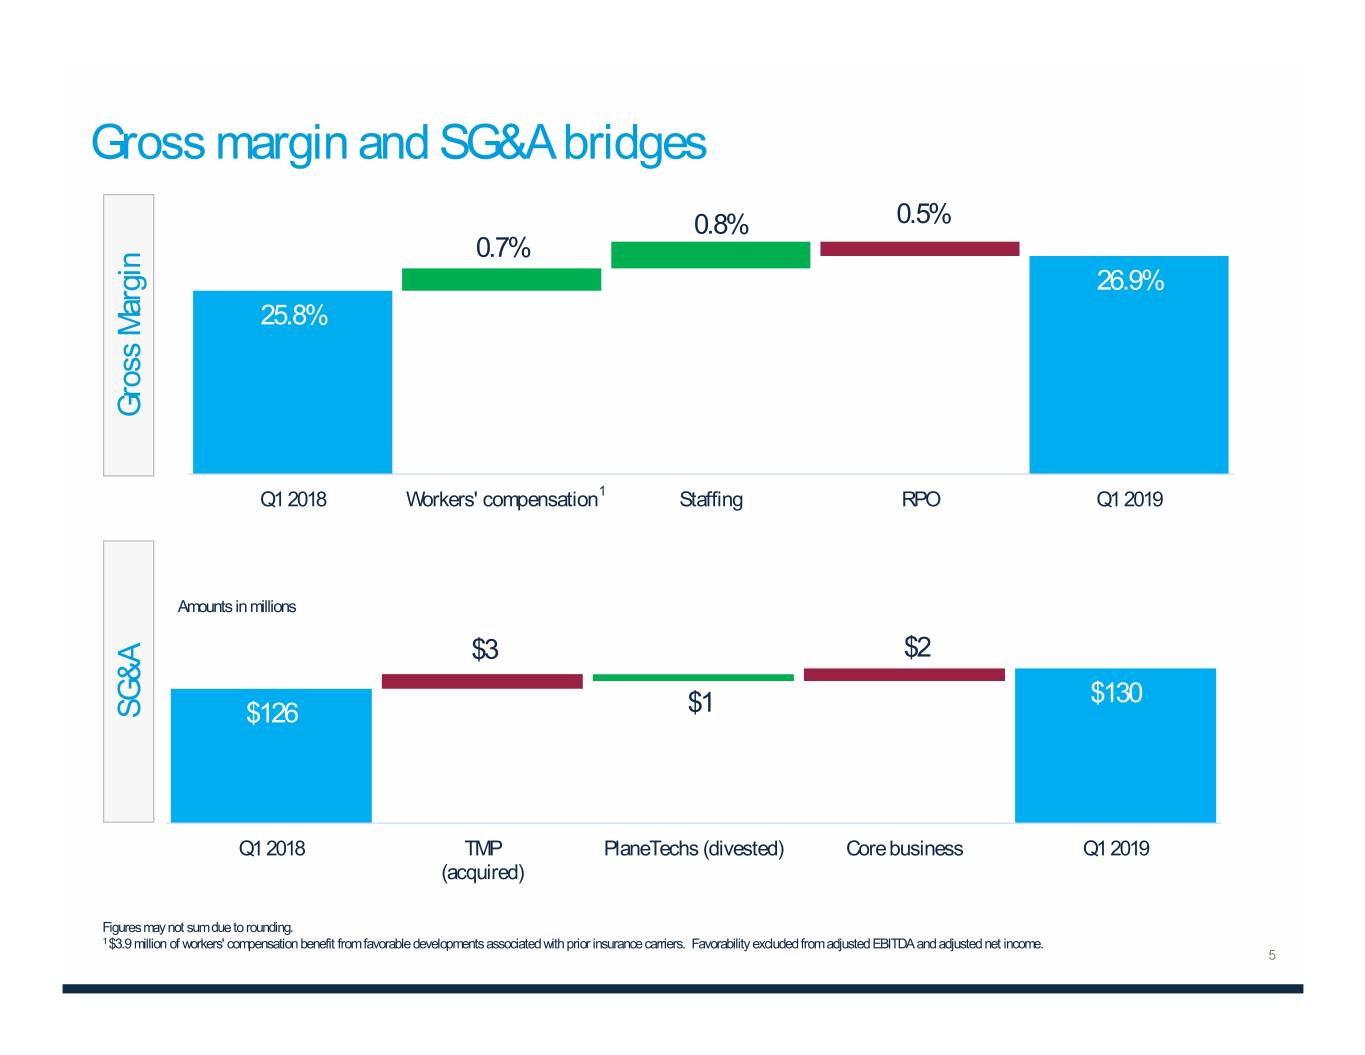
Gross margin and SG&A bridges 0.8% 0.5% 0.7% 26.9% 25.8% Gross Margin Q1 2018 Workers' compensation1 Staffing RPO Q1 2019 Amounts in millions $3 $2 $1 $130 SG&A $126 Q1 2018 TMP PlaneTechs (divested) Core business Q1 2019 (acquired) Figures may not sum due to rounding. 1 $3.9 million of workers' compensation benefit from favorable developments associated with prior insurance carriers. Favorability excluded from adjusted EBITDA and adjusted net income.
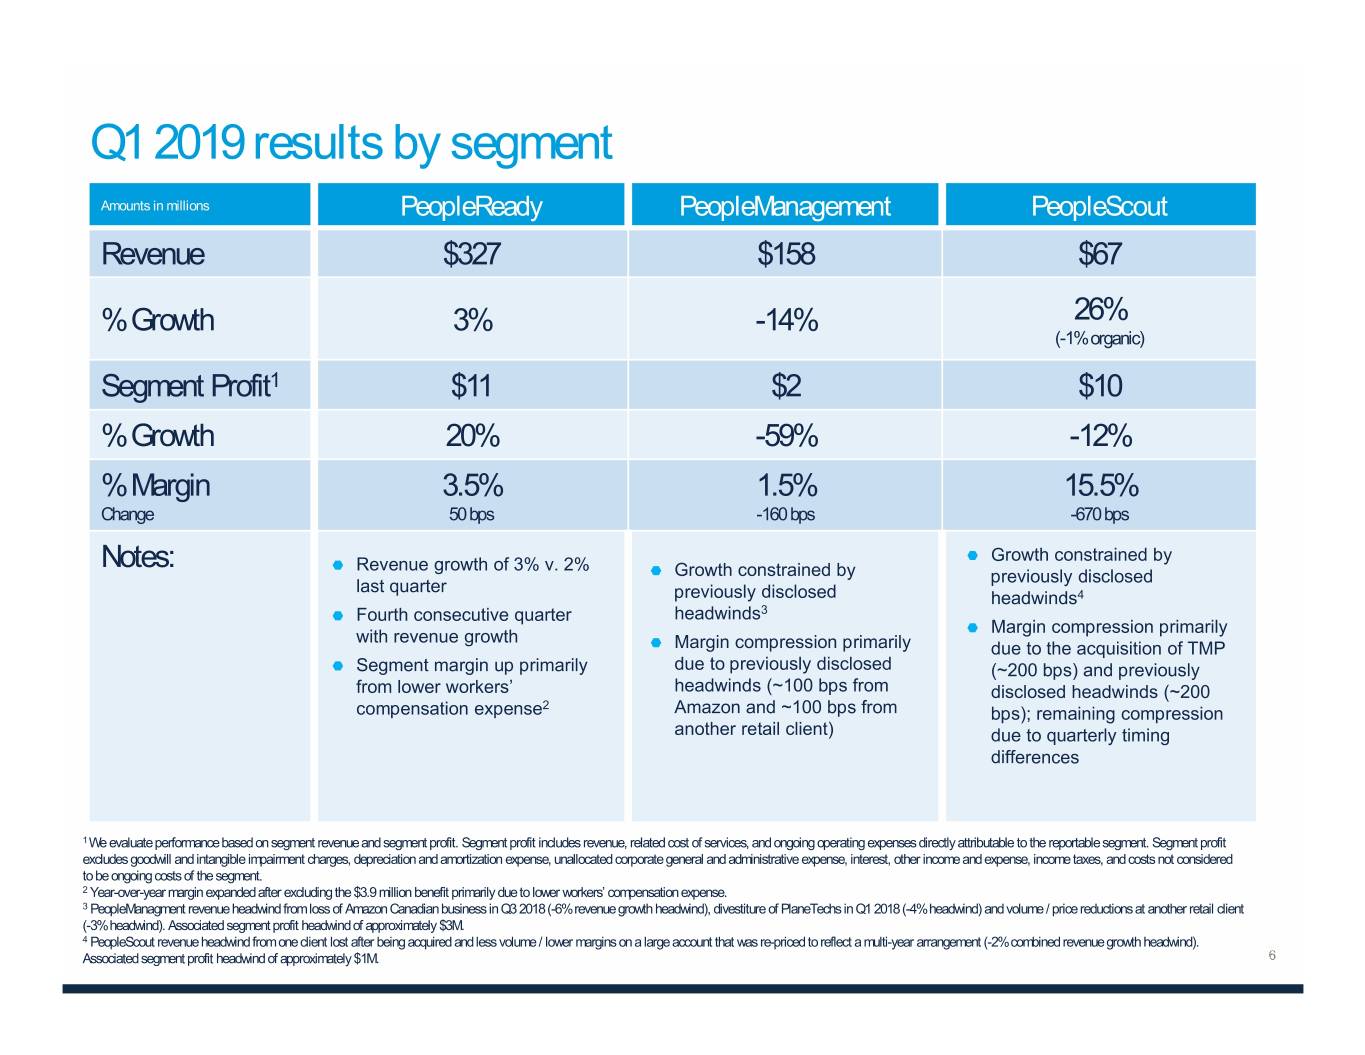
Q1 2019 results by segment Amounts in millions PeopleReady PeopleManagement PeopleScout Revenue $327 $158 $67 % Growth 3% -14% 26% (-1% organic) Segment Profit1 $11 $2 $10 % Growth 20% -59% -12% % Margin 3.5% 1.5% 15.5% Change 50 bps -160 bps -670 bps Growth constrained by Notes: Revenue growth of 3% v. 2% Growth constrained by previously disclosed last quarter previously disclosed headwinds4 Fourth consecutive quarter headwinds3 Margin compression primarily with revenue growth Margin compression primarily due to the acquisition of TMP Segment margin up primarily due to previously disclosed (~200 bps) and previously from lower workers’ headwinds (~100 bps from disclosed headwinds (~200 compensation expense2 Amazon and ~100 bps from bps); remaining compression another retail client) due to quarterly timing differences 1 We evaluate performance based on segment revenue and segment profit. Segment profit includes revenue, related cost of services, and ongoing operating expenses directly attributable to the reportable segment. Segment profit excludes goodwill and intangible impairment charges, depreciation and amortization expense, unallocated corporate general and administrative expense, interest, other income and expense, income taxes, and costs not considered to be ongoing costs of the segment. 2 Year-over-year margin expanded after excluding the $3.9 million benefit primarily due to lower workers’ compensation expense. 3 PeopleManagment revenue headwind from loss of Amazon Canadian business in Q3 2018 (-6% revenue growth headwind), divestiture of PlaneTechs in Q1 2018 (-4% headwind) and volume / price reductions at another retail client (-3% headwind). Associated segment profit headwind of approximately $3M. 4 PeopleScout revenue headwind from one client lost after being acquired and less volume / lower margins on a large account that was re-priced to reflect a multi-year arrangement (-2% combined revenue growth headwind). Associated segment profit headwind of approximately $1M.
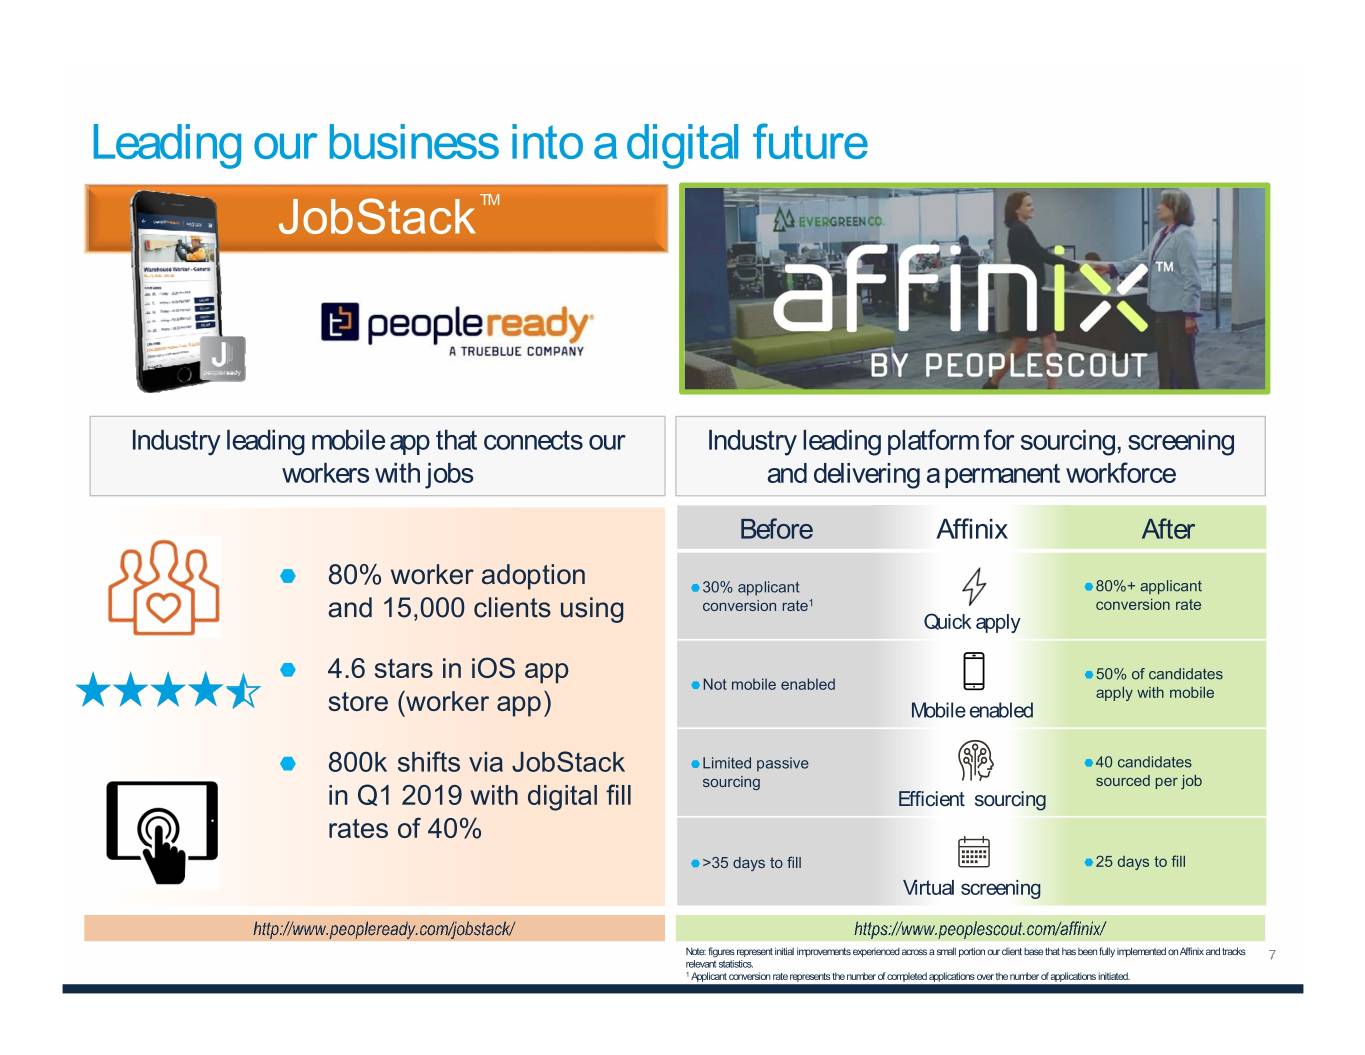
Leading our business into a digital future JobStack TM Industry leading mobile app that connects our Industry leading platform for sourcing, screening workers with jobs and delivering a permanent workforce Before Affinix After 80% worker adoption 30% applicant 80%+ applicant conversion rate1 conversion rate and 15,000 clients using Quick apply 4.6 stars in iOS app 50% of candidates Not mobile enabled apply with mobile store (worker app) Mobile enabled 800k shifts via JobStack Limited passive 40 candidates sourcing sourced per job in Q1 2019 with digital fill Efficient sourcing rates of 40% >35 days to fill 25 days to fill Virtual screening Note: figures represent initial improvements experienced across a small portion our client base that has been fully implemented on Affinix and tracks relevant statistics. 1 Applicant conversion rate represents the number of completed applications over the number of applications initiated.
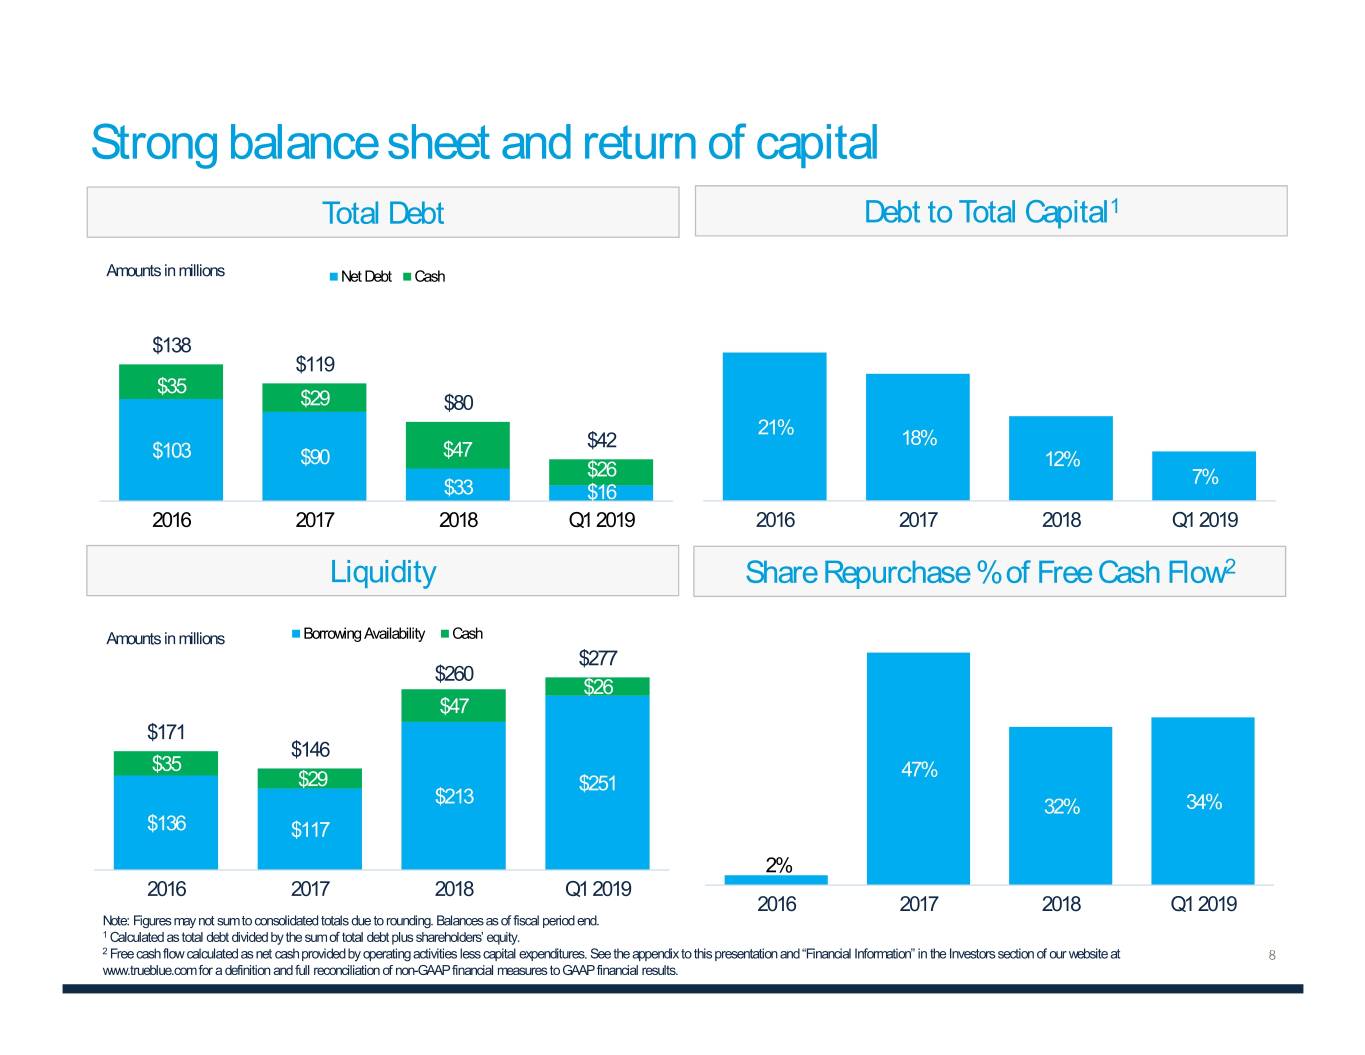
Strong balance sheet and return of capital Total Debt Debt to Total Capital1 Amounts in millions Net Debt Cash $138 $119 $35 $29 $80 21% $42 18% $103 $90 $47 12% $26 7% $33 $16 2016 2017 2018 Q1 2019 2016 2017 2018 Q1 2019 Liquidity Share Repurchase % of Free Cash Flow2 Amounts in millions Borrowing Availability Cash 50% $277 45% $260 $26 40% $47 35% $171 30% $146 $35 25% 47% $29 $251 20% $213 15% 32% 34% $136 $117 10% 5% 2% 2016 2017 2018 Q1 2019 0% 2016 2017 2018 Q1 2019 Note: Figures may not sum to consolidated totals due to rounding. Balances as of fiscal period end. 1 Calculated as total debt divided by the sum of total debt plus shareholders’ equity. 2 Free cash flow calculated as net cash provided by operating activities less capital expenditures. See the appendix to this presentation and “Financial Information” in the Investors section of our website at www.trueblue.com for a definition and full reconciliation of non-GAAP financial measures to GAAP financial results.

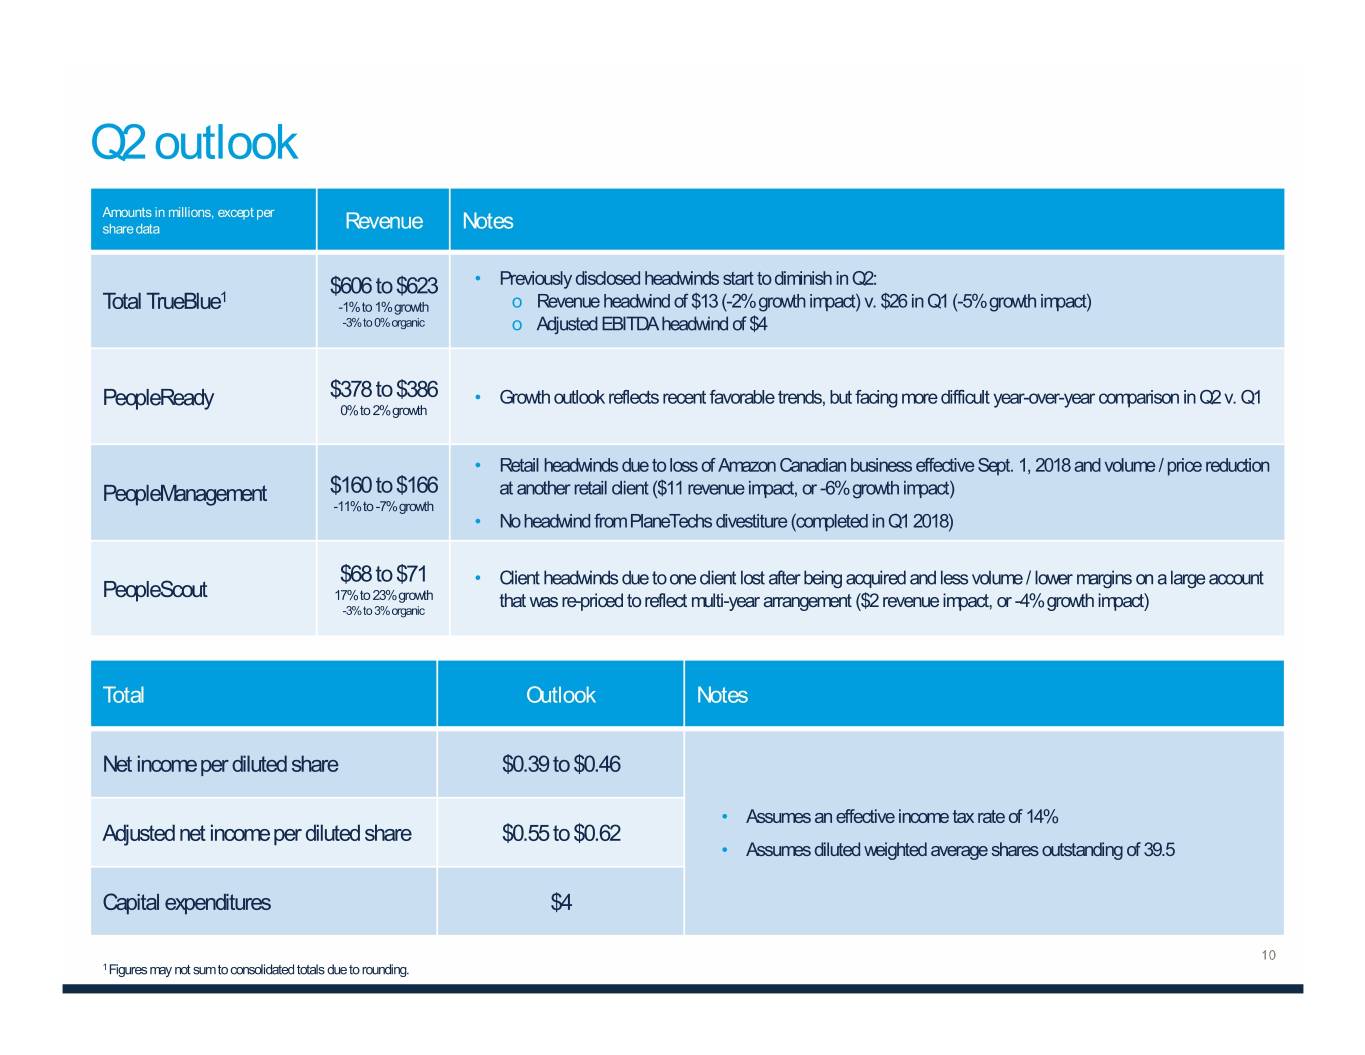
Q2 outlook Amounts in millions, except per share data Revenue Notes • Previously disclosed headwinds start to diminish in Q2: 1 $606 to $623 Total TrueBlue -1% to 1% growth o Revenue headwind of $13 (-2% growth impact) v. $26 in Q1 (-5% growth impact) -3% to 0% organic o Adjusted EBITDA headwind of $4 PeopleReady $378 to $386 • Growth outlook reflects recent favorable trends, but facing more difficult year-over-year comparison in Q2 v. Q1 0% to 2% growth • Retail headwinds due to loss of Amazon Canadian business effective Sept. 1, 2018 and volume / price reduction PeopleManagement $160 to $166 at another retail client ($11 revenue impact, or -6% growth impact) -11% to -7% growth • No headwind from PlaneTechs divestiture (completed in Q1 2018) $68 to $71 • Client headwinds due to one client lost after being acquired and less volume / lower margins on a large account PeopleScout 17% to 23% growth that was re-priced to reflect multi-year arrangement ($2 revenue impact, or -4% growth impact) -3% to 3% organic Total Outlook Notes Net income per diluted share $0.39 to $0.46 • Assumes an effective income tax rate of 14% Adjusted net income per diluted share $0.55 to $0.62 • Assumes diluted weighted average shares outstanding of 39.5 Capital expenditures $4 1 Figures may not sum to consolidated totals due to rounding.
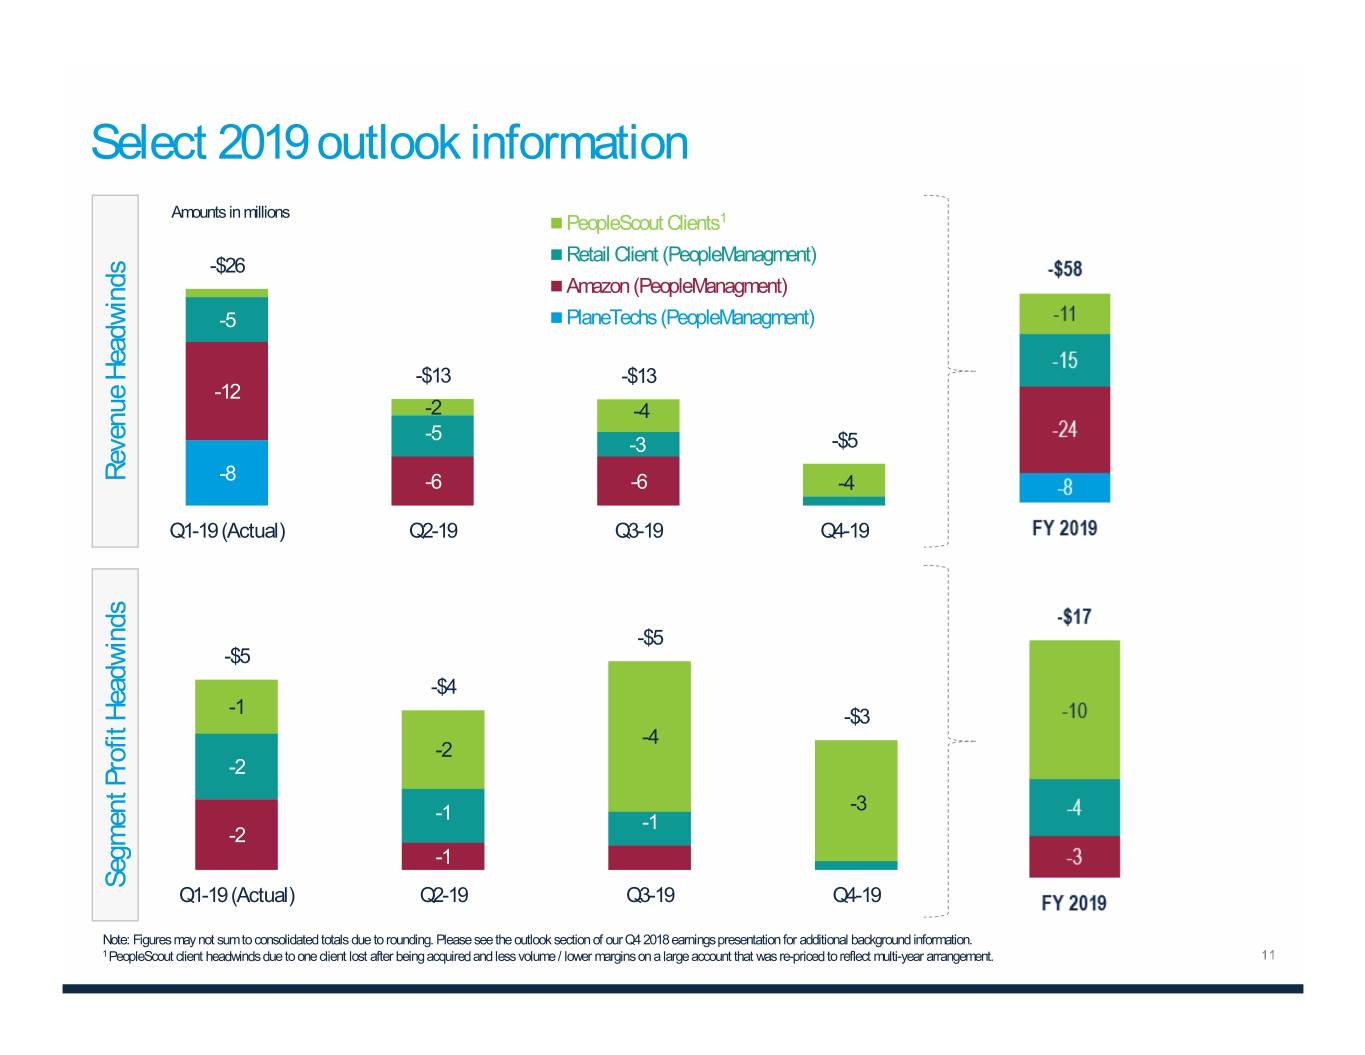
Select 2019 outlook information Amounts in millions PeopleScout Clients1 Retail Client (PeopleManagment) -$26 Amazon (PeopleManagment) -5 PlaneTechs (PeopleManagment) -$13 -$13 -12 -2 -4 -5 -3 -$5 Revenue Headwinds -8 -6 -6 -4 Q1-19 (Actual) Q2-19 Q3-19 Q4-19 -$5 -$5 -$4 -1 -$3 -4 -2 -2 -3 -1 -1 -2 -1 Segment Profit Headwinds Q1-19 (Actual) Q2-19 Q3-19 Q4-19 Note: Figures may not sum to consolidated totals due to rounding. Please see the outlook section of our Q4 2018 earnings presentation for additional background information. 1 PeopleScout client headwinds due to one client lost after being acquired and less volume / lower margins on a large account that was re-priced to reflect multi-year arrangement.

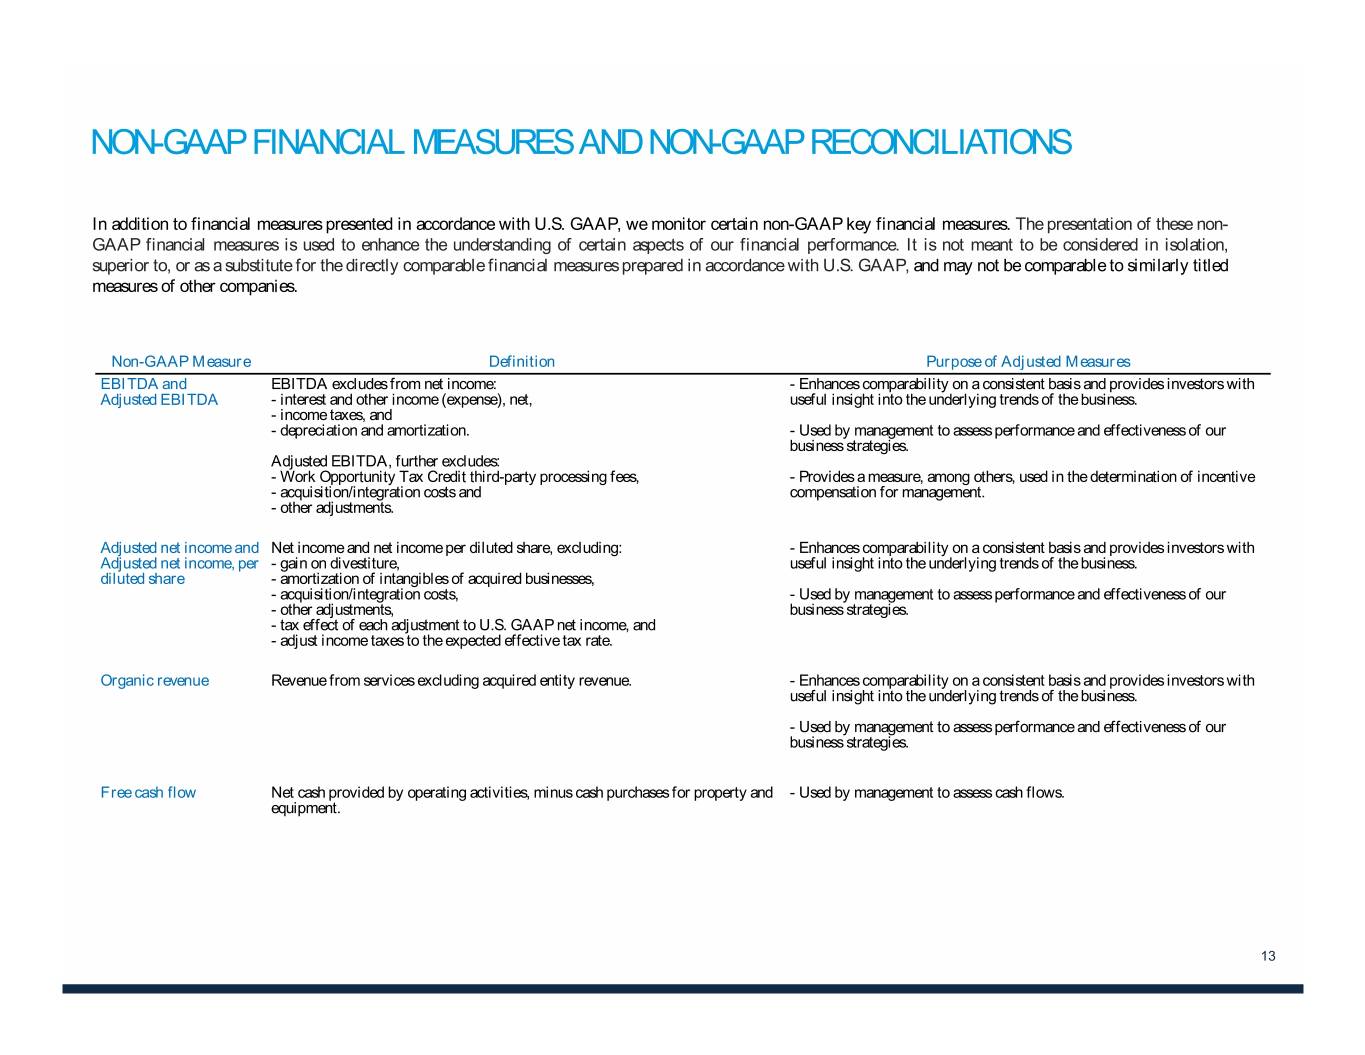
NON-GAAP FINANCIAL MEASURES AND NON-GAAP RECONCILIATIONS In addition to financial measures presented in accordance with U.S. GAAP, we monitor certain non-GAAP key financial measures. The presentation of these non- GAAP financial measures is used to enhance the understanding of certain aspects of our financial performance. It is not meant to be considered in isolation, superior to, or as a substitute for the directly comparable financial measures prepared in accordance with U.S. GAAP, and may not be comparable to similarly titled measures of other companies. Non-GAAP Measure Definition Purpose of Adjusted Measures EBITDA and EBITDA excludes from net income: - Enhances comparability on a consistent basis and provides investors with Adjusted EBITDA - interest and other income (expense), net, useful insight into the underlying trends of the business. - income taxes, and - depreciation and amortization. - Used by management to assess performance and effectiveness of our business strategies. Adjusted EBITDA, further excludes: - Work Opportunity Tax Credit third-party processing fees, - Provides a measure, among others, used in the determination of incentive - acquisition/integration costs and compensation for management. - other adjustments. Adjusted net income and Net income and net income per diluted share, excluding: - Enhances comparability on a consistent basis and provides investors with Adjusted net income, per - gain on divestiture, useful insight into the underlying trends of the business. diluted share - amortization of intangibles of acquired businesses, - acquisition/integration costs, - Used by management to assess performance and effectiveness of our - other adjustments, business strategies. - tax effect of each adjustment to U.S. GAAP net income, and - adjust income taxes to the expected effective tax rate. Organic revenue Revenue from services excluding acquired entity revenue. - Enhances comparability on a consistent basis and provides investors with useful insight into the underlying trends of the business. - Used by management to assess performance and effectiveness of our business strategies. Free cash flow Net cash provided by operating activities, minus cash purchases for property and - Used by management to assess cash flows. equipment. 13
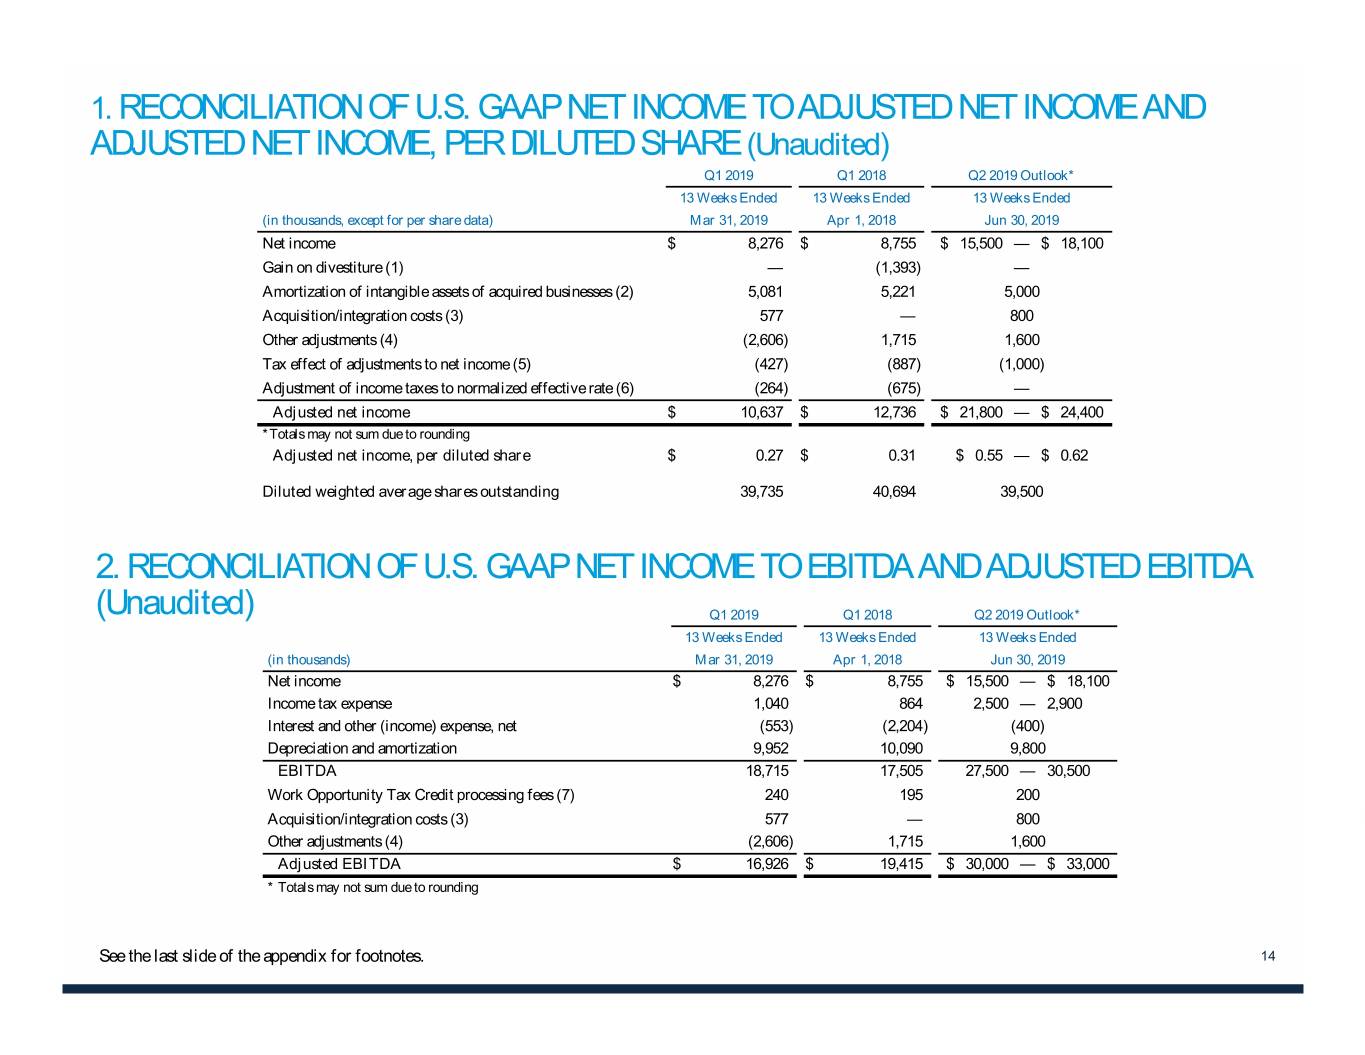
1. RECONCILIATION OF U.S. GAAP NET INCOME TO ADJUSTED NET INCOME AND ADJUSTED NET INCOME, PER DILUTED SHARE (Unaudited) Q1 2019 Q1 2018 Q2 2019 Outlook* 13 Weeks Ended 13 Weeks Ended 13 Weeks Ended (in thousands, except for per share data) Mar 31, 2019 Apr 1, 2018 Jun 30, 2019 Net income $ 8,276 $ 8,755 $ 15,500 — $ 18,100 Gain on divestiture (1) — (1,393) — Amortization of intangible assets of acquired businesses (2) 5,081 5,221 5,000 Acquisition/integration costs (3) 577 — 800 Other adjustments (4) (2,606) 1,715 1,600 Tax effect of adjustments to net income (5) (427) (887) (1,000) Adjustment of income taxes to normalized effective rate (6) (264) (675) — Adjusted net income $ 10,637 $ 12,736 $ 21,800 — $ 24,400 *Totals may not sum due to rounding Adjusted net income, per diluted share $ 0.27 $ 0.31 $ 0.55 — $ 0.62 Diluted weighted average shares outstanding 39,735 40,694 39,500 2. RECONCILIATION OF U.S. GAAP NET INCOME TO EBITDA AND ADJUSTED EBITDA (Unaudited) Q1 2019 Q1 2018 Q2 2019 Outlook* 13 Weeks Ended 13 Weeks Ended 13 Weeks Ended (in thousands) Mar 31, 2019 Apr 1, 2018 Jun 30, 2019 Net income $ 8,276 $ 8,755 $ 15,500 — $ 18,100 Income tax expense 1,040 864 2,500 — 2,900 Interest and other (income) expense, net (553) (2,204) (400) Depreciation and amortization 9,952 10,090 9,800 EBITDA 18,715 17,505 27,500 — 30,500 Work Opportunity Tax Credit processing fees (7) 240 195 200 Acquisition/integration costs (3) 577 — 800 Other adjustments (4) (2,606) 1,715 1,600 Adjusted EBITDA $ 16,926 $ 19,415 $ 30,000 — $ 33,000 * Totals may not sum due to rounding See the last slide of the appendix for footnotes. 14
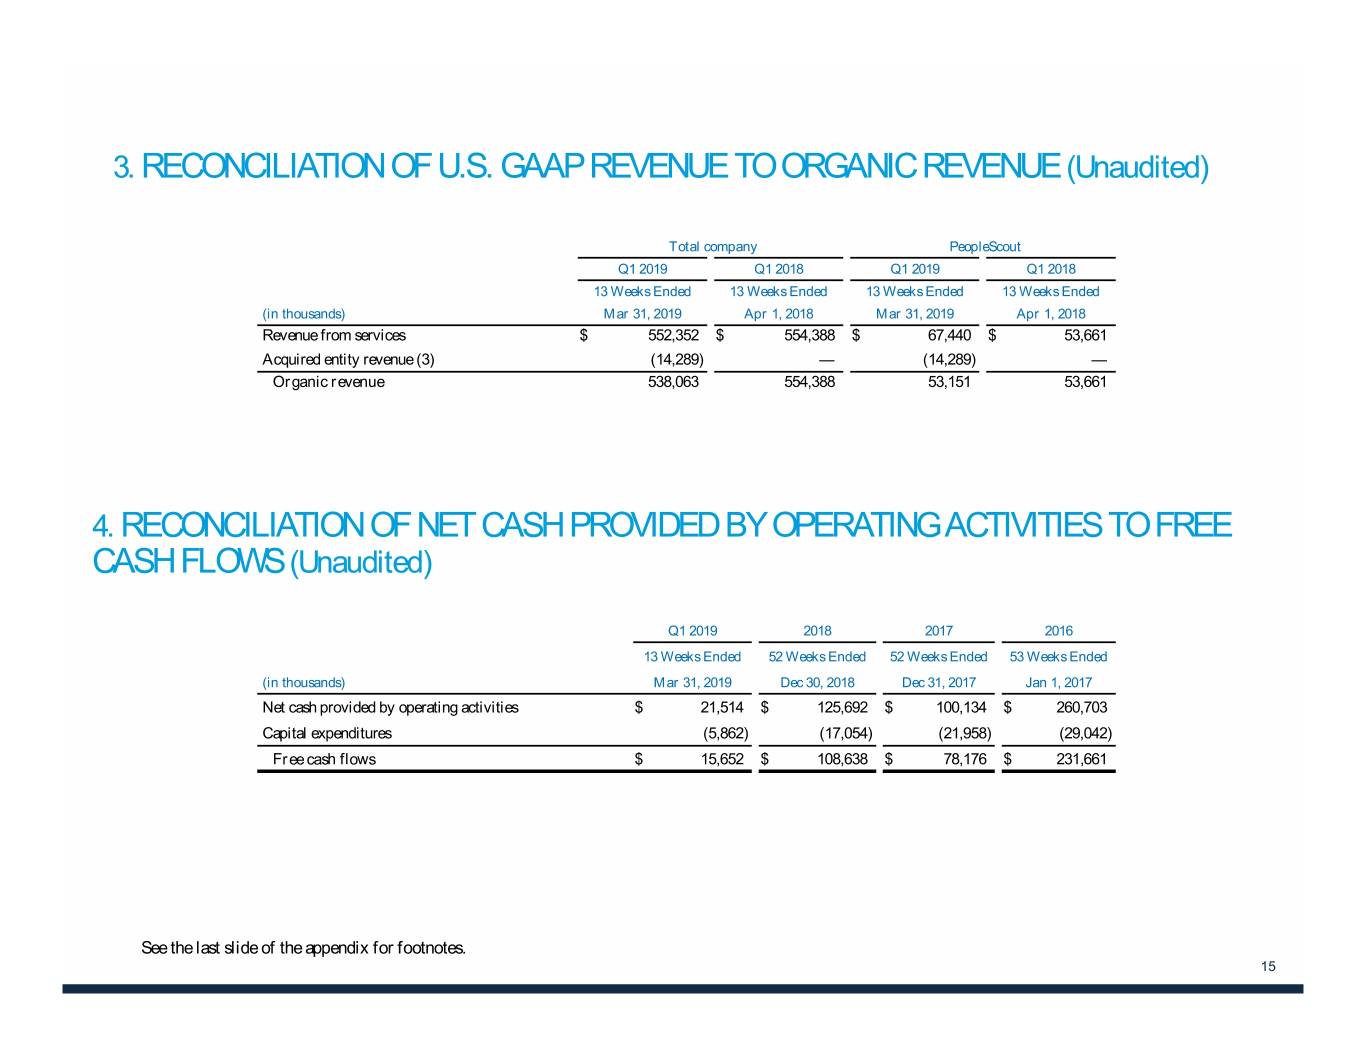
3. RECONCILIATION OF U.S. GAAP REVENUE TO ORGANIC REVENUE (Unaudited) Total company PeopleScout Q1 2019 Q1 2018 Q1 2019 Q1 2018 13 Weeks Ended 13 Weeks Ended 13 Weeks Ended 13 Weeks Ended (in thousands) Mar 31, 2019 Apr 1, 2018 Mar 31, 2019 Apr 1, 2018 Revenue from services $ 552,352 $ 554,388 $ 67,440 $ 53,661 Acquired entity revenue (3) (14,289) — (14,289) — Organic revenue 538,063 554,388 53,151 53,661 4. RECONCILIATION OF NET CASH PROVIDED BY OPERATING ACTIVITIES TO FREE CASH FLOWS (Unaudited) Q1 2019 2018 2017 2016 13 Weeks Ended 52 Weeks Ended 52 Weeks Ended 53 Weeks Ended (in thousands) Mar 31, 2019 Dec 30, 2018 Dec 31, 2017 Jan 1, 2017 Net cash provided by operating activities $ 21,514 $ 125,692 $ 100,134 $ 260,703 Capital expenditures (5,862) (17,054) (21,958) (29,042) Free cash flows $ 15,652 $ 108,638 $ 78,176 $ 231,661 See the last slide of the appendix for footnotes. 15
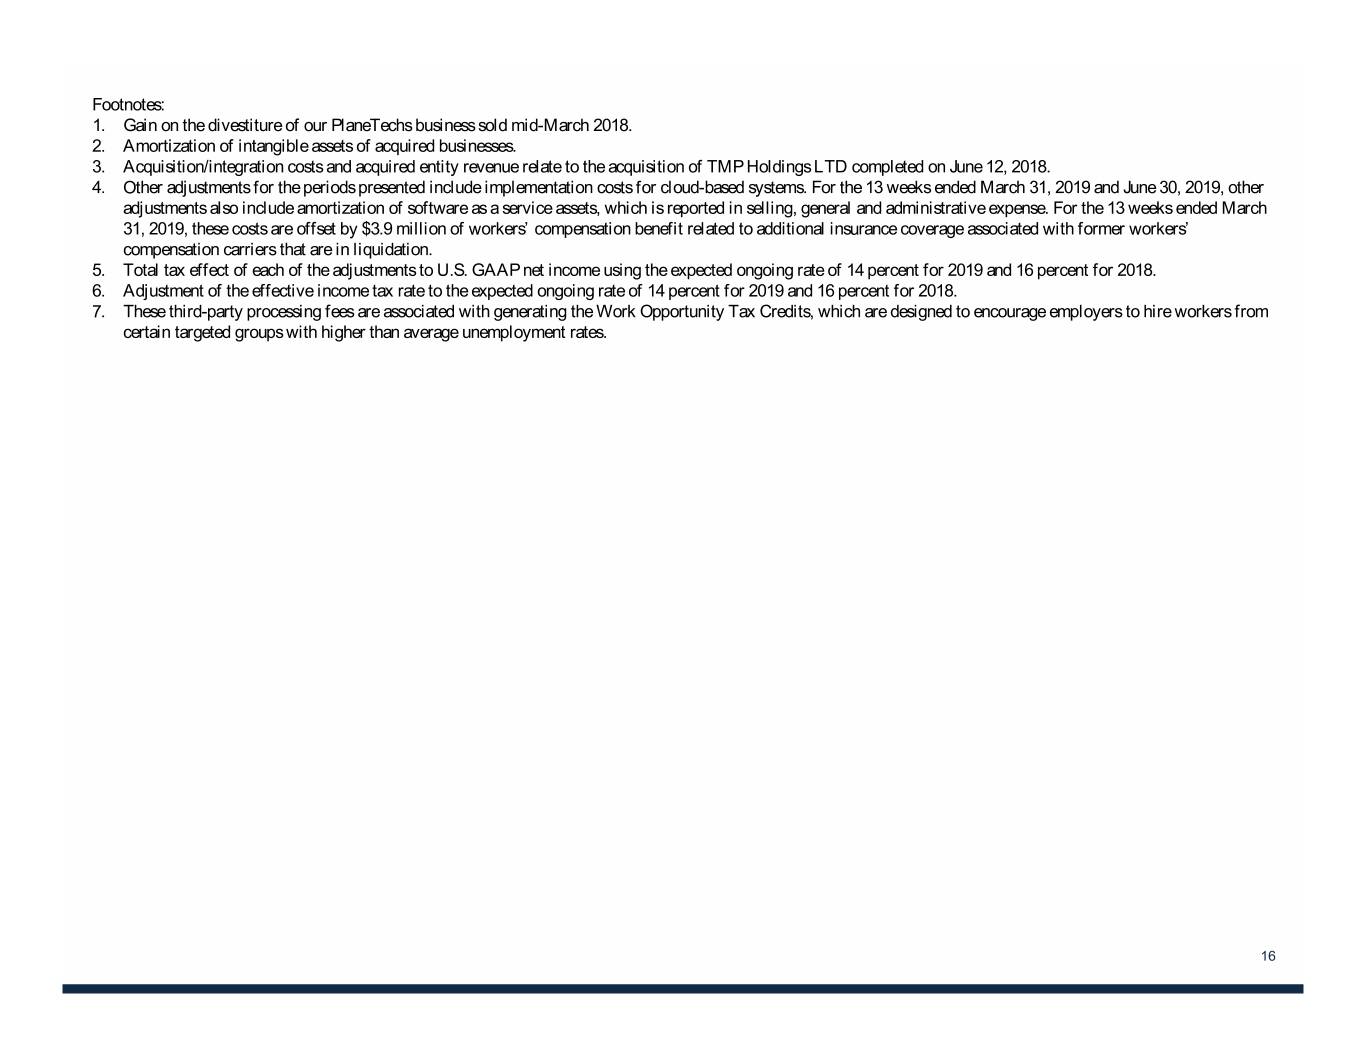
Footnotes: 1. Gain on the divestiture of our PlaneTechs business sold mid-March 2018. 2. Amortization of intangible assets of acquired businesses. 3. Acquisition/integration costs and acquired entity revenue relate to the acquisition of TMP Holdings LTD completed on June 12, 2018. 4. Other adjustments for the periods presented include implementation costs for cloud-based systems. For the 13 weeks ended March 31, 2019 and June 30, 2019, other adjustments also include amortization of software as a service assets, which is reported in selling, general and administrative expense. For the 13 weeks ended March 31, 2019, these costs are offset by $3.9 million of workers’ compensation benefit related to additional insurance coverage associated with former workers’ compensation carriers that are in liquidation. 5. Total tax effect of each of the adjustments to U.S. GAAP net income using the expected ongoing rate of 14 percent for 2019 and 16 percent for 2018. 6. Adjustment of the effective income tax rate to the expected ongoing rate of 14 percent for 2019 and 16 percent for 2018. 7. These third-party processing fees are associated with generating the Work Opportunity Tax Credits, which are designed to encourage employers to hire workers from certain targeted groups with higher than average unemployment rates. 16