
July 30, 2018 www.TrueBlue.com
Forward-Looking Statements
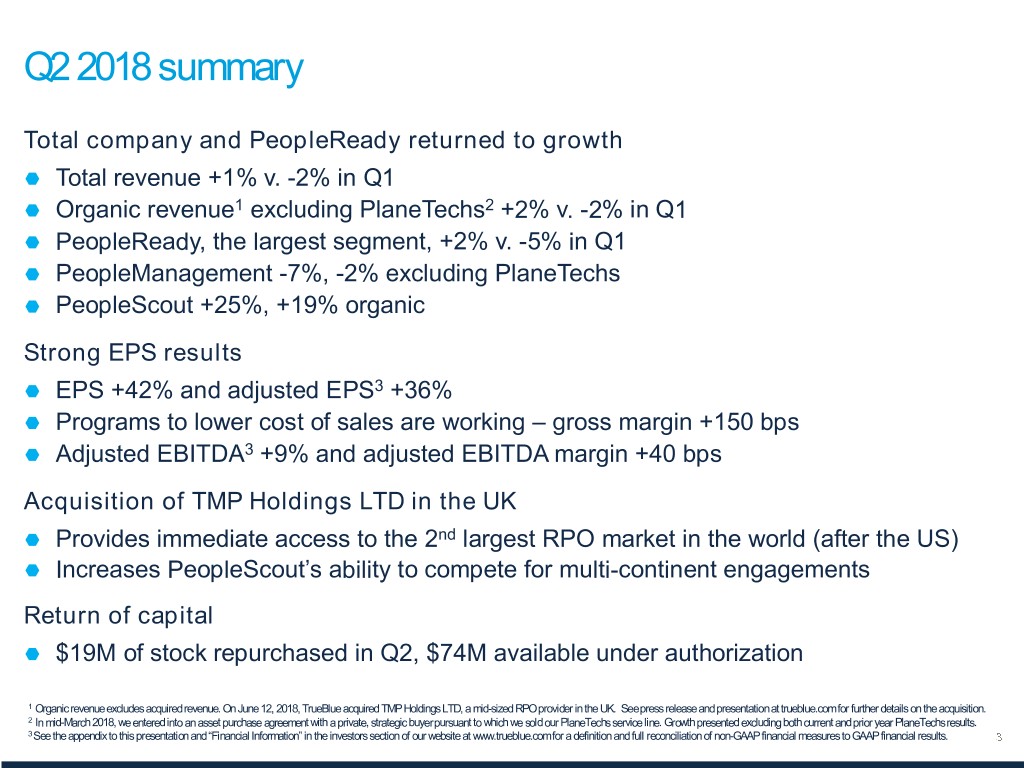
Q2 2018 summary Total company and PeopleReady returned to growth Total revenue +1% v. -2% in Q1 Organic revenue1 excluding PlaneTechs2 +2% v. -2% in Q1 PeopleReady, the largest segment, +2% v. -5% in Q1 PeopleManagement -7%, -2% excluding PlaneTechs PeopleScout +25%, +19% organic Strong EPS results EPS +42% and adjusted EPS3 +36% Programs to lower cost of sales are working – gross margin +150 bps Adjusted EBITDA3 +9% and adjusted EBITDA margin +40 bps Acquisition of TMP Holdings LTD in the UK Provides immediate access to the 2nd largest RPO market in the world (after the US) Increases PeopleScout’s ability to compete for multi-continent engagements Return of capital $19M of stock repurchased in Q2, $74M available under authorization 1 Organic revenue excludes acquired revenue. On June 12, 2018, TrueBlue acquired TMP Holdings LTD, a mid-sized RPO provider in the UK. See press release and presentation at trueblue.com for further details on the acquisition. 2 In mid-March 2018, we entered into an asset purchase agreement with a private, strategic buyer pursuant to which we sold our PlaneTechs service line. Growth presented excluding both current and prior year PlaneTechs results. 3 See the appendix to this presentation and “Financial Information” in the investors section of our website at www.trueblue.com for a definition and full reconciliation of non-GAAP financial measures to GAAP financial results.
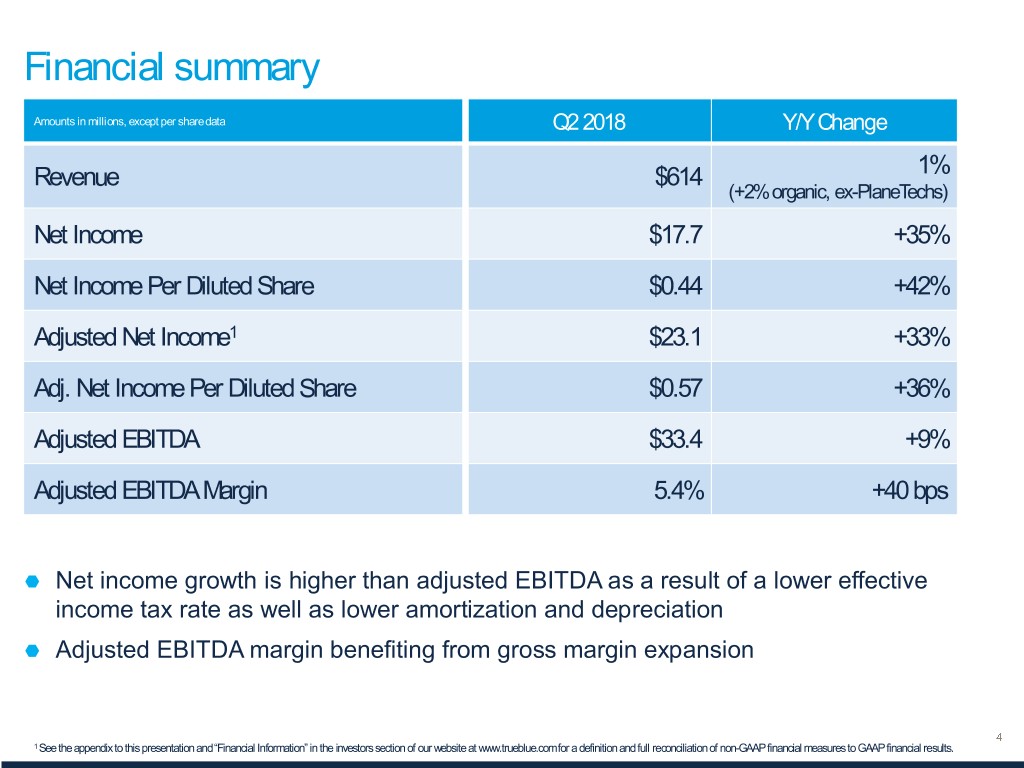
Financial summary Amounts in millions, except per share data Q2 2018 Y/Y Change Revenue $614 1% (+2% organic, ex-PlaneTechs) Net Income $17.7 +35% Net Income Per Diluted Share $0.44 +42% Adjusted Net Income1 $23.1 +33% Adj. Net Income Per Diluted Share $0.57 +36% Adjusted EBITDA $33.4 +9% Adjusted EBITDA Margin 5.4% +40 bps Net income growth is higher than adjusted EBITDA as a result of a lower effective income tax rate as well as lower amortization and depreciation Adjusted EBITDA margin benefiting from gross margin expansion 1 See the appendix to this presentation and “Financial Information” in the investors section of our website at www.trueblue.com for a definition and full reconciliation of non-GAAP financial measures to GAAP financial results.
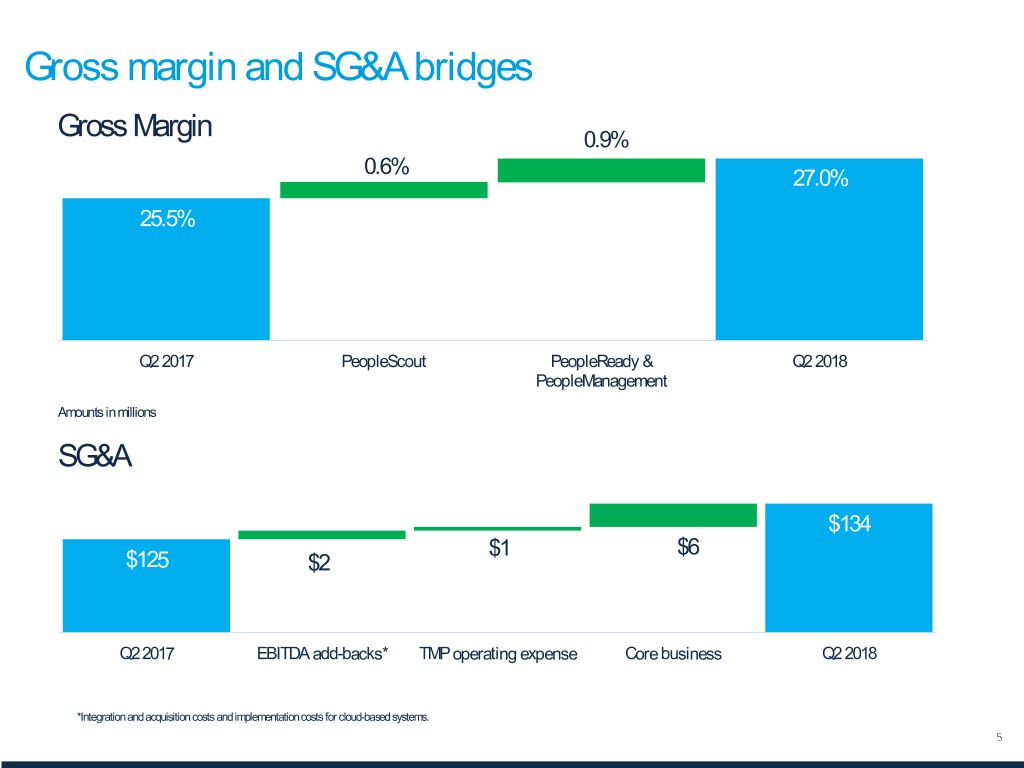
Gross margin and SG&A bridges Gross Margin 0.9% 0.6% 27.0% 25.5% Q2 2017 PeopleScout PeopleReady & Q2 2018 PeopleManagement Amounts in millions SG&A $134 $1 $6 $125 $2 Q2 2017 EBITDA add-backs* TMP operating expense Core business Q2 2018 *Integration and acquisition costs and implementation costs for cloud-based systems.
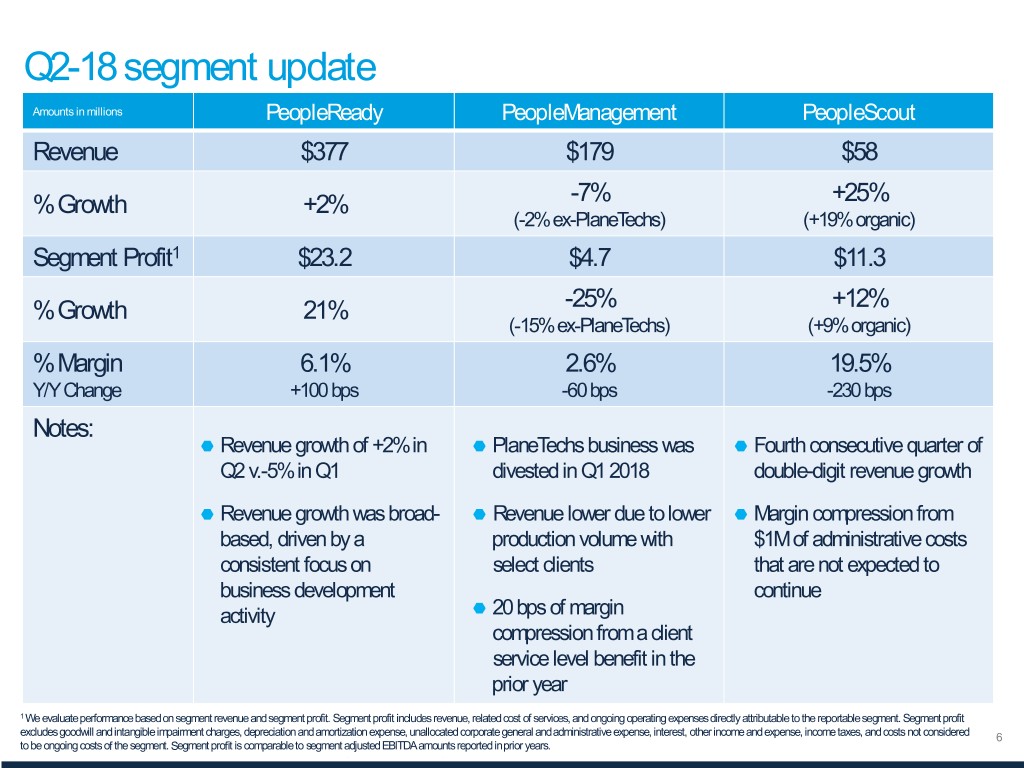
Q2-18 segment update Amounts in millions PeopleReady PeopleManagement PeopleScout Revenue $377 $179 $58 % Growth +2% -7% +25% (-2% ex-PlaneTechs) (+19% organic) Segment Profit1 $23.2 $4.7 $11.3 % Growth 21% -25% +12% (-15% ex-PlaneTechs) (+9% organic) % Margin 6.1% 2.6% 19.5% Y/Y Change +100 bps -60 bps -230 bps Notes: Revenue growth of +2% in PlaneTechs business was Fourth consecutive quarter of Q2 v.-5% in Q1 divested in Q1 2018 double-digit revenue growth Revenue growth was broad- Revenue lower due to lower Margin compression from based, driven by a production volume with $1M of administrative costs consistent focus on select clients that are not expected to business development continue activity 20 bps of margin compression from a client service level benefit in the prior year 1 We evaluate performance based on segment revenue and segment profit. Segment profit includes revenue, related cost of services, and ongoing operating expenses directly attributable to the reportable segment. Segment profit excludes goodwill and intangible impairment charges, depreciation and amortization expense, unallocated corporate general and administrative expense, interest, other income and expense, income taxes, and costs not considered 6 to be ongoing costs of the segment. Segment profitQ2 is comparable-18 Strategic to segment adjusted Messages EBITDA amounts reported in prior years. June 2018
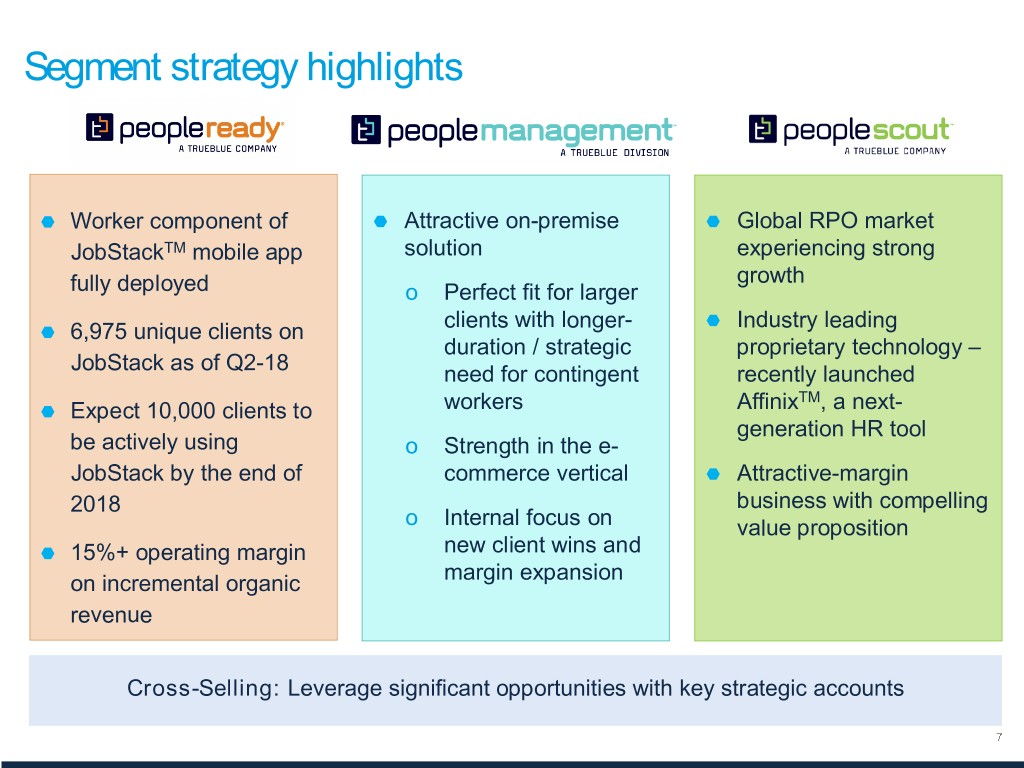
Segment strategy highlights Worker component of Attractive on-premise Global RPO market JobStackTM mobile app solution experiencing strong fully deployed growth o Perfect fit for larger clients with longer- Industry leading 6,975 unique clients on duration / strategic proprietary technology – JobStack as of Q2-18 need for contingent recently launched TM Expect 10,000 clients to workers Affinix , a next- generation HR tool be actively using o Strength in the e- JobStack by the end of commerce vertical Attractive-margin 2018 business with compelling o Internal focus on value proposition 15%+ operating margin new client wins and margin expansion on incremental organic revenue Cross-Selling: Leverage significant opportunities with key strategic accounts
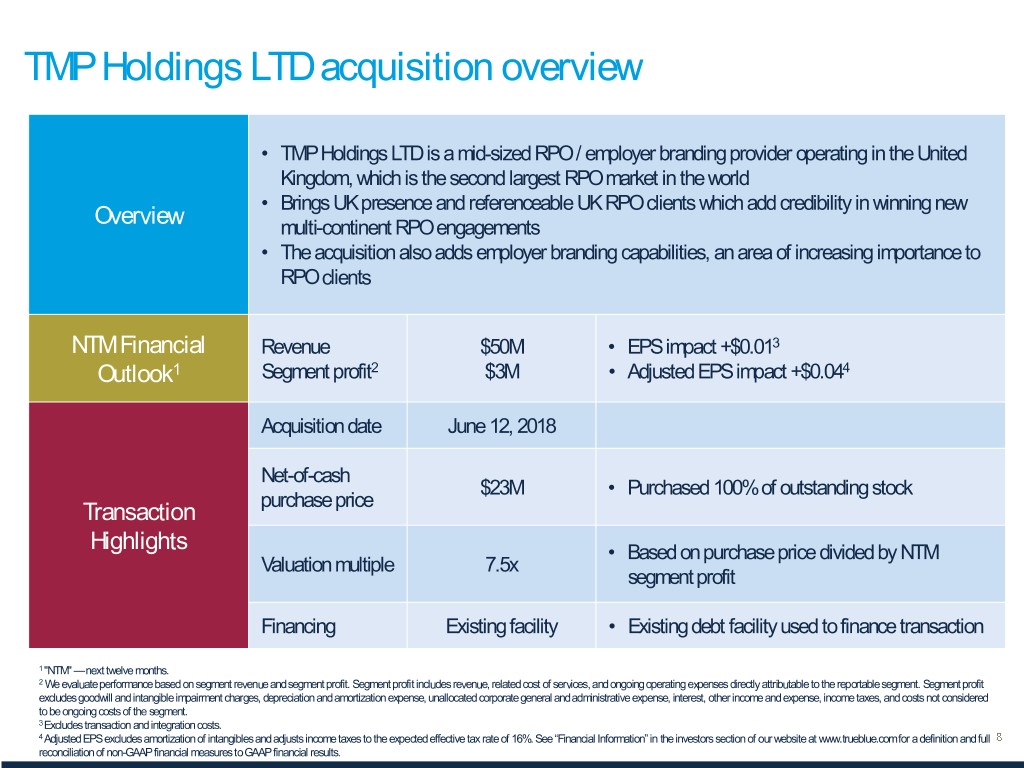
TMP Holdings LTD acquisition overview • TMP Holdings LTD is a mid-sized RPO / employer branding provider operating in the United Kingdom, which is the second largest RPO market in the world • Brings UK presence and referenceable UK RPO clients which add credibility in winning new Overview multi-continent RPO engagements • The acquisition also adds employer branding capabilities, an area of increasing importance to RPO clients NTM Financial Revenue $50M • EPS impact +$0.013 Outlook1 Segment profit2 $3M • Adjusted EPS impact +$0.044 Acquisition date June 12, 2018 Net-of-cash $23M • Purchased 100% of outstanding stock purchase price Transaction Highlights • Based on purchase price divided by NTM Valuation multiple 7.5x segment profit Financing Existing facility • Existing debt facility used to finance transaction 1 "NTM" — next twelve months. 2 We evaluate performance based on segment revenue and segment profit. Segment profit includes revenue, related cost of services, and ongoing operating expenses directly attributable to the reportable segment. Segment profit excludes goodwill and intangible impairment charges, depreciation and amortization expense, unallocated corporate general and administrative expense, interest, other income and expense, income taxes, and costs not considered to be ongoing costs of the segment. 3 Excludes transaction and integration costs. 4 Adjusted EPS excludes amortization of intangibles and adjusts income taxes to the expected effective tax rate of 16%. See “Financial Information” in the investors section of our website at www.trueblue.com for a definition and full reconciliation of non-GAAP financial measures to GAAP financial results.
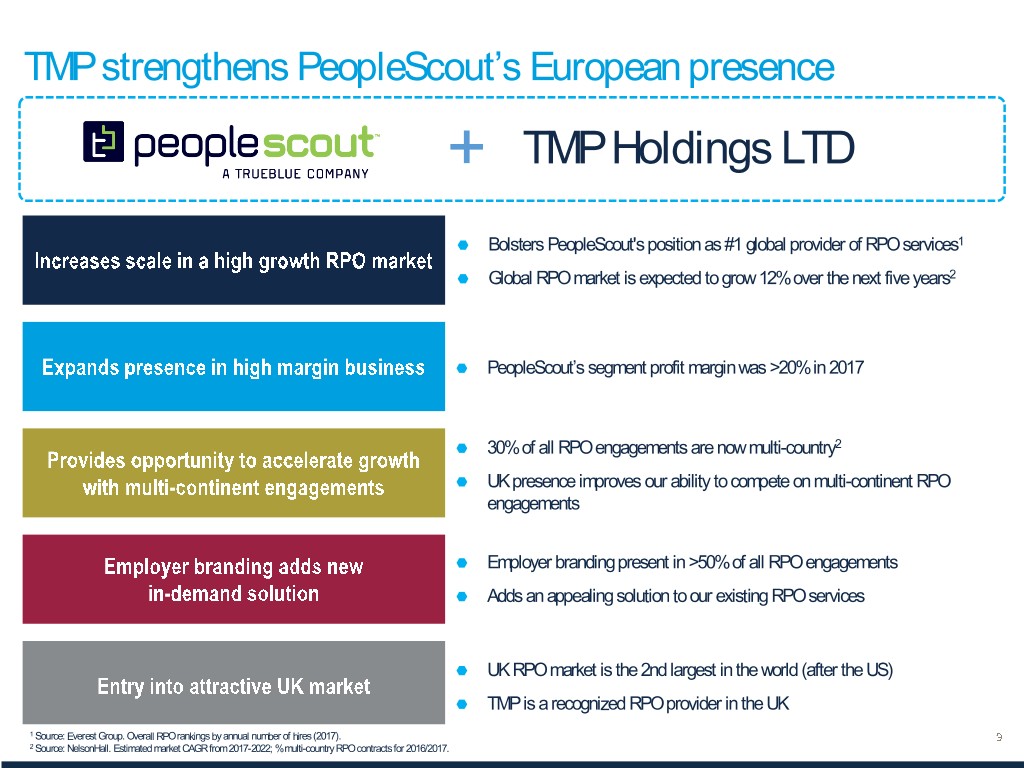
TMP strengthens PeopleScout’s European presence + TMP Holdings LTD Bolsters PeopleScout's position as #1 global provider of RPO services1 Global RPO market is expected to grow 12% over the next five years2 PeopleScout’s segment profit margin was >20% in 2017 30% of all RPO engagements are now multi-country2 UK presence improves our ability to compete on multi-continent RPO engagements Employer branding present in >50% of all RPO engagements Adds an appealing solution to our existing RPO services UK RPO market is the 2nd largest in the world (after the US) TMP is a recognized RPO provider in the UK 1 Source: Everest Group. Overall RPO rankings by annual number of hires (2017). 2 Source: NelsonHall. Estimated market CAGR from 2017-2022; % multi-country RPO contracts for 2016/2017.
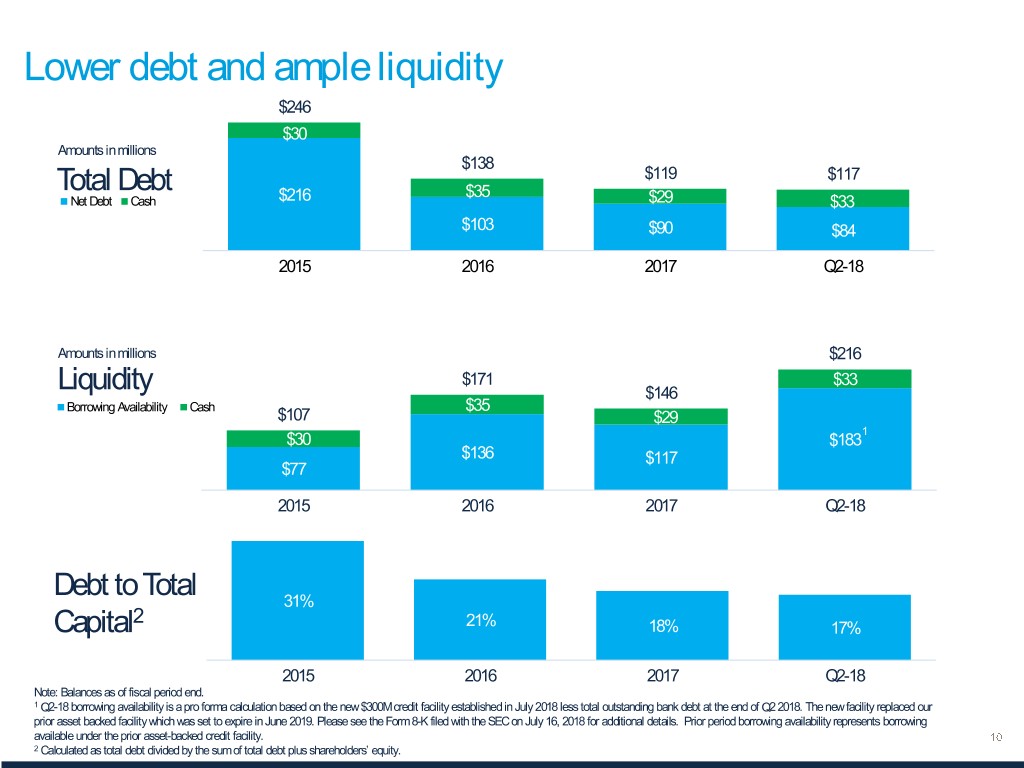
Lower debt and ample liquidity $246 $30 Amounts in millions $138 $119 $117 Total Debt $35 Net Debt Cash $216 $29 $33 $103 $90 $84 2015 2016 2017 Q2-18 Amounts in millions $216 $171 $33 Liquidity $146 Borrowing Availability Cash $35 $107 $29 1 $30 $183 $136 $117 $77 2015 2016 2017 Q2-18 Debt to Total 31% 2 Capital 21% 18% 17% 2015 2016 2017 Q2-18 Note: Balances as of fiscal period end. 1 Q2-18 borrowing availability is a pro forma calculation based on the new $300M credit facility established in July 2018 less total outstanding bank debt at the end of Q2 2018. The new facility replaced our prior asset backed facility which was set to expire in June 2019. Please see the Form 8-K filed with the SEC on July 16, 2018 for additional details. Prior period borrowing availability represents borrowing available under the prior asset-backed credit facility. 2 Calculated as total debt divided by the sum of total debt plus shareholders’ equity.

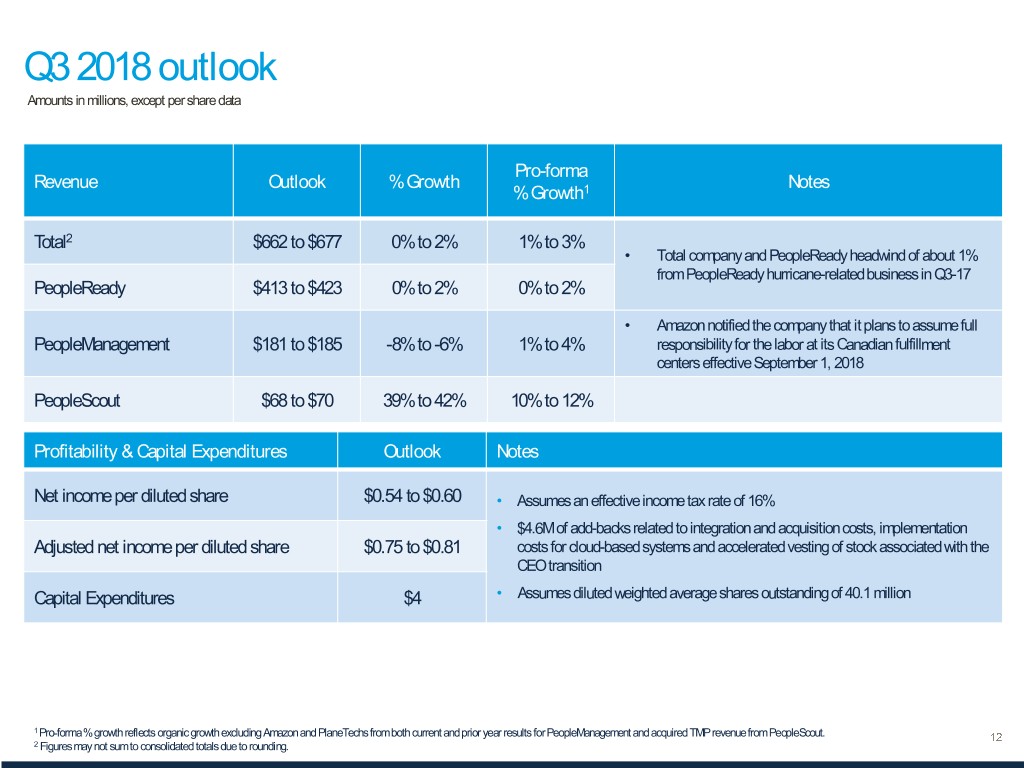
Q3 2018 outlook Amounts in millions, except per share data Pro-forma Revenue Outlook % Growth Notes % Growth1 Total2 $662 to $677 0% to 2% 1% to 3% • Total company and PeopleReady headwind of about 1% from PeopleReady hurricane-related business in Q3-17 PeopleReady $413 to $423 0% to 2% 0% to 2% • Amazon notified the company that it plans to assume full PeopleManagement $181 to $185 -8% to -6% 1% to 4% responsibility for the labor at its Canadian fulfillment centers effective September 1, 2018 PeopleScout $68 to $70 39% to 42% 10% to 12% Profitability & Capital Expenditures Outlook Notes Net income per diluted share $0.54 to $0.60 • Assumes an effective income tax rate of 16% • $4.6M of add-backs related to integration and acquisition costs, implementation Adjusted net income per diluted share $0.75 to $0.81 costs for cloud-based systems and accelerated vesting of stock associated with the CEO transition Capital Expenditures $4 • Assumes diluted weighted average shares outstanding of 40.1 million 1 Pro-forma % growth reflects organic growth excluding Amazon and PlaneTechs from both current and prior year results for PeopleManagement and acquired TMP revenue from PeopleScout. 2 Figures may not sum to consolidated totals due to rounding.
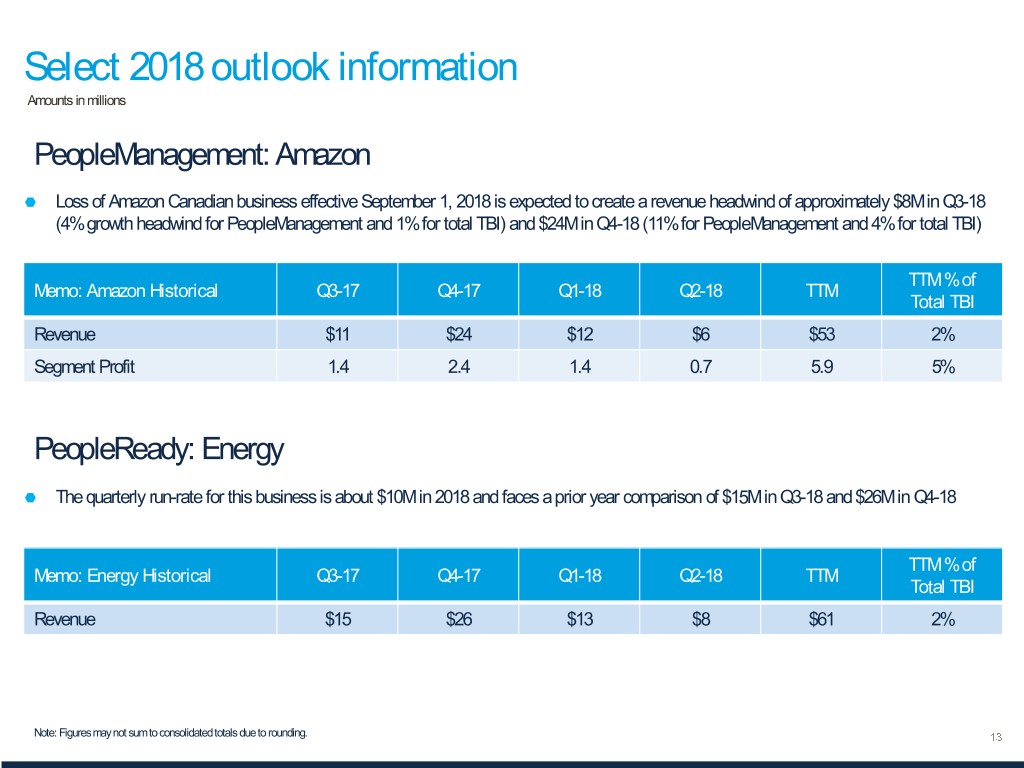
Select 2018 outlook information Amounts in millions PeopleManagement: Amazon Loss of Amazon Canadian business effective September 1, 2018 is expected to create a revenue headwind of approximately $8M in Q3-18 (4% growth headwind for PeopleManagement and 1% for total TBI) and $24M in Q4-18 (11% for PeopleManagement and 4% for total TBI) TTM % of Memo: Amazon Historical Q3-17 Q4-17 Q1-18 Q2-18 TTM Total TBI Revenue $11 $24 $12 $6 $53 2% Segment Profit 1.4 2.4 1.4 0.7 5.9 5% PeopleReady: Energy The quarterly run-rate for this business is about $10M in 2018 and faces a prior year comparison of $15M in Q3-18 and $26M in Q4-18 TTM % of Memo: Energy Historical Q3-17 Q4-17 Q1-18 Q2-18 TTM Total TBI Revenue $15 $26 $13 $8 $61 2% Note: Figures may not sum to consolidated totals due to rounding.

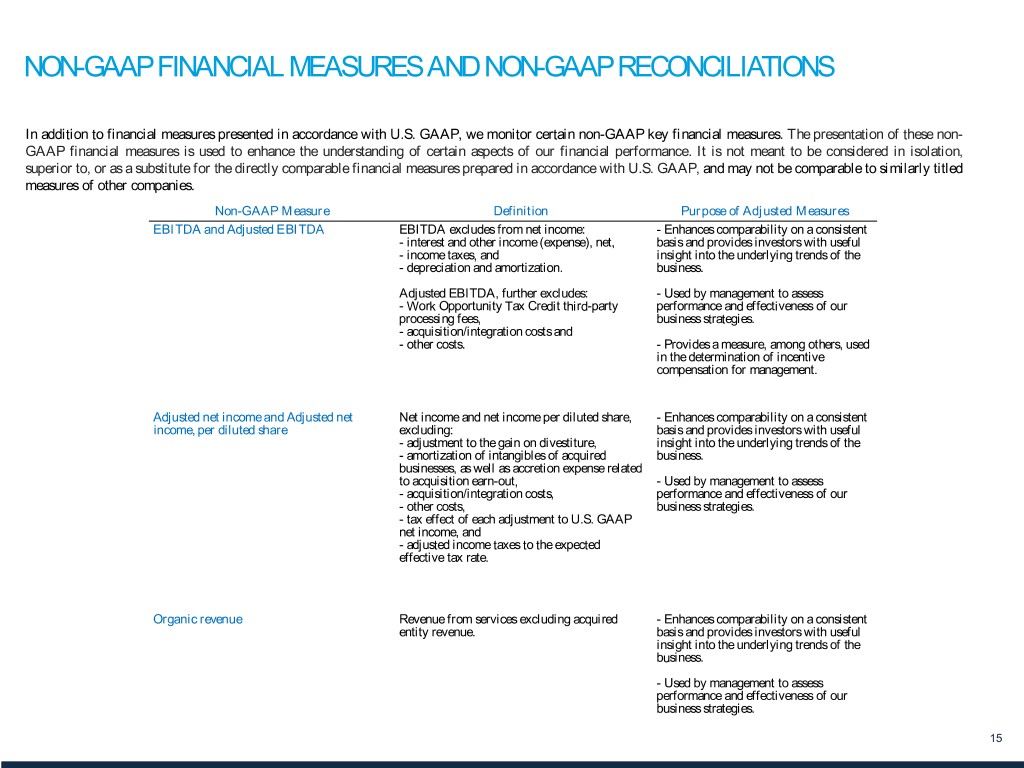
NON-GAAP FINANCIAL MEASURES AND NON-GAAP RECONCILIATIONS In addition to financial measures presented in accordance with U.S. GAAP, we monitor certain non-GAAP key financial measures. The presentation of these non- GAAP financial measures is used to enhance the understanding of certain aspects of our financial performance. It is not meant to be considered in isolation, superior to, or as a substitute for the directly comparable financial measures prepared in accordance with U.S. GAAP, and may not be comparable to similarly titled measures of other companies. Non-GAAP Measure Definition Purpose of Adjusted Measures EBITDA and Adjusted EBITDA EBITDA excludes from net income: - Enhances comparability on a consistent - interest and other income (expense), net, basis and provides investors with useful - income taxes, and insight into the underlying trends of the - depreciation and amortization. business. Adjusted EBITDA, further excludes: - Used by management to assess - Work Opportunity Tax Credit third-party performance and effectiveness of our processing fees, business strategies. - acquisition/integration costs and - other costs. - Provides a measure, among others, used in the determination of incentive compensation for management. Adjusted net income and Adjusted net Net income and net income per diluted share, - Enhances comparability on a consistent income, per diluted share excluding: basis and provides investors with useful - adjustment to the gain on divestiture, insight into the underlying trends of the - amortization of intangibles of acquired business. businesses, as well as accretion expense related to acquisition earn-out, - Used by management to assess - acquisition/integration costs, performance and effectiveness of our - other costs, business strategies. - tax effect of each adjustment to U.S. GAAP net income, and - adjusted income taxes to the expected effective tax rate. Organic revenue Revenue from services excluding acquired - Enhances comparability on a consistent entity revenue. basis and provides investors with useful insight into the underlying trends of the business. - Used by management to assess performance and effectiveness of our business strategies. 15
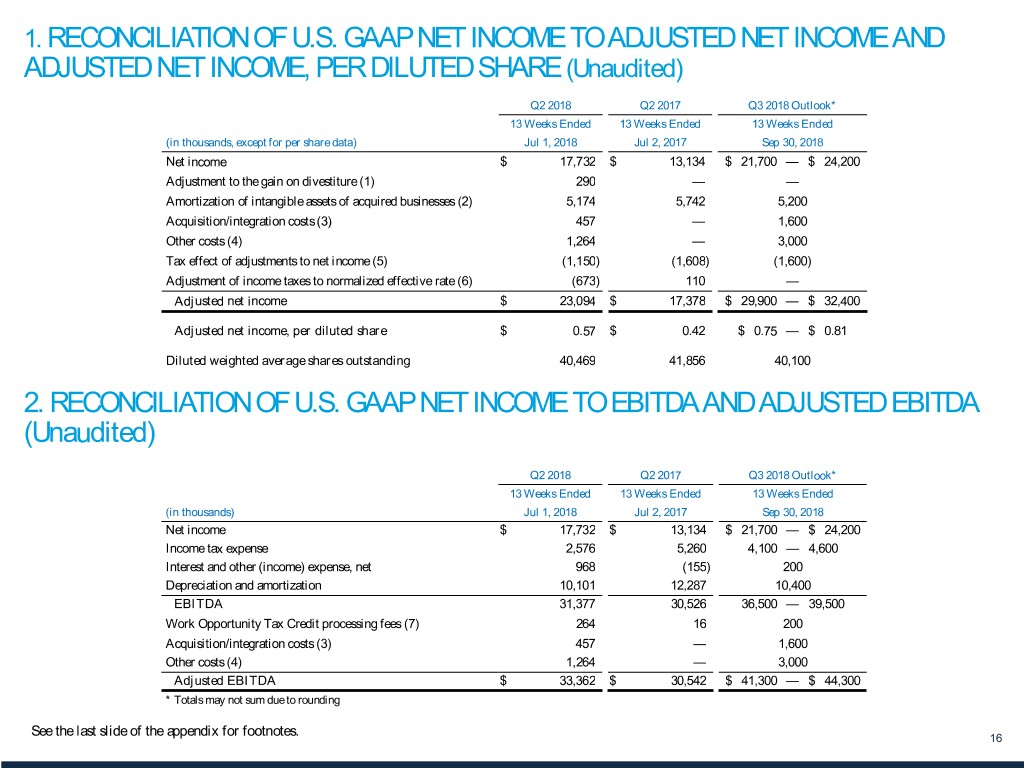
1. RECONCILIATION OF U.S. GAAP NET INCOME TO ADJUSTED NET INCOME AND ADJUSTED NET INCOME, PER DILUTED SHARE (Unaudited) Q2 2018 Q2 2017 Q3 2018 Outlook* 13 Weeks Ended 13 Weeks Ended 13 Weeks Ended (in thousands, except for per share data) Jul 1, 2018 Jul 2, 2017 Sep 30, 2018 Net income $ 17,732 $ 13,134 $ 21,700 — $ 24,200 Adjustment to the gain on divestiture (1) 290 — — Amortization of intangible assets of acquired businesses (2) 5,174 5,742 5,200 Acquisition/integration costs (3) 457 — 1,600 Other costs (4) 1,264 — 3,000 Tax effect of adjustments to net income (5) (1,150) (1,608) (1,600) Adjustment of income taxes to normalized effective rate (6) (673) 110 — Adjusted net income $ 23,094 $ 17,378 $ 29,900 — $ 32,400 Adjusted net income, per diluted share $ 0.57 $ 0.42 $ 0.75 — $ 0.81 Diluted weighted average shares outstanding 40,469 41,856 40,100 2. RECONCILIATION OF U.S. GAAP NET INCOME TO EBITDA AND ADJUSTED EBITDA (Unaudited) Q2 2018 Q2 2017 Q3 2018 Outlook* 13 Weeks Ended 13 Weeks Ended 13 Weeks Ended (in thousands) Jul 1, 2018 Jul 2, 2017 Sep 30, 2018 Net income $ 17,732 $ 13,134 $ 21,700 — $ 24,200 Income tax expense 2,576 5,260 4,100 — 4,600 Interest and other (income) expense, net 968 (155) 200 Depreciation and amortization 10,101 12,287 10,400 EBITDA 31,377 30,526 36,500 — 39,500 Work Opportunity Tax Credit processing fees (7) 264 16 200 Acquisition/integration costs (3) 457 — 1,600 Other costs (4) 1,264 — 3,000 Adjusted EBITDA $ 33,362 $ 30,542 $ 41,300 — $ 44,300 * Totals may not sum due to rounding See the last slide of the appendix for footnotes. 16
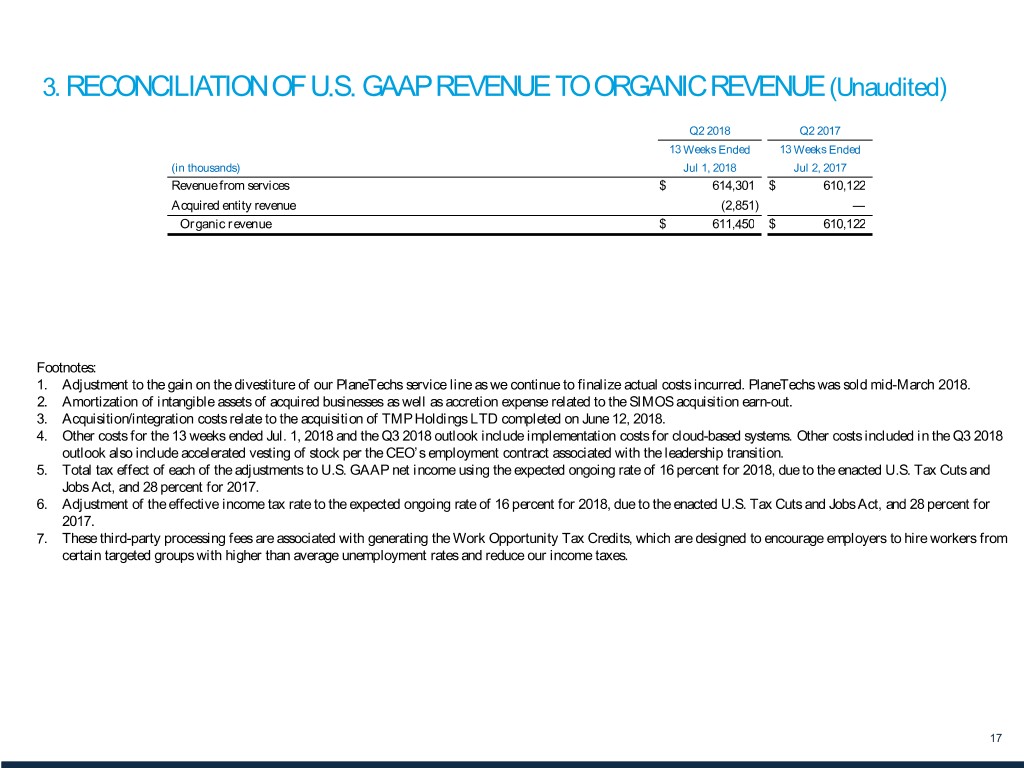
3. RECONCILIATION OF U.S. GAAP REVENUE TO ORGANIC REVENUE (Unaudited) Q2 2018 Q2 2017 13 Weeks Ended 13 Weeks Ended (in thousands) Jul 1, 2018 Jul 2, 2017 Revenue from services $ 614,301 $ 610,122 Acquired entity revenue (2,851) — Organic revenue $ 611,450 $ 610,122 Footnotes: 1. Adjustment to the gain on the divestiture of our PlaneTechs service line as we continue to finalize actual costs incurred. PlaneTechs was sold mid-March 2018. 2. Amortization of intangible assets of acquired businesses as well as accretion expense related to the SIMOS acquisition earn-out. 3. Acquisition/integration costs relate to the acquisition of TMP Holdings LTD completed on June 12, 2018. 4. Other costs for the 13 weeks ended Jul. 1, 2018 and the Q3 2018 outlook include implementation costs for cloud-based systems. Other costs included in the Q3 2018 outlook also include accelerated vesting of stock per the CEO’s employment contract associated with the leadership transition. 5. Total tax effect of each of the adjustments to U.S. GAAP net income using the expected ongoing rate of 16 percent for 2018, due to the enacted U.S. Tax Cuts and Jobs Act, and 28 percent for 2017. 6. Adjustment of the effective income tax rate to the expected ongoing rate of 16 percent for 2018, due to the enacted U.S. Tax Cuts and Jobs Act, and 28 percent for 2017. 7. These third-party processing fees are associated with generating the Work Opportunity Tax Credits, which are designed to encourage employers to hire workers from certain targeted groups with higher than average unemployment rates and reduce our income taxes. 17