
Forward-Looking Statements
1 The fiscal fourth quarter of 2016 included a 14th week and two additional days from moving the week-ending date from Friday to Sunday. The comparable period in 2016 excludes the first week (ended Sept. 30) of the fourth
quarter and the two additional days associated with the change in week-ending date.
2 The lower effective tax rate could extend beyond 2019 if Congress extends the Work Opportunity Tax Credit (WOTC). If the WOTC is not extended, the effective tax rate is expected to return to the historical rate of roughly 28%.
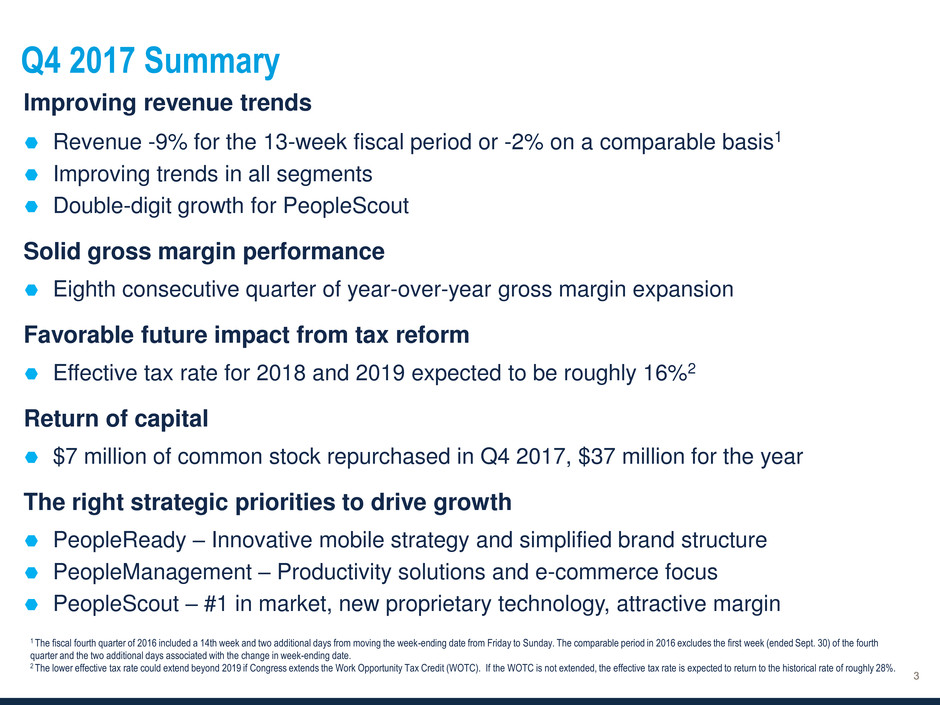
Q4 2017 Summary
Improving revenue trends
Revenue -9% for the 13-week fiscal period or -2% on a comparable basis1
Improving trends in all segments
Double-digit growth for PeopleScout
Solid gross margin performance
Eighth consecutive quarter of year-over-year gross margin expansion
Favorable future impact from tax reform
Effective tax rate for 2018 and 2019 expected to be roughly 16%2
Return of capital
$7 million of common stock repurchased in Q4 2017, $37 million for the year
The right strategic priorities to drive growth
PeopleReady – Innovative mobile strategy and simplified brand structure
PeopleManagement – Productivity solutions and e-commerce focus
PeopleScout – #1 in market, new proprietary technology, attractive margin
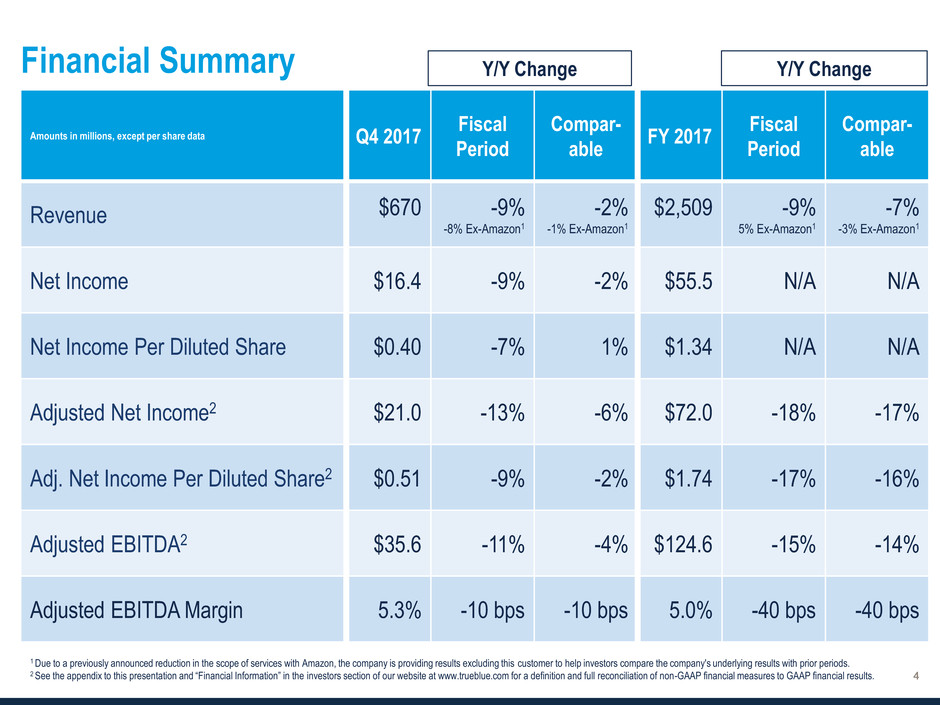
Financial Summary
Amounts in millions, except per share data Q4 2017
Fiscal
Period
Compar-
able
FY 2017
Fiscal
Period
Compar-
able
Revenue $670
-9%
-8% Ex-Amazon1
-2%
-1% Ex-Amazon1
$2,509
-9%
5% Ex-Amazon1
-7%
-3% Ex-Amazon1
Net Income $16.4 -9% -2% $55.5 N/A N/A
Net Income Per Diluted Share $0.40 -7% 1% $1.34 N/A N/A
Adjusted Net Income2 $21.0 -13% -6% $72.0 -18% -17%
Adj. Net Income Per Diluted Share2 $0.51 -9% -2% $1.74 -17% -16%
Adjusted EBITDA2 $35.6 -11% -4% $124.6 -15% -14%
Adjusted EBITDA Margin 5.3% -10 bps -10 bps 5.0% -40 bps -40 bps
1 Due to a previously announced reduction in the scope of services with Amazon, the company is providing results excluding this customer to help investors compare the company's underlying results with prior periods.
2 See the appendix to this presentation and “Financial Information” in the investors section of our website at www.trueblue.com for a definition and full reconciliation of non-GAAP financial measures to GAAP financial results.
Y/Y Change Y/Y Change
24.6%
25.1%
0.3%
0.2%
Q4 2016 Workers' compensation Core business Q4 2017
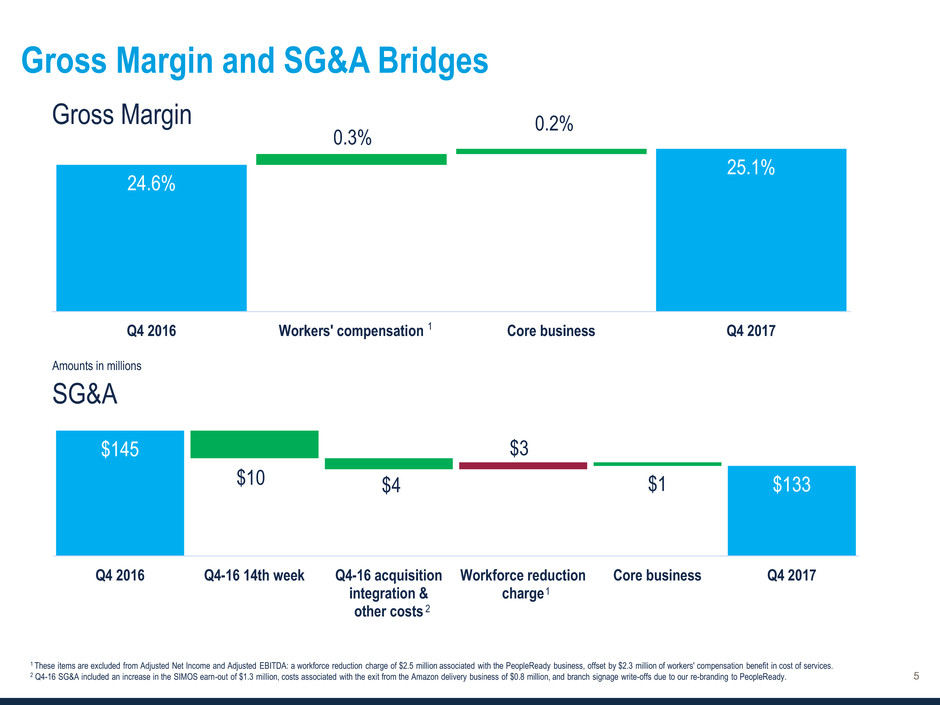
Gross Margin and SG&A Bridges
SG&A
Amounts in millions
$145
$133 $10 $4
$3
$1
Q4 2016 Q4-16 14th week Q4-16 acquisition
integration &
other costs
Workforce reduction
charge
Core business Q4 2017
2
Gross Margin
1 These items are excluded from Adjusted Net Income and Adjusted EBITDA: a workforce reduction charge of $2.5 million associated with the PeopleReady business, offset by $2.3 million of workers' compensation benefit in cost of services.
2 Q4-16 SG&A included an increase in the SIMOS earn-out of $1.3 million, costs associated with the exit from the Amazon delivery business of $0.8 million, and branch signage write-offs due to our re-branding to PeopleReady.
1
1
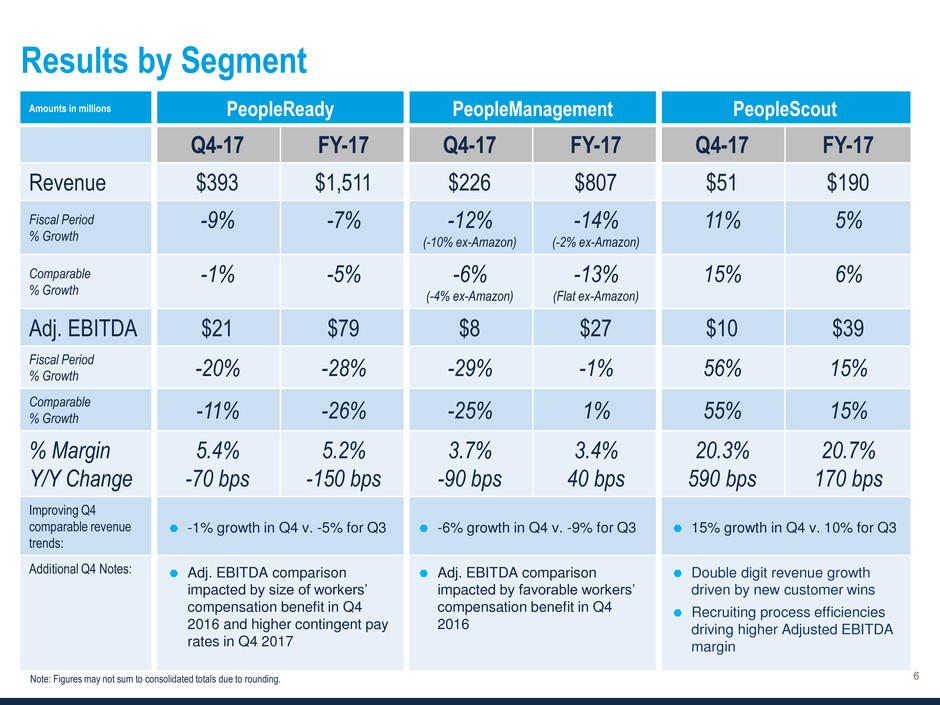
Amounts in millions PeopleReady PeopleManagement PeopleScout
Q4-17 FY-17 Q4-17 FY-17 Q4-17 FY-17
Revenue $393 $1,511 $226 $807 $51 $190
Fiscal Period
% Growth
-9%
-7%
-12%
(-10% ex-Amazon)
-14%
(-2% ex-Amazon)
11%
5%
Comparable
% Growth
-1%
-5%
-6%
(-4% ex-Amazon)
-13%
(Flat ex-Amazon)
15%
6%
Adj. EBITDA $21 $79 $8 $27 $10 $39
Fiscal Period
% Growth -20% -28% -29% -1% 56% 15%
Comparable
% Growth -11% -26% -25% 1% 55% 15%
% Margin
Y/Y Change
5.4%
-70 bps
5.2%
-150 bps
3.7%
-90 bps
3.4%
40 bps
20.3%
590 bps
20.7%
170 bps
Improving Q4
comparable revenue
trends:
Additional Q4 Notes:
Note: Figures may not sum to consolidated totals due to rounding.
Results by Segment
-1% growth in Q4 v. -5% for Q3
Adj. EBITDA comparison
impacted by size of workers’
compensation benefit in Q4
2016 and higher contingent pay
rates in Q4 2017
15% growth in Q4 v. 10% for Q3
Double digit revenue growth
driven by new customer wins
Recruiting process efficiencies
driving higher Adjusted EBITDA
margin
-6% growth in Q4 v. -9% for Q3
Adj. EBITDA comparison
impacted by favorable workers’
compensation benefit in Q4
2016
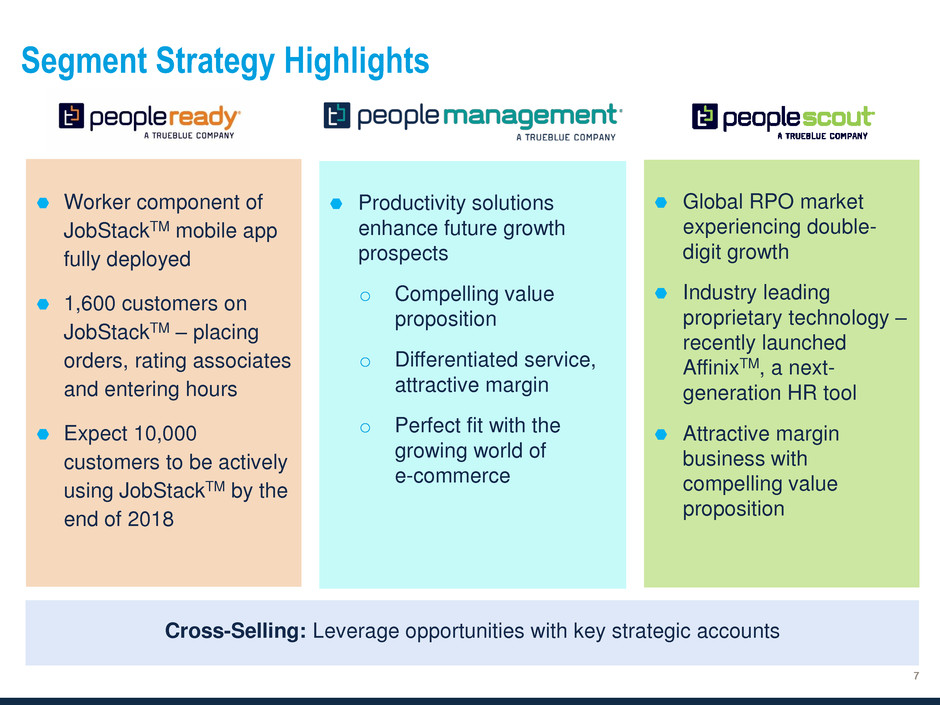
Segment Strategy Highlights
Worker component of
JobStackTM mobile app
fully deployed
1,600 customers on
JobStackTM – placing
orders, rating associates
and entering hours
Expect 10,000
customers to be actively
using JobStackTM by the
end of 2018
Productivity solutions
enhance future growth
prospects
o Compelling value
proposition
o Differentiated service,
attractive margin
o Perfect fit with the
growing world of
e-commerce
Global RPO market
experiencing double-
digit growth
Industry leading
proprietary technology –
recently launched
AffinixTM, a next-
generation HR tool
Attractive margin
business with
compelling value
proposition
Cross-Selling: Leverage opportunities with key strategic accounts
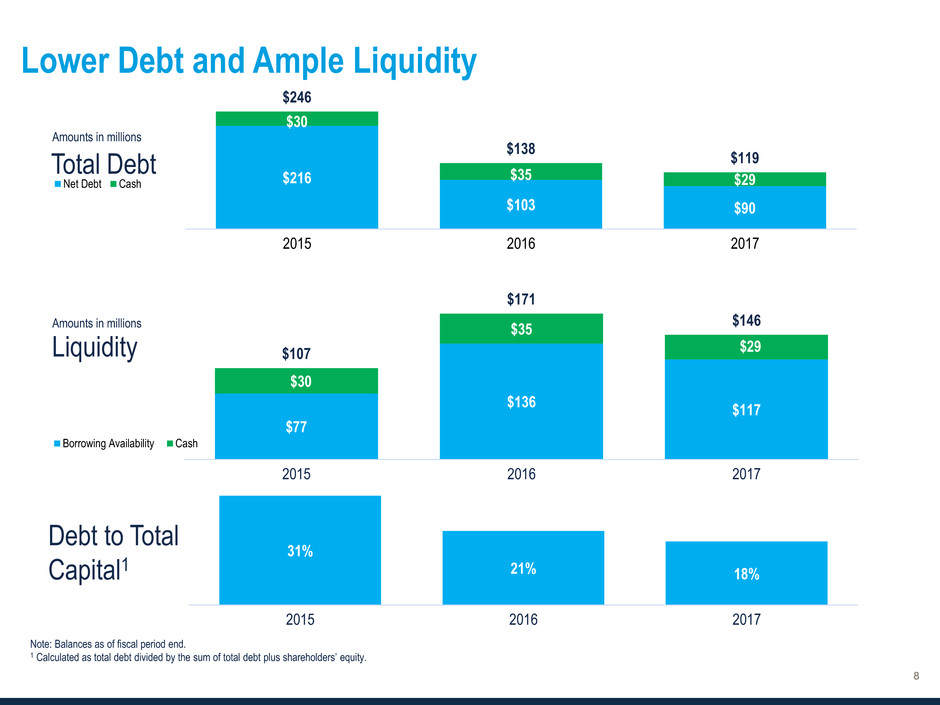
31%
21% 18%
2015 2016 2017
$216
$103 $90
$30
$35 $29
$246
$138
$119
2015 2016 2017
Net Debt Cash
$77
$136
$117
$30
$35
$29 $107
$171
$146
2015 2016 2017
Borrowing Availability Cash
Lower Debt and Ample Liquidity
Total Debt
Liquidity
Debt to Total
Capital1
Amounts in millions
Amounts in millions
Note: Balances as of fiscal period end.
1 Calculated as total debt divided by the sum of total debt plus shareholders’ equity.

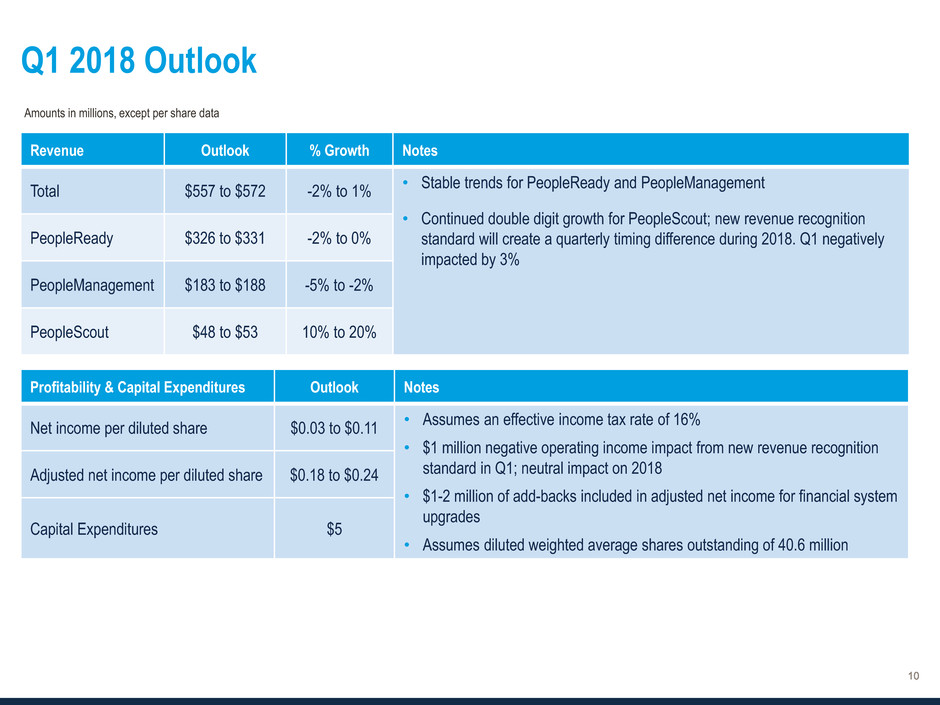
Q1 2018 Outlook
Revenue Outlook % Growth Notes
Total $557 to $572 -2% to 1%
• Stable trends for PeopleReady and PeopleManagement
• Continued double digit growth for PeopleScout; new revenue recognition
standard will create a quarterly timing difference during 2018. Q1 negatively
impacted by 3%
PeopleReady $326 to $331 -2% to 0%
PeopleManagement $183 to $188 -5% to -2%
PeopleScout $48 to $53 10% to 20%
Profitability & Capital Expenditures Outlook Notes
Net income per diluted share $0.03 to $0.11
• Assumes an effective income tax rate of 16%
• $1 million negative operating income impact from new revenue recognition
standard in Q1; neutral impact on 2018
• $1-2 million of add-backs included in adjusted net income for financial system
upgrades
• Assumes diluted weighted average shares outstanding of 40.6 million
Adjusted net income per diluted share $0.18 to $0.24
Capital Expenditures $5
Amounts in millions, except per share data

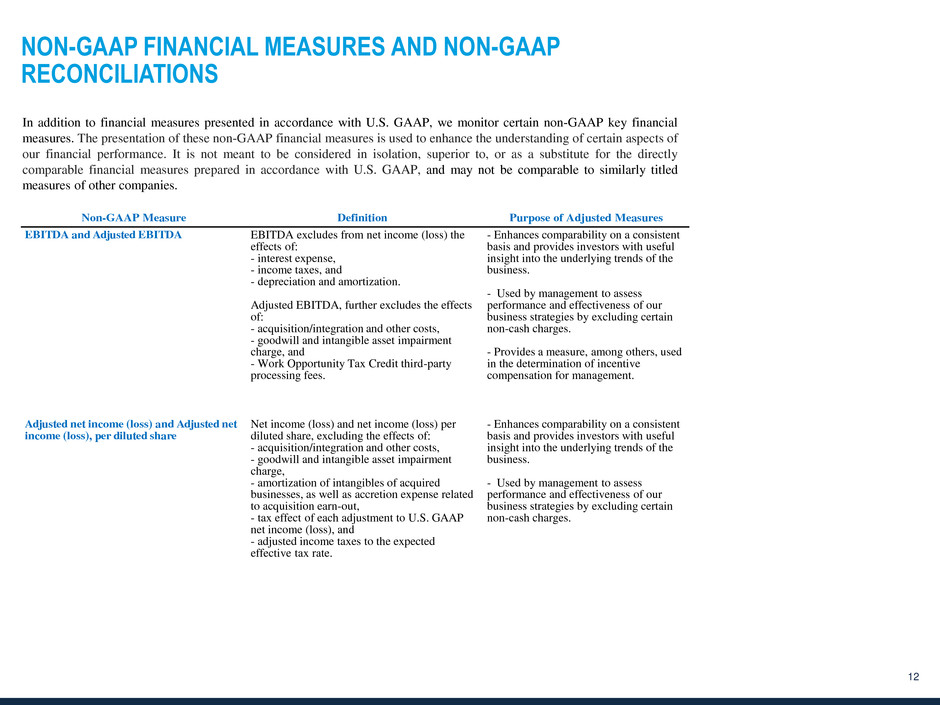
NON-GAAP FINANCIAL MEASURES AND NON-GAAP
RECONCILIATIONS
12
Non-GAAP Measure Definition Purpose of Adjusted Measures
EBITDA and Adjusted EBITDA EBITDA excludes from net income (loss) the
effects of:
- interest expense,
- income taxes, and
- depreciation and amortization.
Adjusted EBITDA, further excludes the effects
of:
- acquisition/integration and other costs,
- goodwill and intangible asset impairment
charge, and
- Work Opportunity Tax Credit third-party
processing fees.
- Enhances comparability on a consistent
basis and provides investors with useful
insight into the underlying trends of the
business.
- Used by management to assess
performance and effectiveness of our
business strategies by excluding certain
non-cash charges.
- Provides a measure, among others, used
in the determination of incentive
compensation for management.
Adjusted net income (loss) and Adjusted net
income (loss), per diluted share
Net income (loss) and net income (loss) per
diluted share, excluding the effects of:
- acquisition/integration and other costs,
- goodwill and intangible asset impairment
charge,
- amortization of intangibles of acquired
businesses, as well as accretion expense related
to acquisition earn-out,
- tax effect of each adjustment to U.S. GAAP
net income (loss), and
- adjusted income taxes to the expected
effective tax rate.
- Enhances comparability on a consistent
basis and provides investors with useful
insight into the underlying trends of the
business.
- Used by management to assess
performance and effectiveness of our
business strategies by excluding certain
non-cash charges.
In addition to financial measures presented in accordance with U.S. GAAP, we monitor certain non-GAAP key financial
measures. The presentation of these non-GAAP financial measures is used to enhance the understanding of certain aspects of
our financial performance. It is not meant to be considered in isolation, superior to, or as a substitute for the directly
comparable financial measures prepared in accordance with U.S. GAAP, and may not be comparable to similarly titled
measures of other companies.
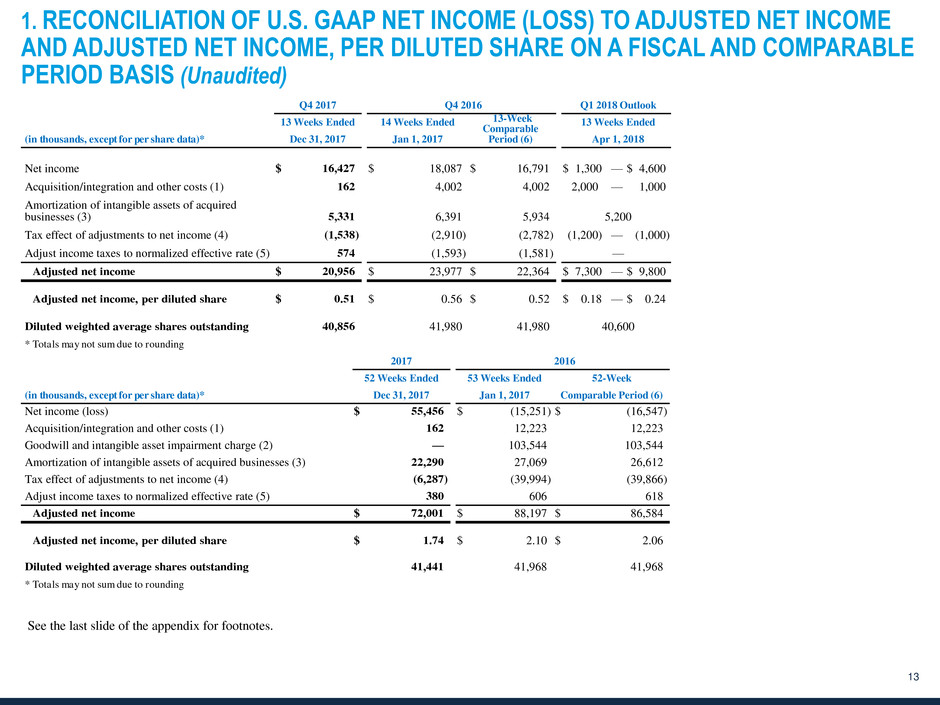
1. RECONCILIATION OF U.S. GAAP NET INCOME (LOSS) TO ADJUSTED NET INCOME
AND ADJUSTED NET INCOME, PER DILUTED SHARE ON A FISCAL AND COMPARABLE
PERIOD BASIS (Unaudited)
13
Q4 2017 Q4 2016 Q1 2018 Outlook
13 Weeks Ended 14 Weeks Ended 13-Week
Comparable
Period (6)
13 Weeks Ended
(in thousands, except for per share data)* Dec 31, 2017 Jan 1, 2017 Apr 1, 2018
Net income $ 16,427 $ 18,087 $ 16,791 $ 1,300 — $ 4,600
Acquisition/integration and other costs (1) 162 4,002 4,002 2,000 — 1,000
Amortization of intangible assets of acquired
businesses (3) 5,331 6,391 5,934 5,200
Tax effect of adjustments to net income (4) (1,538 ) (2,910 ) (2,782 ) (1,200) — (1,000 )
Adjust income taxes to normalized effective rate (5) 574 (1,593 ) (1,581 ) —
Adjusted net income $ 20,956 $ 23,977 $ 22,364 $ 7,300 — $ 9,800
Adjusted net income, per diluted share $ 0.51 $ 0.56 $ 0.52 $ 0.18 — $ 0.24
Diluted weighted average shares outstanding 40,856 41,980 41,980 40,600
* Totals may not sum due to rounding
2017 2016
52 Weeks Ended 53 Weeks Ended 52-Week
(in thousands, except for per share data)* Dec 31, 2017 Jan 1, 2017 Comparable Period (6)
Net income (loss) $ 55,456 $ (15,251 ) $ (16,547 )
Acquisition/integration and other costs (1) 162 12,223 12,223
Goodwill and intangible asset impairment charge (2) — 103,544 103,544
Amortization of intangible assets of acquired businesses (3) 22,290 27,069 26,612
Tax effect of adjustments to net income (4) (6,287 ) (39,994 ) (39,866 )
Adjust income taxes to normalized effective rate (5) 380 606 618
Adjusted net income $ 72,001 $ 88,197 $ 86,584
Adjusted net income, per diluted share $ 1.74 $ 2.10 $ 2.06
Diluted weighted average shares outstanding 41,441 41,968 41,968
* Totals may not sum due to rounding
See the last slide of the appendix for footnotes.
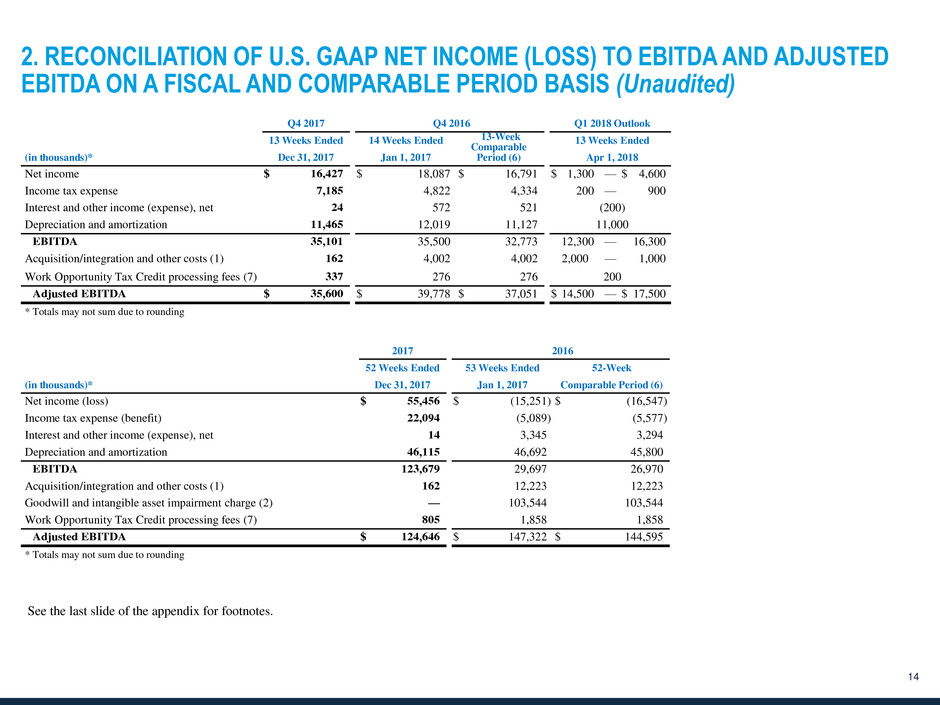
2. RECONCILIATION OF U.S. GAAP NET INCOME (LOSS) TO EBITDA AND ADJUSTED
EBITDA ON A FISCAL AND COMPARABLE PERIOD BASIS (Unaudited)
14
2017 2016
52 Weeks Ended 53 Weeks Ended 52-Week
(in thousands)* Dec 31, 2017 Jan 1, 2017 Comparable Period (6)
Net income (loss) $ 55,456 $ (15,251 ) $ (16,547 )
Income tax expense (benefit) 22,094 (5,089 ) (5,577 )
Interest and other income (expense), net 14 3,345 3,294
Depreciation and amortization 46,115 46,692 45,800
EBITDA 123,679 29,697 26,970
Acquisition/integration and other costs (1) 162 12,223 12,223
Goodwill and intangible asset impairment charge (2) — 103,544 103,544
Work Opportunity Tax Credit processing fees (7) 805 1,858 1,858
Adjusted EBITDA $ 124,646 $ 147,322 $ 144,595
* Totals may not sum due to rounding
Q4 2017 Q4 2016 Q1 2018 Outlook
13 Weeks Ended 14 Weeks Ended 13-Week
Comparable
Period (6)
13 Weeks Ended
(in thousands)* Dec 31, 2017 Jan 1, 2017 Apr 1, 2018
Net income $ 16,427 $ 18,087 $ 16,791 $ 1,300 — $ 4,600
Income tax expense 7,185 4,822 4,334 200 — 900
Interest and other income (expense), net 24 572 521 (200)
Depreciation and amortization 11,465 12,019 11,127 11,000
EBITDA 35,101 35,500 32,773 12,300 — 16,300
Acquisition/integration and other costs (1) 162 4,002 4,002 2,000 — 1,000
Work Opportunity Tax Credit processing fees (7) 337 276 276 200
Adjusted EBITDA $ 35,600 $ 39,778 $ 37,051 $ 14,500 — $ 17,500
* Totals may not sum due to rounding
See the last slide of the appendix for footnotes.
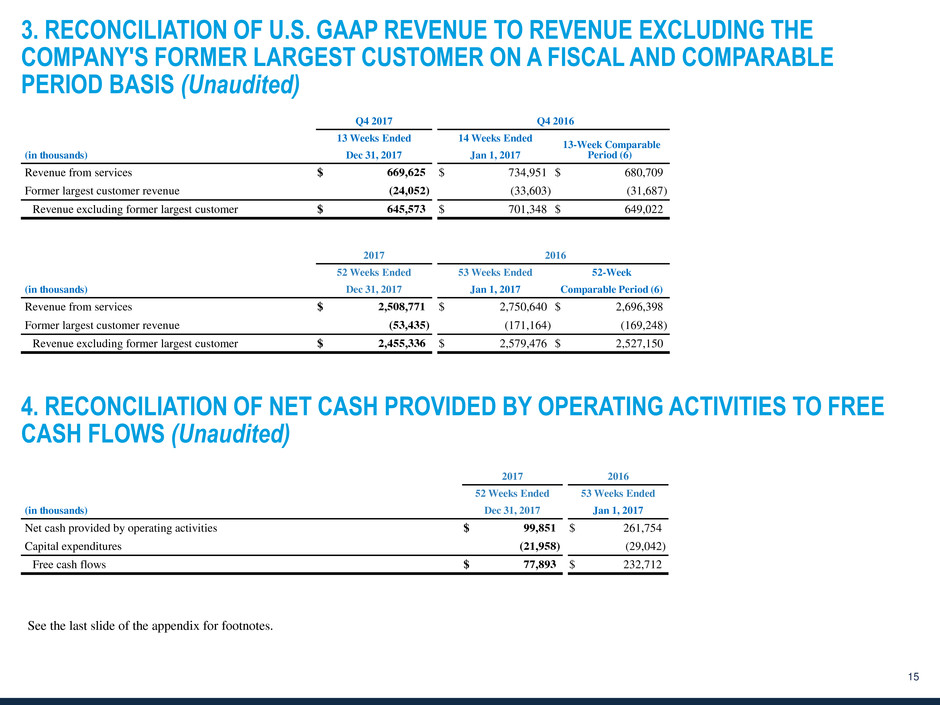
3. RECONCILIATION OF U.S. GAAP REVENUE TO REVENUE EXCLUDING THE
COMPANY'S FORMER LARGEST CUSTOMER ON A FISCAL AND COMPARABLE
PERIOD BASIS (Unaudited)
15
4. RECONCILIATION OF NET CASH PROVIDED BY OPERATING ACTIVITIES TO FREE
CASH FLOWS (Unaudited)
2017 2016
52 Weeks Ended 53 Weeks Ended 52-Week
(in thousands) Dec 31, 2017 Jan 1, 2017 Comparable Period (6)
Revenue from services $ 2,508,771 $ 2,750,640 $ 2,696,398
Former largest customer revenue (53,435 ) (171,164 ) (169,248 )
Revenue excluding former largest customer $ 2,455,336 $ 2,579,476 $ 2,527,150
Q4 2017 Q4 2016
13 Weeks Ended 14 Weeks Ended
13-Week Comparable
Period (6) (in thousands) Dec 31, 2017 Jan 1, 2017
Revenue from services $ 669,625 $ 734,951 $ 680,709
Former largest customer revenue (24,052 ) (33,603 ) (31,687 )
Revenue excluding former largest customer $ 645,573 $ 701,348 $ 649,022
2017 2016
52 Weeks Ended 53 Weeks Ended
(in thousands) Dec 31, 2017 Jan 1, 2017
Net cash provided by operating activities $ 99,851 $ 261,754
Capital expenditures (21,958 ) (29,042 )
Free cash flows $ 77,893 $ 232,712
See the last slide of the appendix for footnotes.
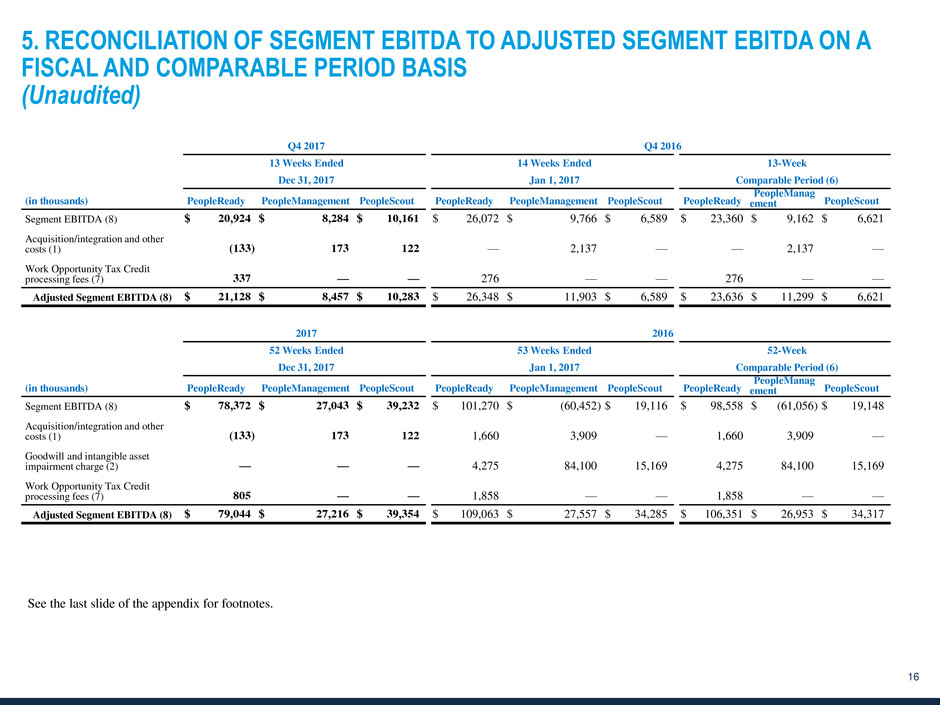
5. RECONCILIATION OF SEGMENT EBITDA TO ADJUSTED SEGMENT EBITDA ON A
FISCAL AND COMPARABLE PERIOD BASIS
(Unaudited)
16
Q4 2017 Q4 2016
13 Weeks Ended 14 Weeks Ended 13-Week
Dec 31, 2017 Jan 1, 2017 Comparable Period (6)
(in thousands) PeopleReady PeopleManagement PeopleScout PeopleReady PeopleManagement PeopleScout PeopleReady
PeopleManag
ement PeopleScout
Segment EBITDA (8) $ 20,924 $ 8,284 $ 10,161 $ 26,072 $ 9,766 $ 6,589 $ 23,360 $ 9,162 $ 6,621
Acquisition/integration and other
costs (1) (133 ) 173 122 — 2,137 — — 2,137 —
Work Opportunity Tax Credit
processing fees (7) 337 — — 276 — — 276 — —
Adjusted Segment EBITDA (8) $ 21,128 $ 8,457 $ 10,283 $ 26,348 $ 11,903 $ 6,589 $ 23,636 $ 11,299 $ 6,621
2017 2016
52 Weeks Ended 53 Weeks Ended 52-Week
Dec 31, 2017 Jan 1, 2017 Comparable Period (6)
(in thousands) PeopleReady PeopleManagement PeopleScout PeopleReady PeopleManagement PeopleScout PeopleReady
PeopleManag
ement PeopleScout
Segment EBITDA (8) $ 78,372 $ 27,043 $ 39,232 $ 101,270 $ (60,452 ) $ 19,116 $ 98,558 $ (61,056 ) $ 19,148
Acquisition/integration and other
costs (1) (133 ) 173 122 1,660 3,909 — 1,660 3,909 —
Goodwill and intangible asset
impairment charge (2) — — — 4,275 84,100 15,169 4,275 84,100 15,169
Work Opportunity Tax Credit
processing fees (7) 805 — — 1,858 — — 1,858 — —
Adjusted Segment EBITDA (8) $ 79,044 $ 27,216 $ 39,354 $ 109,063 $ 27,557 $ 34,285 $ 106,351 $ 26,953 $ 34,317
See the last slide of the appendix for footnotes.
17
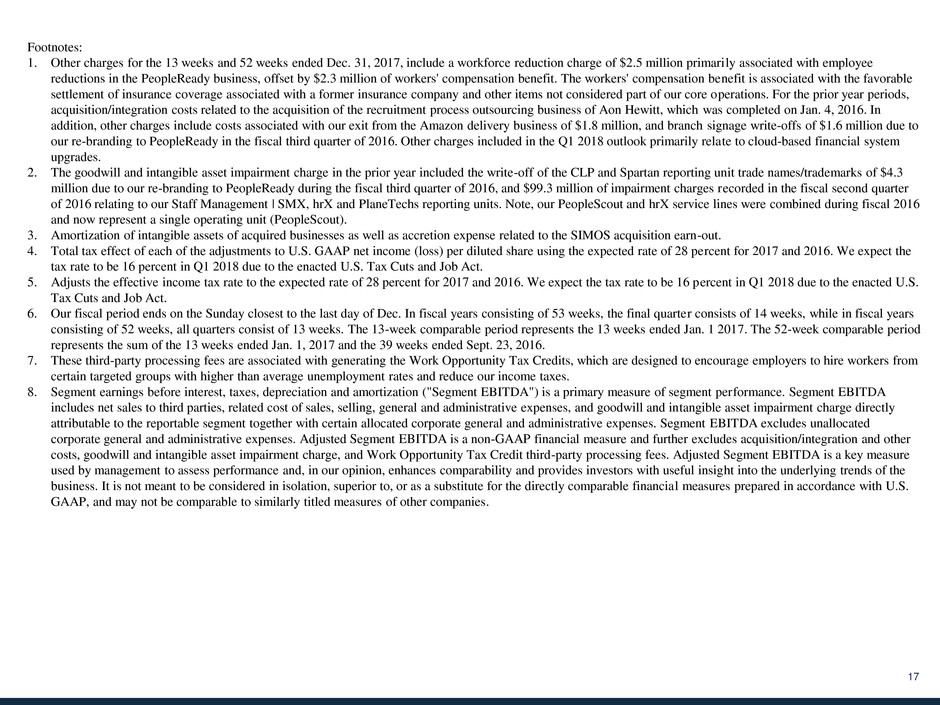
Footnotes:
1. Other charges for the 13 weeks and 52 weeks ended Dec. 31, 2017, include a workforce reduction charge of $2.5 million primarily associated with employee
reductions in the PeopleReady business, offset by $2.3 million of workers' compensation benefit. The workers' compensation benefit is associated with the favorable
settlement of insurance coverage associated with a former insurance company and other items not considered part of our core operations. For the prior year periods,
acquisition/integration costs related to the acquisition of the recruitment process outsourcing business of Aon Hewitt, which was completed on Jan. 4, 2016. In
addition, other charges include costs associated with our exit from the Amazon delivery business of $1.8 million, and branch signage write-offs of $1.6 million due to
our re-branding to PeopleReady in the fiscal third quarter of 2016. Other charges included in the Q1 2018 outlook primarily relate to cloud-based financial system
upgrades.
2. The goodwill and intangible asset impairment charge in the prior year included the write-off of the CLP and Spartan reporting unit trade names/trademarks of $4.3
million due to our re-branding to PeopleReady during the fiscal third quarter of 2016, and $99.3 million of impairment charges recorded in the fiscal second quarter
of 2016 relating to our Staff Management | SMX, hrX and PlaneTechs reporting units. Note, our PeopleScout and hrX service lines were combined during fiscal 2016
and now represent a single operating unit (PeopleScout).
3. Amortization of intangible assets of acquired businesses as well as accretion expense related to the SIMOS acquisition earn-out.
4. Total tax effect of each of the adjustments to U.S. GAAP net income (loss) per diluted share using the expected rate of 28 percent for 2017 and 2016. We expect the
tax rate to be 16 percent in Q1 2018 due to the enacted U.S. Tax Cuts and Job Act.
5. Adjusts the effective income tax rate to the expected rate of 28 percent for 2017 and 2016. We expect the tax rate to be 16 percent in Q1 2018 due to the enacted U.S.
Tax Cuts and Job Act.
6. Our fiscal period ends on the Sunday closest to the last day of Dec. In fiscal years consisting of 53 weeks, the final quarter consists of 14 weeks, while in fiscal years
consisting of 52 weeks, all quarters consist of 13 weeks. The 13-week comparable period represents the 13 weeks ended Jan. 1 2017. The 52-week comparable period
represents the sum of the 13 weeks ended Jan. 1, 2017 and the 39 weeks ended Sept. 23, 2016.
7. These third-party processing fees are associated with generating the Work Opportunity Tax Credits, which are designed to encourage employers to hire workers from
certain targeted groups with higher than average unemployment rates and reduce our income taxes.
8. Segment earnings before interest, taxes, depreciation and amortization ("Segment EBITDA") is a primary measure of segment performance. Segment EBITDA
includes net sales to third parties, related cost of sales, selling, general and administrative expenses, and goodwill and intangible asset impairment charge directly
attributable to the reportable segment together with certain allocated corporate general and administrative expenses. Segment EBITDA excludes unallocated
corporate general and administrative expenses. Adjusted Segment EBITDA is a non-GAAP financial measure and further excludes acquisition/integration and other
costs, goodwill and intangible asset impairment charge, and Work Opportunity Tax Credit third-party processing fees. Adjusted Segment EBITDA is a key measure
used by management to assess performance and, in our opinion, enhances comparability and provides investors with useful insight into the underlying trends of the
business. It is not meant to be considered in isolation, superior to, or as a substitute for the directly comparable financial measures prepared in accordance with U.S.
GAAP, and may not be comparable to similarly titled measures of other companies.