
www.TrueBlue.com
www.TrueBlue.com
Forward-Looking Statements
www.TrueBlue.com
Q3 2017 Summary
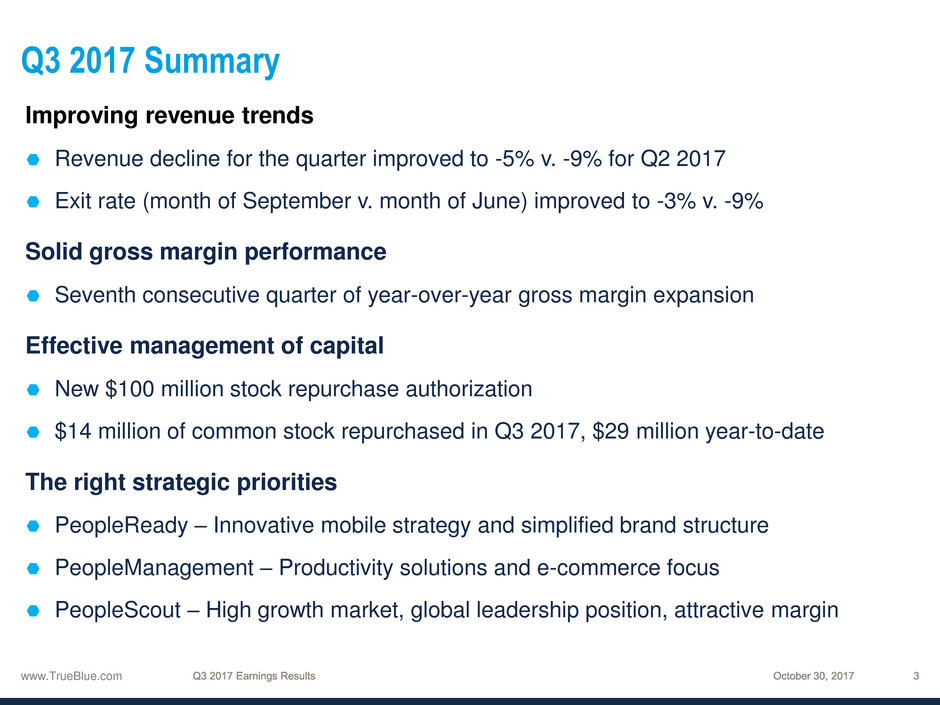
Improving revenue trends
Revenue decline for the quarter improved to -5% v. -9% for Q2 2017
Exit rate (month of September v. month of June) improved to -3% v. -9%
Solid gross margin performance
Seventh consecutive quarter of year-over-year gross margin expansion
Effective management of capital
New $100 million stock repurchase authorization
$14 million of common stock repurchased in Q3 2017, $29 million year-to-date
The right strategic priorities
PeopleReady – Innovative mobile strategy and simplified brand structure
PeopleManagement – Productivity solutions and e-commerce focus
PeopleScout – High growth market, global leadership position, attractive margin
www.TrueBlue.com
Financial Summary
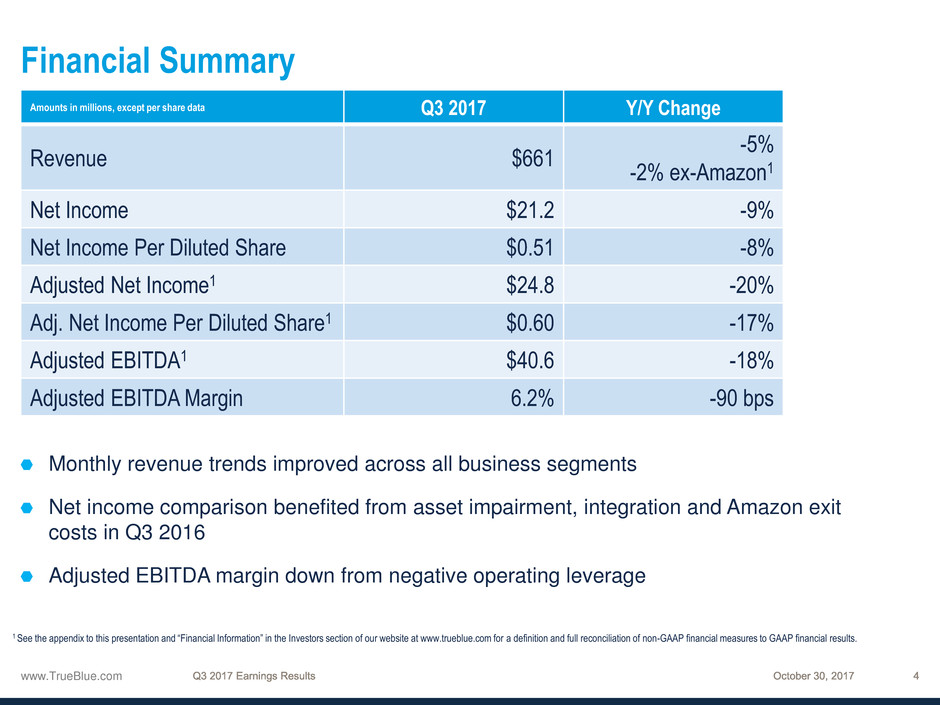
Monthly revenue trends improved across all business segments
Net income comparison benefited from asset impairment, integration and Amazon exit
costs in Q3 2016
Adjusted EBITDA margin down from negative operating leverage
Amounts in millions, except per share data Q3 2017 Y/Y Change
Revenue $661
-5%
-2% ex-Amazon1
Net Income $21.2 -9%
Net Income Per Diluted Share $0.51 -8%
Adjusted Net Income1 $24.8 -20%
Adj. Net Income Per Diluted Share1 $0.60 -17%
Adjusted EBITDA1 $40.6 -18%
Adjusted EBITDA Margin 6.2% -90 bps
1 See the appendix to this presentation and “Financial Information” in the Investors section of our website at www.trueblue.com for a definition and full reconciliation of non-GAAP financial measures to GAAP financial results.
www.TrueBlue.com
Gross Margin and SG&A Bridges
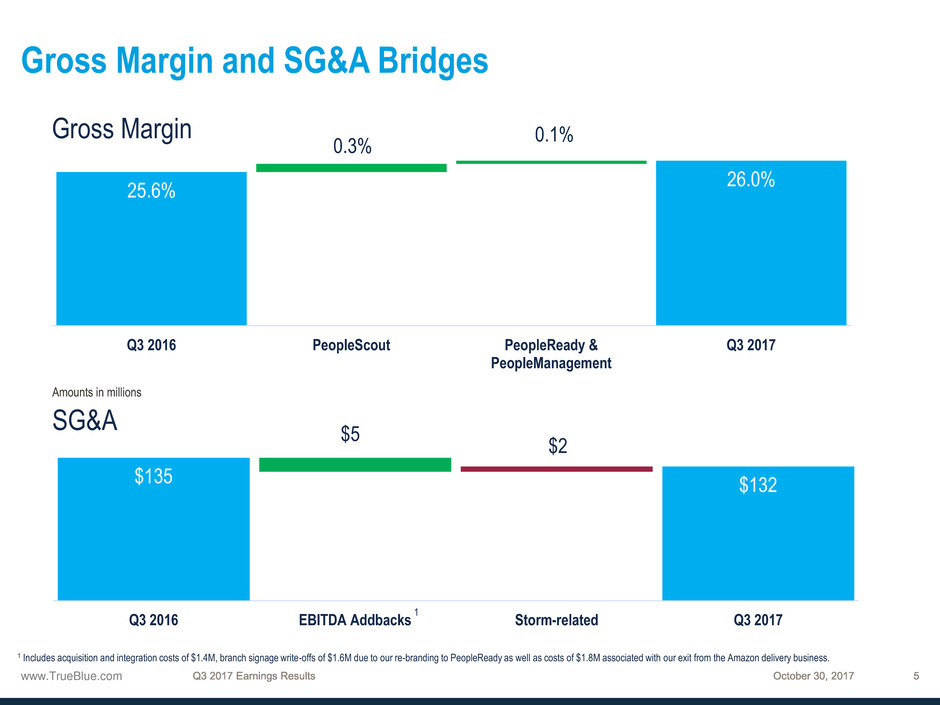
SG&A
Amounts in millions
$135 $132
$5
$2
Q3 2016 EBITDA Addbacks Storm-related Q3 2017
1
Gross Margin
25.6%
26.0%
0.3%
0.1%
Q3 2016 PeopleScout PeopleReady &
PeopleManagement
Q3 2017
1 Includes acquisition and integration costs of $1.4M, branch signage write-offs of $1.6M due to our re-branding to PeopleReady as well as costs of $1.8M associated with our exit from the Amazon delivery business.
www.TrueBlue.com
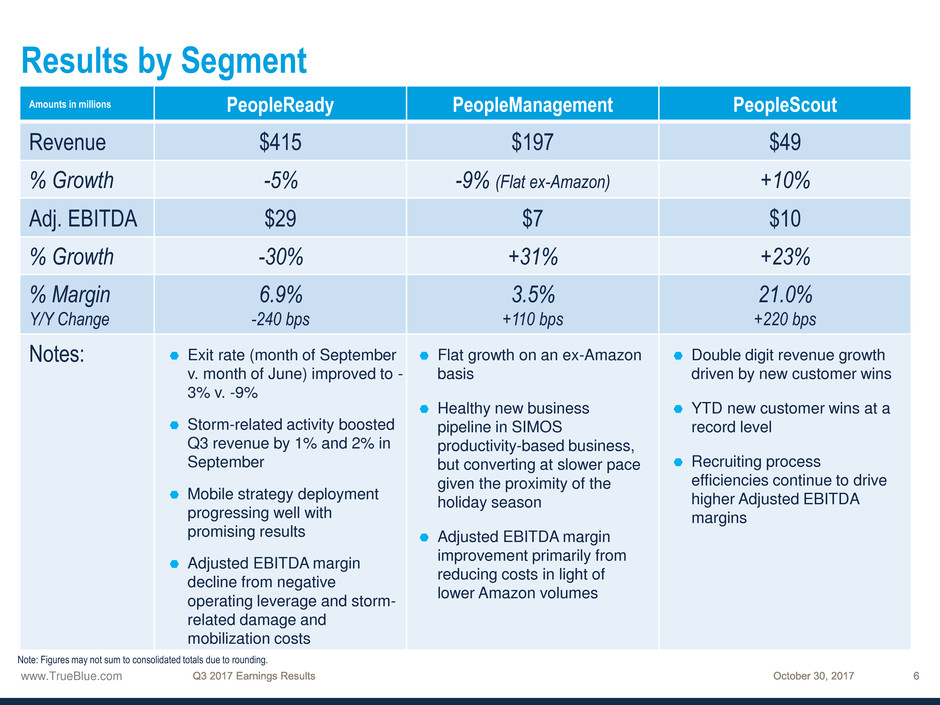
Amounts in millions PeopleReady PeopleManagement PeopleScout
Revenue $415 $197 $49
% Growth -5% -9% (Flat ex-Amazon) +10%
Adj. EBITDA $29 $7 $10
% Growth -30% +31% +23%
% Margin
Y/Y Change
6.9%
-240 bps
3.5%
+110 bps
21.0%
+220 bps
Notes:
Note: Figures may not sum to consolidated totals due to rounding.
Results by Segment
Exit rate (month of September
v. month of June) improved to -
3% v. -9%
Storm-related activity boosted
Q3 revenue by 1% and 2% in
September
Mobile strategy deployment
progressing well with
promising results
Adjusted EBITDA margin
decline from negative
operating leverage and storm-
related damage and
mobilization costs
Flat growth on an ex-Amazon
basis
Healthy new business
pipeline in SIMOS
productivity-based business,
but converting at slower pace
given the proximity of the
holiday season
Adjusted EBITDA margin
improvement primarily from
reducing costs in light of
lower Amazon volumes
Double digit revenue growth
driven by new customer wins
YTD new customer wins at a
record level
Recruiting process
efficiencies continue to drive
higher Adjusted EBITDA
margins
www.TrueBlue.com
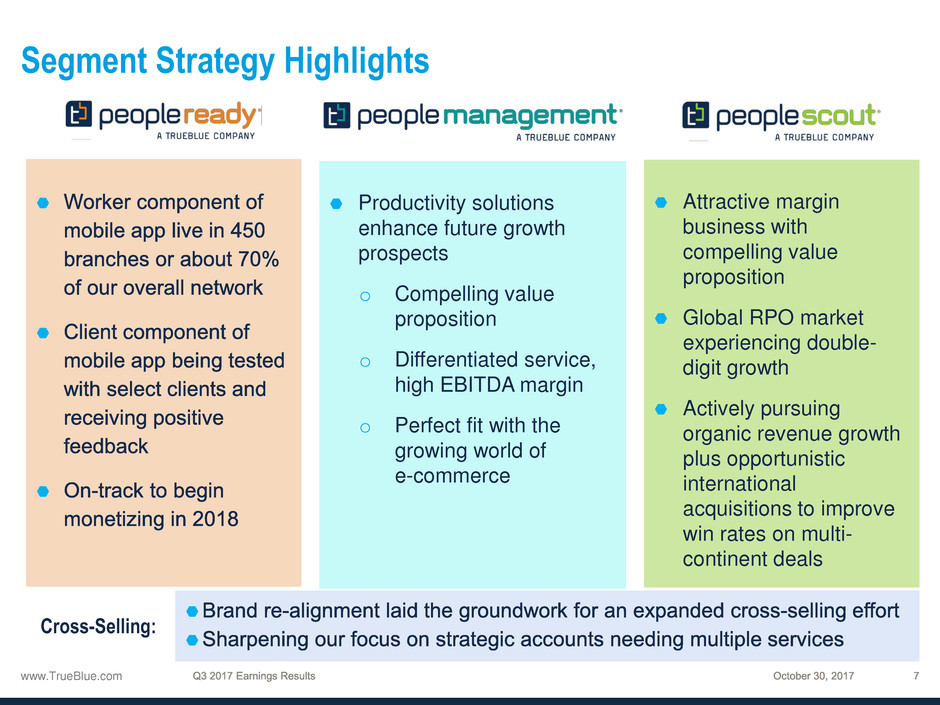
Segment Strategy Highlights
Productivity solutions
enhance future growth
prospects
o Compelling value
proposition
o Differentiated service,
high EBITDA margin
o Perfect fit with the
growing world of
e-commerce
Attractive margin
business with
compelling value
proposition
Global RPO market
experiencing double-
digit growth
Actively pursuing
organic revenue growth
plus opportunistic
international
acquisitions to improve
win rates on multi-
continent deals
Cross-Selling:
www.TrueBlue.com
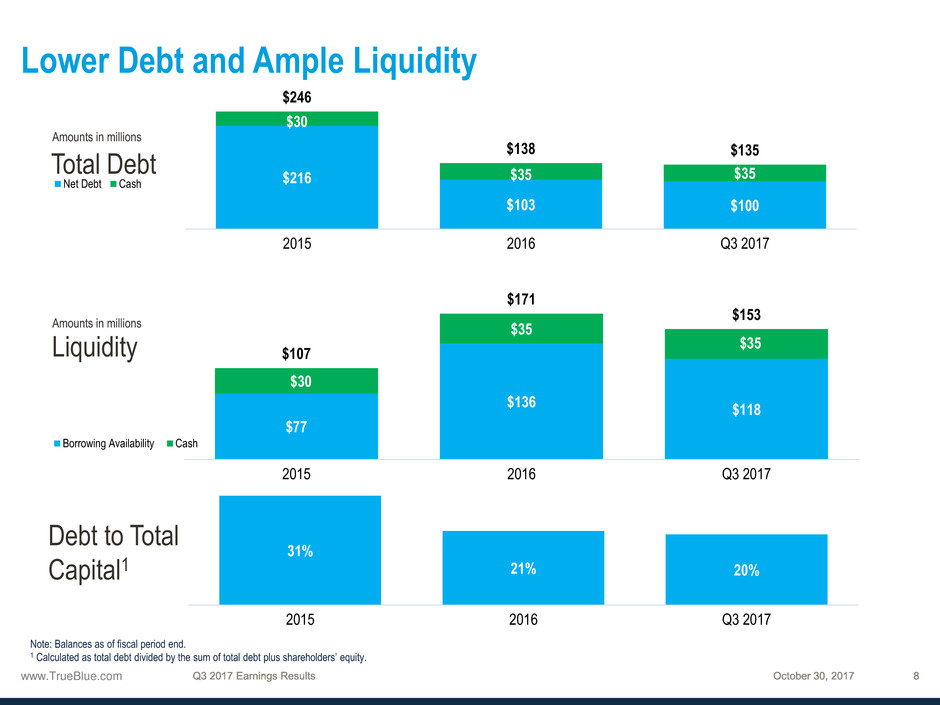
$216
$103 $100
$30
$35 $35
$246
$138 $135
2015 2016 Q3 2017
Net Debt Cash
$77
$136 $118
$30
$35
$35
$107
$171
$153
2015 2016 Q3 2017
Borrowing Availability Cash
Lower Debt and Ample Liquidity
31%
21% 20%
2015 2016 Q3 2017
Total Debt
Liquidity
Debt to Total
Capital1
Amounts in millions
Amounts in millions
Note: Balances as of fiscal period end.
1 Calculated as total debt divided by the sum of total debt plus shareholders’ equity.

www.TrueBlue.com
www.TrueBlue.com
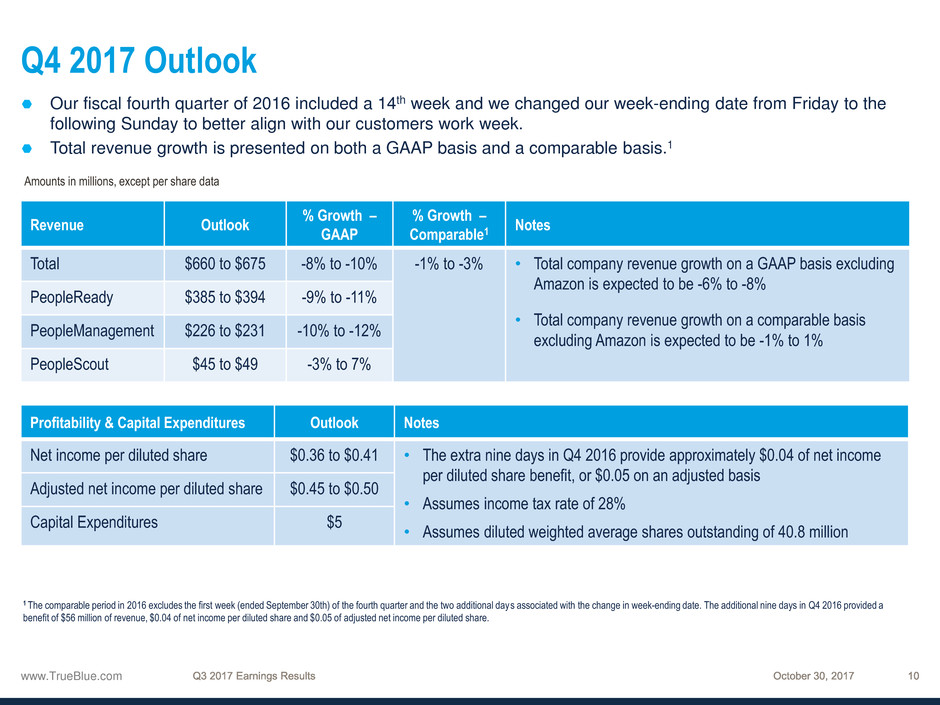
Q4 2017 Outlook
Revenue Outlook
% Growth –
GAAP
% Growth –
Comparable1
Notes
Total $660 to $675 -8% to -10% -1% to -3% • Total company revenue growth on a GAAP basis excluding
Amazon is expected to be -6% to -8%
• Total company revenue growth on a comparable basis
excluding Amazon is expected to be -1% to 1%
PeopleReady $385 to $394 -9% to -11%
PeopleManagement $226 to $231 -10% to -12%
PeopleScout $45 to $49 -3% to 7%
Profitability & Capital Expenditures Outlook Notes
Net income per diluted share $0.36 to $0.41 • The extra nine days in Q4 2016 provide approximately $0.04 of net income
per diluted share benefit, or $0.05 on an adjusted basis
• Assumes income tax rate of 28%
• Assumes diluted weighted average shares outstanding of 40.8 million
Adjusted net income per diluted share $0.45 to $0.50
Capital Expenditures $5
Amounts in millions, except per share data
Our fiscal fourth quarter of 2016 included a 14th week and we changed our week-ending date from Friday to the
following Sunday to better align with our customers work week.
Total revenue growth is presented on both a GAAP basis and a comparable basis.1
1 The comparable period in 2016 excludes the first week (ended September 30th) of the fourth quarter and the two additional days associated with the change in week-ending date. The additional nine days in Q4 2016 provided a
benefit of $56 million of revenue, $0.04 of net income per diluted share and $0.05 of adjusted net income per diluted share.

www.TrueBlue.com
www.TrueBlue.com
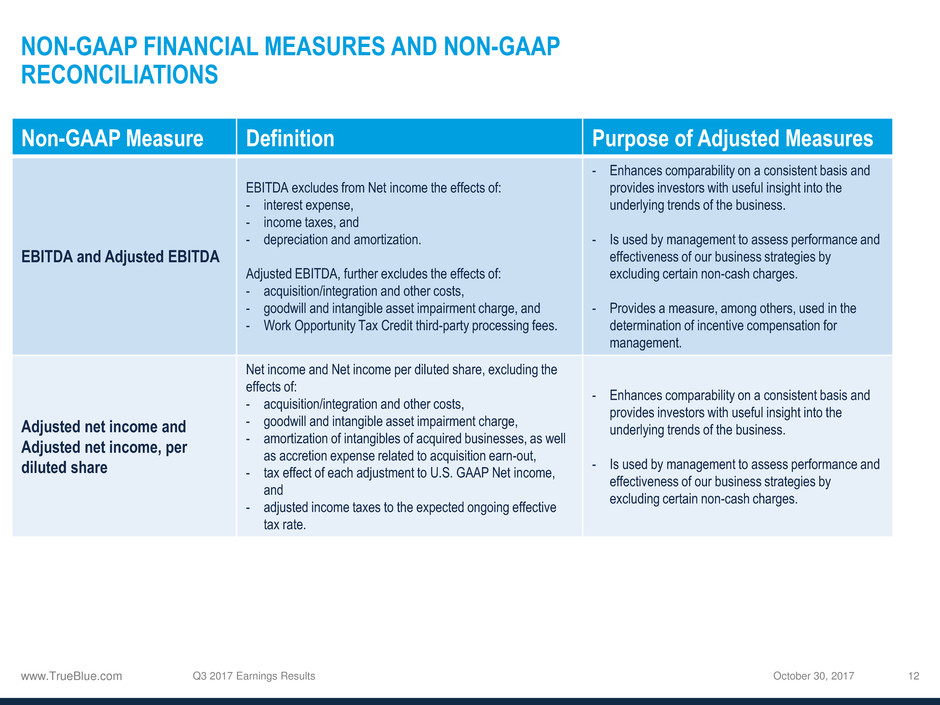
NON-GAAP FINANCIAL MEASURES AND NON-GAAP
RECONCILIATIONS
October 30, 2017 Q3 2017 Earnings Results 12
Non-GAAP Measure Definition Purpose of Adjusted Measures
EBITDA and Adjusted EBITDA
EBITDA excludes from Net income the effects of:
- interest expense,
- income taxes, and
- depreciation and amortization.
Adjusted EBITDA, further excludes the effects of:
- acquisition/integration and other costs,
- goodwill and intangible asset impairment charge, and
- Work Opportunity Tax Credit third-party processing fees.
- Enhances comparability on a consistent basis and
provides investors with useful insight into the
underlying trends of the business.
- Is used by management to assess performance and
effectiveness of our business strategies by
excluding certain non-cash charges.
- Provides a measure, among others, used in the
determination of incentive compensation for
management.
Adjusted net income and
Adjusted net income, per
diluted share
Net income and Net income per diluted share, excluding the
effects of:
- acquisition/integration and other costs,
- goodwill and intangible asset impairment charge,
- amortization of intangibles of acquired businesses, as well
as accretion expense related to acquisition earn-out,
- tax effect of each adjustment to U.S. GAAP Net income,
and
- adjusted income taxes to the expected ongoing effective
tax rate.
- Enhances comparability on a consistent basis and
provides investors with useful insight into the
underlying trends of the business.
- Is used by management to assess performance and
effectiveness of our business strategies by
excluding certain non-cash charges.
www.TrueBlue.com
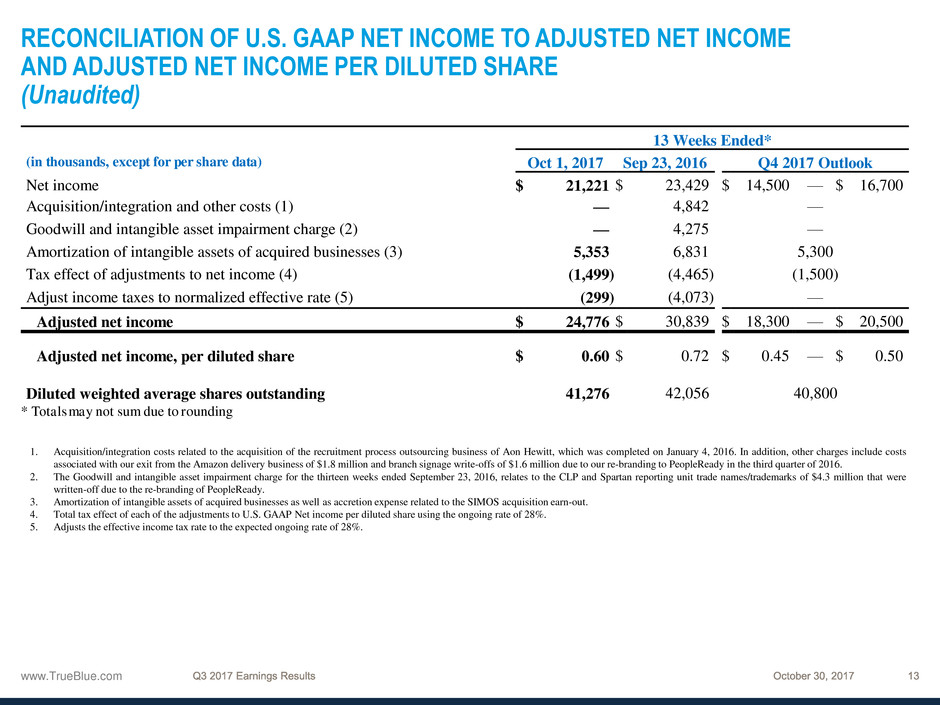
RECONCILIATION OF U.S. GAAP NET INCOME TO ADJUSTED NET INCOME
AND ADJUSTED NET INCOME PER DILUTED SHARE
(Unaudited)
1. Acquisition/integration costs related to the acquisition of the recruitment process outsourcing business of Aon Hewitt, which was completed on January 4, 2016. In addition, other charges include costs
associated with our exit from the Amazon delivery business of $1.8 million and branch signage write-offs of $1.6 million due to our re-branding to PeopleReady in the third quarter of 2016.
2. The Goodwill and intangible asset impairment charge for the thirteen weeks ended September 23, 2016, relates to the CLP and Spartan reporting unit trade names/trademarks of $4.3 million that were
written-off due to the re-branding of PeopleReady.
3. Amortization of intangible assets of acquired businesses as well as accretion expense related to the SIMOS acquisition earn-out.
4. Total tax effect of each of the adjustments to U.S. GAAP Net income per diluted share using the ongoing rate of 28%.
5. Adjusts the effective income tax rate to the expected ongoing rate of 28%.
13 Weeks Ended*
(in thousands, except for per share data) Oct 1, 2017 Sep 23, 2016 Q4 2017 Outlook
Net income $ 21,221 $ 23,429 $ 14,500 — $ 16,700
Acquisition/integration and other costs (1) — 4,842 —
Goodwill and intangible asset impairment charge (2) — 4,275 —
Amortization of intangible assets of acquired businesses (3) 5,353 6,831 5,300
Tax effect of adjustments to net income (4) (1,499 ) (4,465 ) (1,500)
Adjust income taxes to normalized effective rate (5) (299 ) (4,073 ) —
Adjusted net income $ 24,776 $ 30,839 $ 18,300 — $ 20,500
Adjusted net income, per diluted share $ 0.60 $ 0.72 $ 0.45 — $ 0.50
Diluted weighted average shares outstanding 41,276 42,056 40,800
* Totals may not sum due to rounding
www.TrueBlue.com
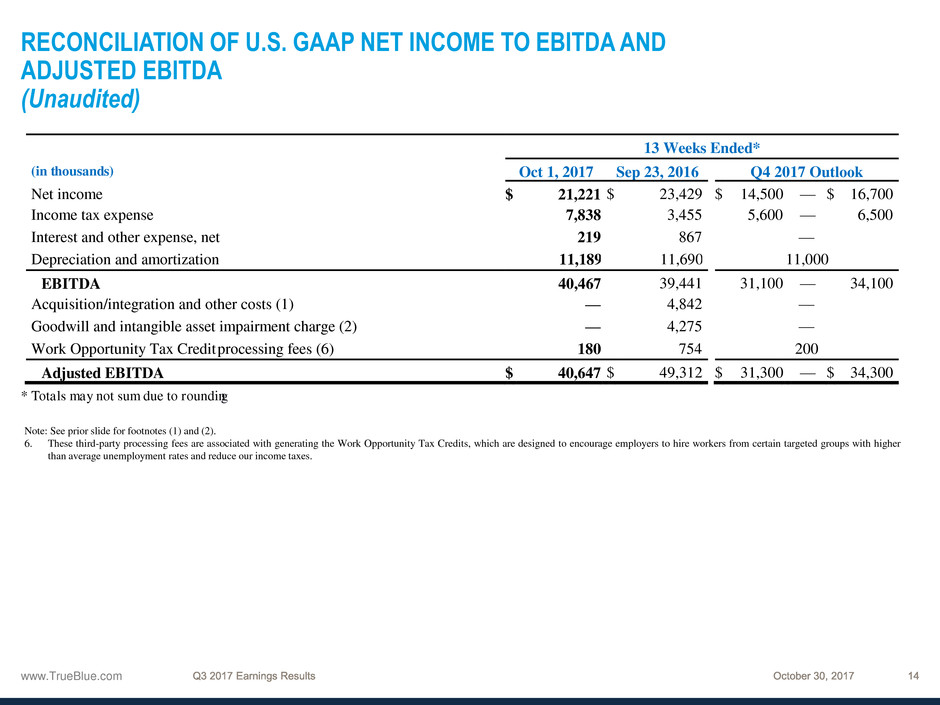
RECONCILIATION OF U.S. GAAP NET INCOME TO EBITDA AND
ADJUSTED EBITDA
(Unaudited)
Note: See prior slide for footnotes (1) and (2).
6. These third-party processing fees are associated with generating the Work Opportunity Tax Credits, which are designed to encourage employers to hire workers from certain targeted groups with higher
than average unemployment rates and reduce our income taxes.
13 Weeks Ended*
(in thousands) Oct 1, 2017 Sep 23, 2016 Q4 2017 Outlook
Net income $ 21,221 $ 23,429 $ 14,500 — $ 16,700
Income tax expense 7,838 3,455 5,600 — 6,500
Interest and other expense, net 219 867 —
Depreciation and amortization 11,189 11,690 11,000
EBITDA 40,467 39,441 31,100 — 34,100
Acquisition/integration and other costs (1) — 4,842 —
Goodwill and intangible asset impairment charge (2) — 4,275 —
Work Opportunity Tax Credit processing fees (6) 180 754 200
Adjusted EBITDA $ 40,647 $ 49,312 $ 31,300 — $ 34,300
* Totals may not sum due to rounding
www.TrueBlue.com
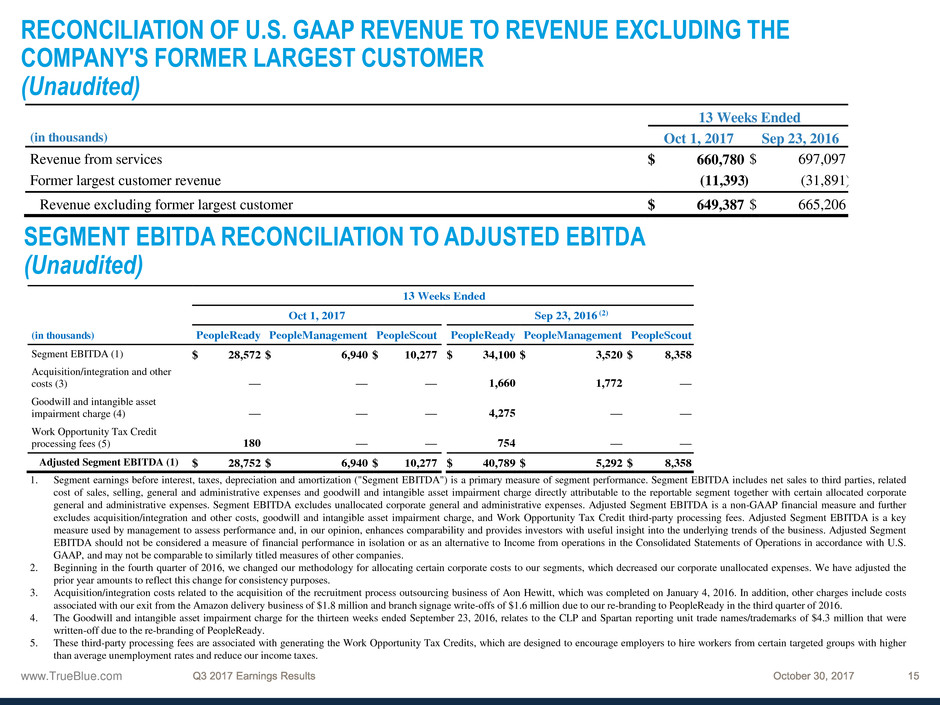
RECONCILIATION OF U.S. GAAP REVENUE TO REVENUE EXCLUDING THE
COMPANY'S FORMER LARGEST CUSTOMER
(Unaudited)
SEGMENT EBITDA RECONCILIATION TO ADJUSTED EBITDA
(Unaudited)
1. Segment earnings before interest, taxes, depreciation and amortization ("Segment EBITDA") is a primary measure of segment performance. Segment EBITDA includes net sales to third parties, related
cost of sales, selling, general and administrative expenses and goodwill and intangible asset impairment charge directly attributable to the reportable segment together with certain allocated corporate
general and administrative expenses. Segment EBITDA excludes unallocated corporate general and administrative expenses. Adjusted Segment EBITDA is a non-GAAP financial measure and further
excludes acquisition/integration and other costs, goodwill and intangible asset impairment charge, and Work Opportunity Tax Credit third-party processing fees. Adjusted Segment EBITDA is a key
measure used by management to assess performance and, in our opinion, enhances comparability and provides investors with useful insight into the underlying trends of the business. Adjusted Segment
EBITDA should not be considered a measure of financial performance in isolation or as an alternative to Income from operations in the Consolidated Statements of Operations in accordance with U.S.
GAAP, and may not be comparable to similarly titled measures of other companies.
2. Beginning in the fourth quarter of 2016, we changed our methodology for allocating certain corporate costs to our segments, which decreased our corporate unallocated expenses. We have adjusted the
prior year amounts to reflect this change for consistency purposes.
3. Acquisition/integration costs related to the acquisition of the recruitment process outsourcing business of Aon Hewitt, which was completed on January 4, 2016. In addition, other charges include costs
associated with our exit from the Amazon delivery business of $1.8 million and branch signage write-offs of $1.6 million due to our re-branding to PeopleReady in the third quarter of 2016.
4. The Goodwill and intangible asset impairment charge for the thirteen weeks ended September 23, 2016, relates to the CLP and Spartan reporting unit trade names/trademarks of $4.3 million that were
written-off due to the re-branding of PeopleReady.
5. These third-party processing fees are associated with generating the Work Opportunity Tax Credits, which are designed to encourage employers to hire workers from certain targeted groups with higher
than average unemployment rates and reduce our income taxes.
13 Weeks Ended
(in thousands) Oct 1, 2017 Sep 23, 2016
Revenue from services $ 660,780 $ 697,097
Former largest customer revenue (11,393 ) (31,891 )
Revenue excluding former largest customer $ 649,387 $ 665,206
13 Weeks Ended
Oct 1, 2017 Sep 23, 2016 (2)
(in thousands) PeopleReady PeopleManagement PeopleScout PeopleReady PeopleManagement PeopleScout
Segment EBITDA (1) $ 28,572 $ 6,940 $ 10,277 $ 34,100 $ 3,520 $ 8,358
Acquisition/integration and other
costs (3) —
—
—
1,660
1,772
—
Goodwill and intangible asset
impairment charge (4) —
—
—
4,275
—
—
Work Opportunity Tax Credit
processing fees (5) 180
—
—
754
—
—
Adjusted Segment EBITDA (1) $ 28,752 $ 6,940 $ 10,277 $ 40,789 $ 5,292 $ 8,358