
www.TrueBlue.com
www.TrueBlue.com
Forward-Looking Statements
www.TrueBlue.com
Q1 2017 Summary
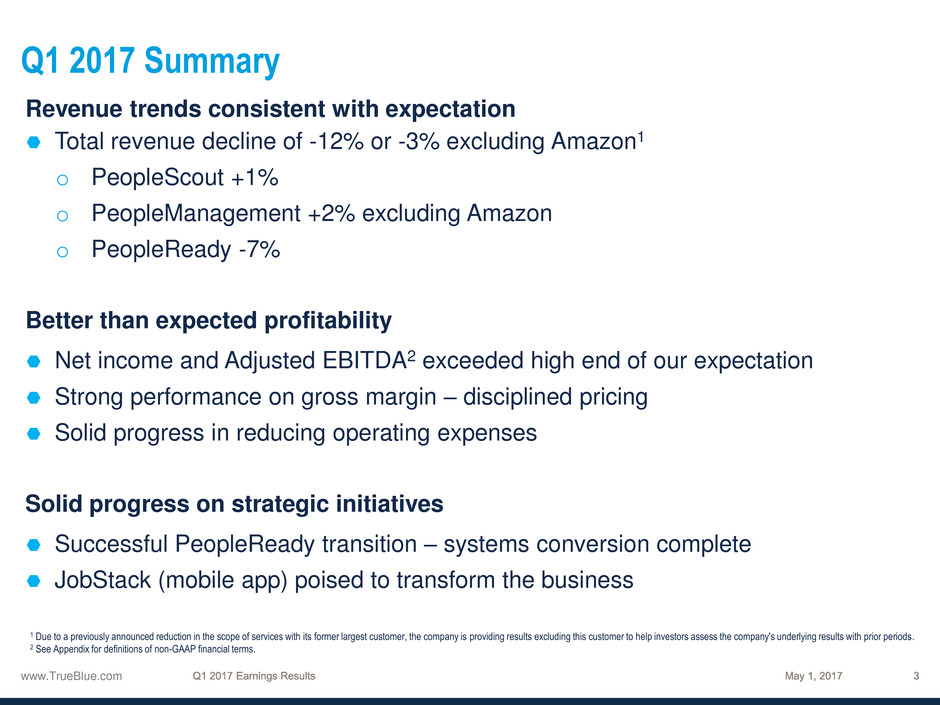
Revenue trends consistent with expectation
Total revenue decline of -12% or -3% excluding Amazon1
o PeopleScout +1%
o PeopleManagement +2% excluding Amazon
o PeopleReady -7%
Better than expected profitability
Net income and Adjusted EBITDA2 exceeded high end of our expectation
Strong performance on gross margin – disciplined pricing
Solid progress in reducing operating expenses
Solid progress on strategic initiatives
Successful PeopleReady transition – systems conversion complete
JobStack (mobile app) poised to transform the business
1 Due to a previously announced reduction in the scope of services with its former largest customer, the company is providing results excluding this customer to help investors assess the company's underlying results with prior periods.
2 See Appendix for definitions of non-GAAP financial terms.
www.TrueBlue.com
Financial Summary
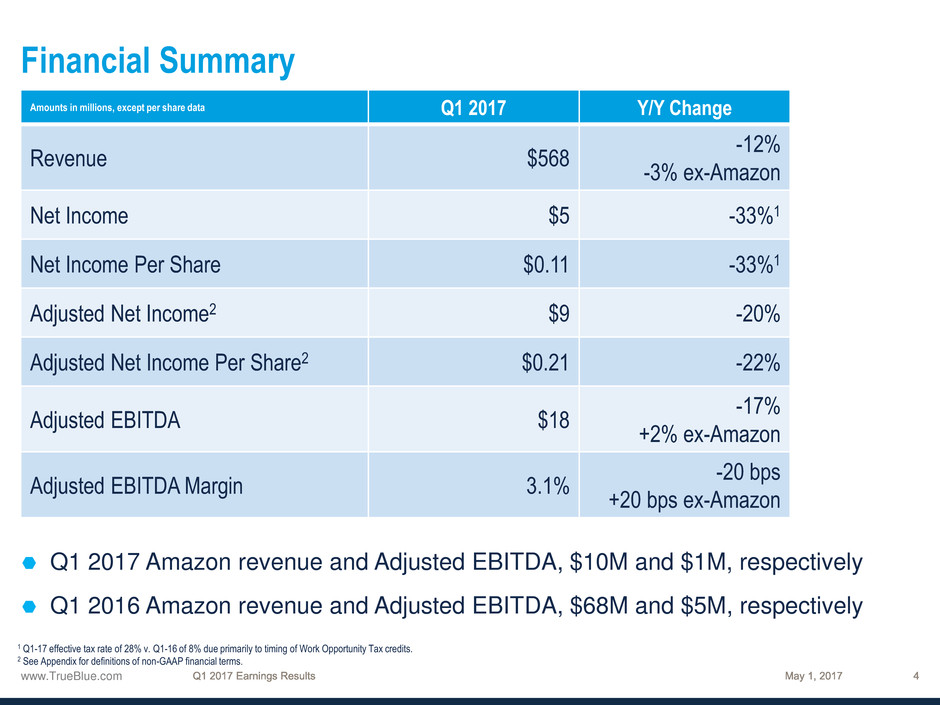
Q1 2017 Amazon revenue and Adjusted EBITDA, $10M and $1M, respectively
Q1 2016 Amazon revenue and Adjusted EBITDA, $68M and $5M, respectively
Amounts in millions, except per share data Q1 2017 Y/Y Change
Revenue $568
-12%
-3% ex-Amazon
Net Income $5 -33%1
Net Income Per Share $0.11 -33%1
Adjusted Net Income2 $9 -20%
Adjusted Net Income Per Share2 $0.21 -22%
Adjusted EBITDA $18
-17%
+2% ex-Amazon
Adjusted EBITDA Margin 3.1%
-20 bps
+20 bps ex-Amazon
1 Q1-17 effective tax rate of 28% v. Q1-16 of 8% due primarily to timing of Work Opportunity Tax credits.
2 See Appendix for definitions of non-GAAP financial terms.
www.TrueBlue.com
Gross Margin and SG&A Bridges
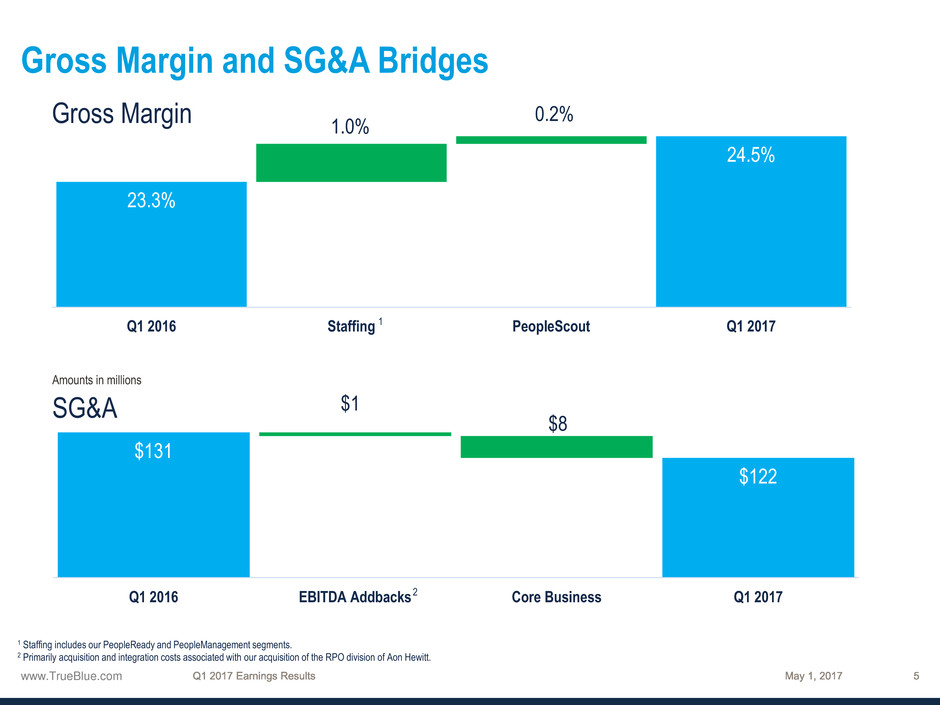
SG&A
Amounts in millions
Gross Margin
23.3%
24.5%
1.0%
0.2%
Q1 2016 Staffing PeopleScout Q1 2017
$131
$122
$1
$8
Q1 2016 EBITDA Addbacks Core Business Q1 2017
1
1 Staffing includes our PeopleReady and PeopleManagement segments.
2 Primarily acquisition and integration costs associated with our acquisition of the RPO division of Aon Hewitt.
2
www.TrueBlue.com
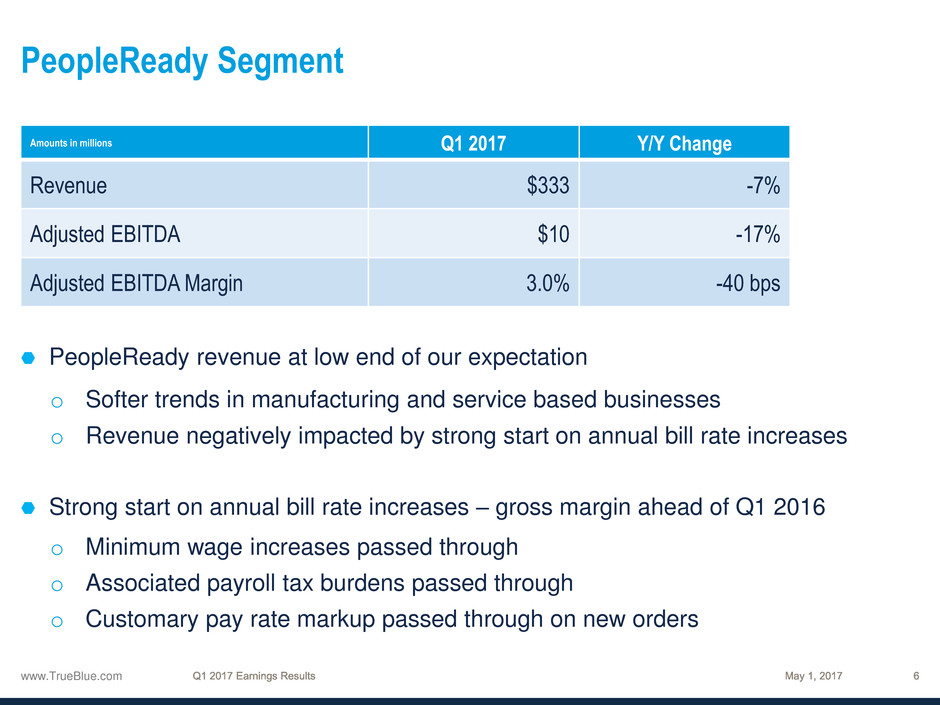
PeopleReady Segment
PeopleReady revenue at low end of our expectation
o Softer trends in manufacturing and service based businesses
o Revenue negatively impacted by strong start on annual bill rate increases
Strong start on annual bill rate increases – gross margin ahead of Q1 2016
o Minimum wage increases passed through
o Associated payroll tax burdens passed through
o Customary pay rate markup passed through on new orders
Amounts in millions Q1 2017 Y/Y Change
Revenue $333 -7%
Adjusted EBITDA $10 -17%
Adjusted EBITDA Margin 3.0% -40 bps
www.TrueBlue.com
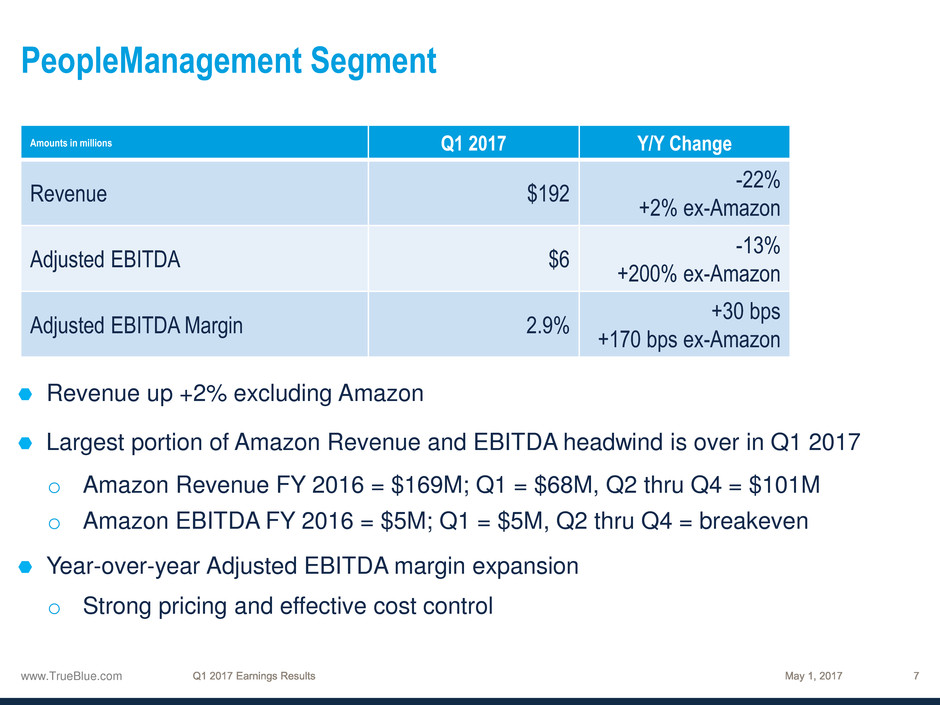
PeopleManagement Segment
Amounts in millions Q1 2017 Y/Y Change
Revenue $192
-22%
+2% ex-Amazon
Adjusted EBITDA $6
-13%
+200% ex-Amazon
Adjusted EBITDA Margin 2.9%
+30 bps
+170 bps ex-Amazon
Revenue up +2% excluding Amazon
Largest portion of Amazon Revenue and EBITDA headwind is over in Q1 2017
o Amazon Revenue FY 2016 = $169M; Q1 = $68M, Q2 thru Q4 = $101M
o Amazon EBITDA FY 2016 = $5M; Q1 = $5M, Q2 thru Q4 = breakeven
Year-over-year Adjusted EBITDA margin expansion
o Strong pricing and effective cost control
www.TrueBlue.com
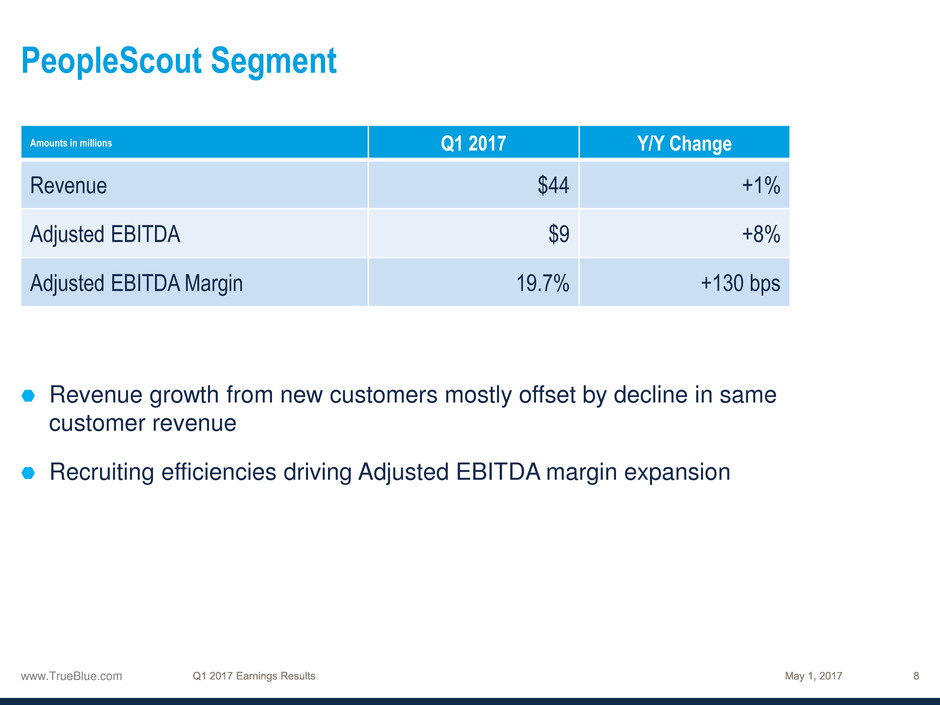
PeopleScout Segment
Revenue growth from new customers mostly offset by decline in same
customer revenue
Recruiting efficiencies driving Adjusted EBITDA margin expansion
Amounts in millions Q1 2017 Y/Y Change
Revenue $44 +1%
Adjusted EBITDA $9 +8%
Adjusted EBITDA Margin 19.7% +130 bps
www.TrueBlue.com
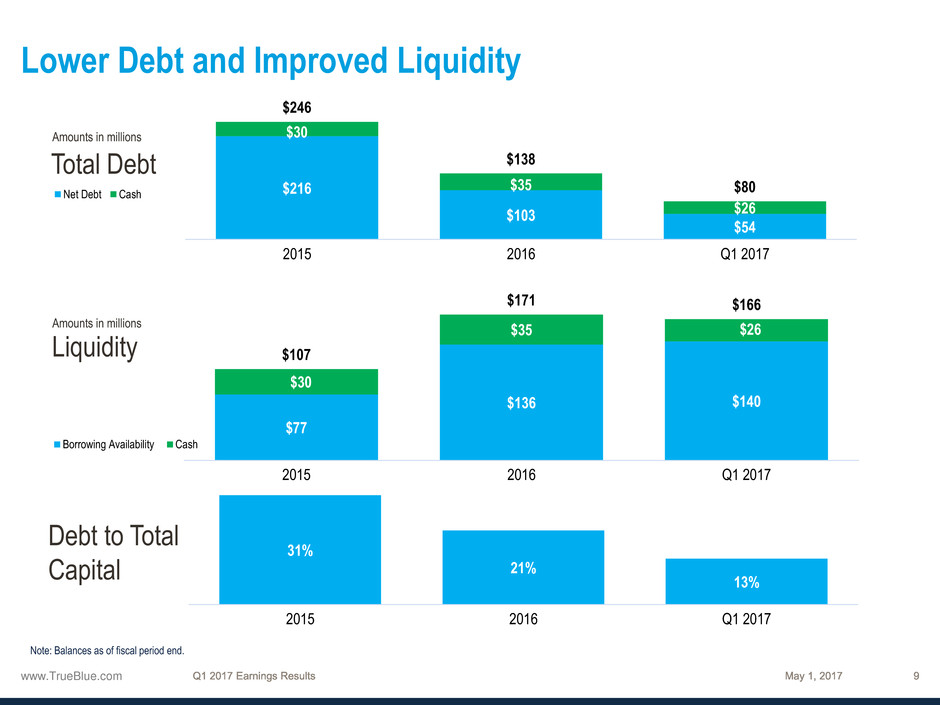
$216
$103
$54
$30
$35
$26
$246
$138
$80
2015 2016 Q1 2017
Net Debt Cash
$77
$136 $140
$30
$35 $26
$107
$171 $166
2015 2016 Q1 2017
Borrowing Availability Cash
Lower Debt and Improved Liquidity
31%
21%
13%
2015 2016 Q1 2017
Total Debt
Liquidity
Debt to Total
Capital
Amounts in millions
Amounts in millions
Note: Balances as of fiscal period end.
www.TrueBlue.com
Executing Segment Strategies
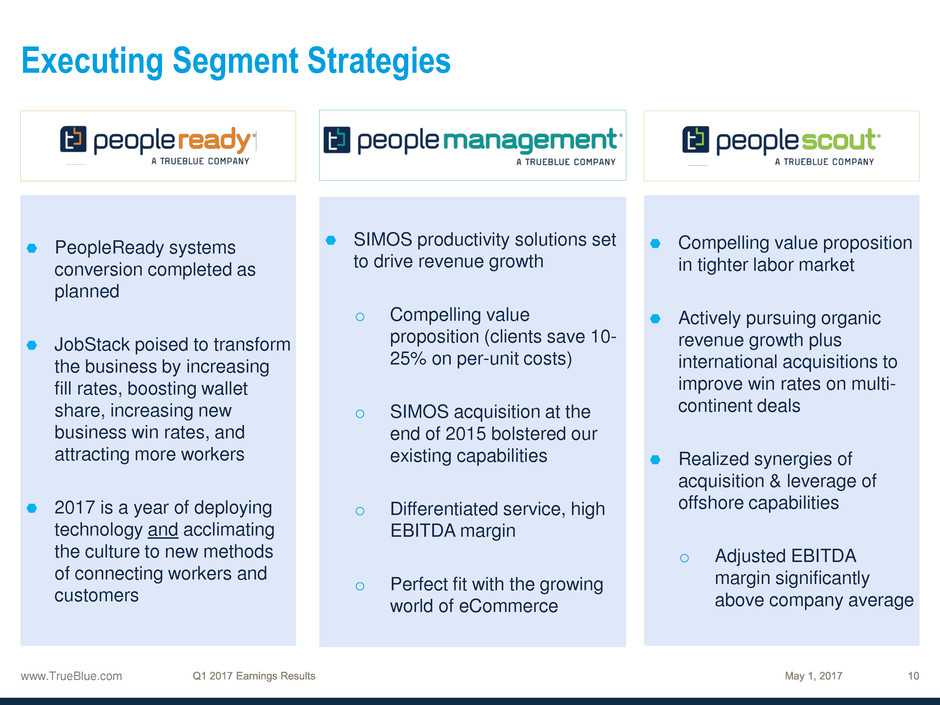
PeopleReady systems
conversion completed as
planned
JobStack poised to transform
the business by increasing
fill rates, boosting wallet
share, increasing new
business win rates, and
attracting more workers
2017 is a year of deploying
technology and acclimating
the culture to new methods
of connecting workers and
customers
SIMOS productivity solutions set
to drive revenue growth
o Compelling value
proposition (clients save 10-
25% on per-unit costs)
o SIMOS acquisition at the
end of 2015 bolstered our
existing capabilities
o Differentiated service, high
EBITDA margin
o Perfect fit with the growing
world of eCommerce
Compelling value proposition
in tighter labor market
Actively pursuing organic
revenue growth plus
international acquisitions to
improve win rates on multi-
continent deals
Realized synergies of
acquisition & leverage of
offshore capabilities
o Adjusted EBITDA
margin significantly
above company average

www.TrueBlue.com
www.TrueBlue.com
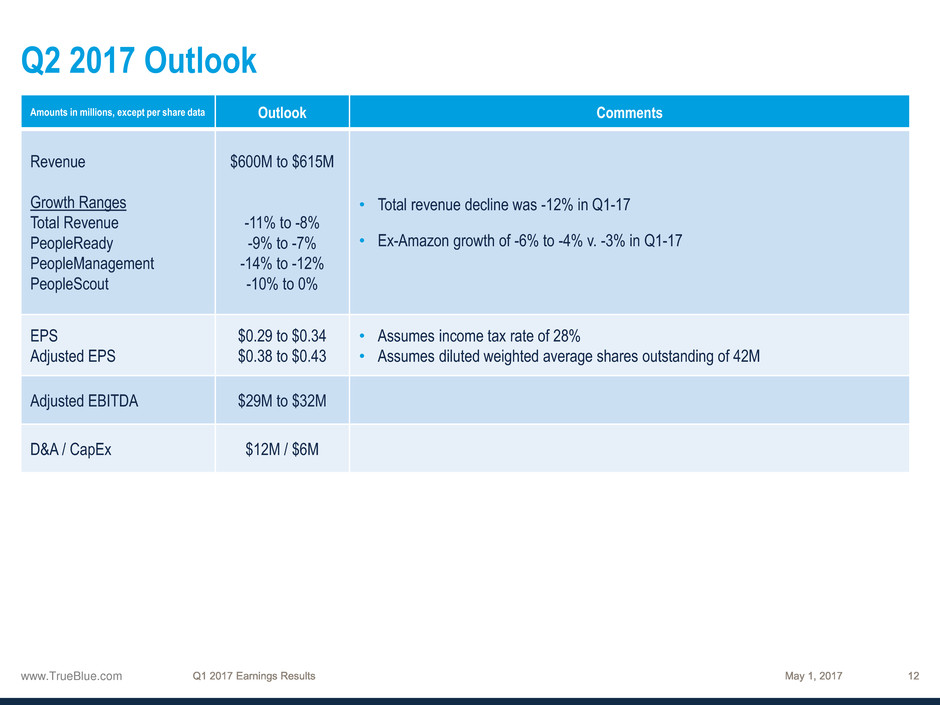
Q2 2017 Outlook
Amounts in millions, except per share data Outlook Comments
Revenue
Growth Ranges
Total Revenue
PeopleReady
PeopleManagement
PeopleScout
$600M to $615M
-11% to -8%
-9% to -7%
-14% to -12%
-10% to 0%
• Total revenue decline was -12% in Q1-17
• Ex-Amazon growth of -6% to -4% v. -3% in Q1-17
EPS
Adjusted EPS
$0.29 to $0.34
$0.38 to $0.43
• Assumes income tax rate of 28%
• Assumes diluted weighted average shares outstanding of 42M
Adjusted EBITDA $29M to $32M
D&A / CapEx $12M / $6M

www.TrueBlue.com
www.TrueBlue.com
Non-GAAP Terms and Definitions
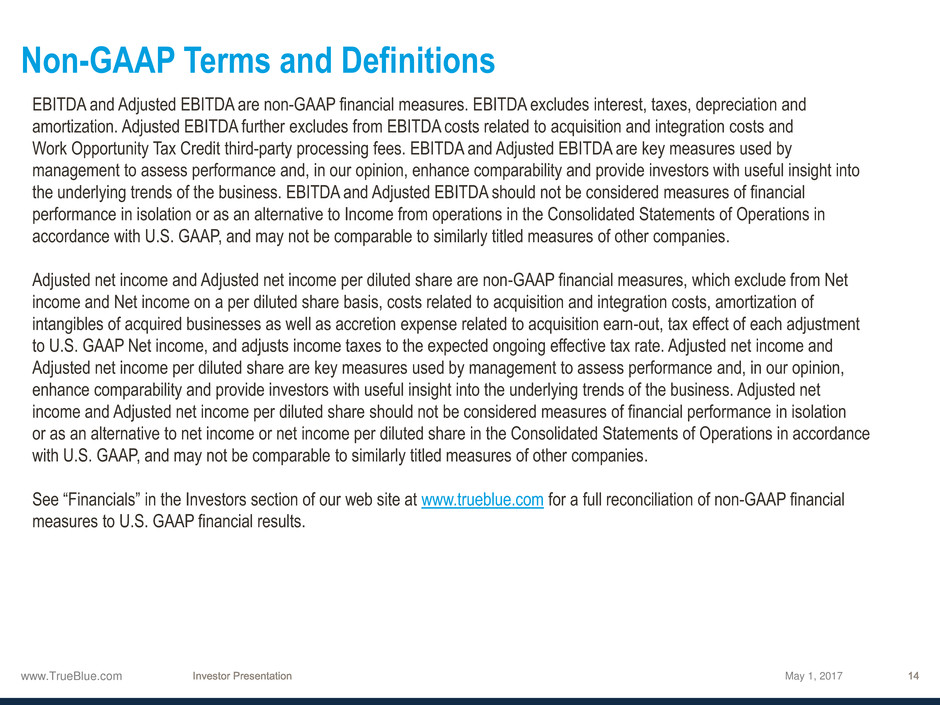
EBITDA and Adjusted EBITDA are non-GAAP financial measures. EBITDA excludes interest, taxes, depreciation and
amortization. Adjusted EBITDA further excludes from EBITDA costs related to acquisition and integration costs and
Work Opportunity Tax Credit third-party processing fees. EBITDA and Adjusted EBITDA are key measures used by
management to assess performance and, in our opinion, enhance comparability and provide investors with useful insight into
the underlying trends of the business. EBITDA and Adjusted EBITDA should not be considered measures of financial
performance in isolation or as an alternative to Income from operations in the Consolidated Statements of Operations in
accordance with U.S. GAAP, and may not be comparable to similarly titled measures of other companies.
Adjusted net income and Adjusted net income per diluted share are non-GAAP financial measures, which exclude from Net
income and Net income on a per diluted share basis, costs related to acquisition and integration costs, amortization of
intangibles of acquired businesses as well as accretion expense related to acquisition earn-out, tax effect of each adjustment
to U.S. GAAP Net income, and adjusts income taxes to the expected ongoing effective tax rate. Adjusted net income and
Adjusted net income per diluted share are key measures used by management to assess performance and, in our opinion,
enhance comparability and provide investors with useful insight into the underlying trends of the business. Adjusted net
income and Adjusted net income per diluted share should not be considered measures of financial performance in isolation
or as an alternative to net income or net income per diluted share in the Consolidated Statements of Operations in accordance
with U.S. GAAP, and may not be comparable to similarly titled measures of other companies.
See “Financials” in the Investors section of our web site at www.trueblue.com for a full reconciliation of non-GAAP financial
measures to U.S. GAAP financial results.
May 1, 2017