
Forward-Looking Statements
February 2017
TrueBlue at a Glance
February 2017 3
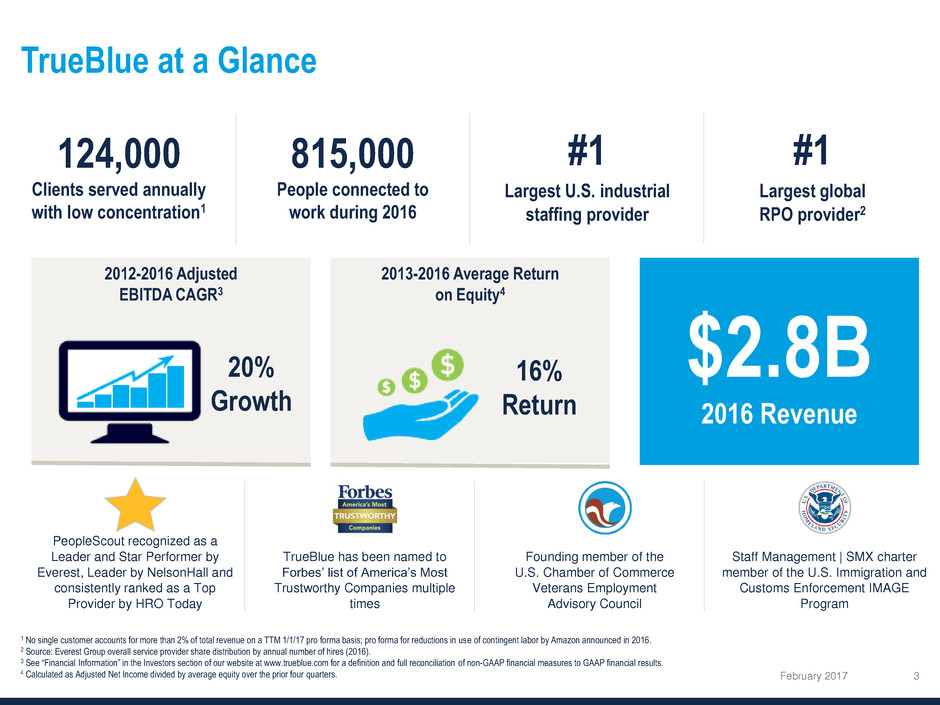
124,000
Clients served annually
with low concentration1
815,000
People connected to
work during 2016
#1
Largest U.S. industrial
staffing provider
#1
Largest global
RPO provider2
2013-2016 Average Return
on Equity4
2012-2016 Adjusted
EBITDA CAGR3
$2.8B
2016 Revenue
20%
Growth
16%
Return
PeopleScout recognized as a
Leader and Star Performer by
Everest, Leader by NelsonHall and
consistently ranked as a Top
Provider by HRO Today
TrueBlue has been named to
Forbes’ list of America’s Most
Trustworthy Companies multiple
times
Founding member of the
U.S. Chamber of Commerce
Veterans Employment
Advisory Council
Staff Management | SMX charter
member of the U.S. Immigration and
Customs Enforcement IMAGE
Program
1 No single customer accounts for more than 2% of total revenue on a TTM 1/1/17 pro forma basis; pro forma for reductions in use of contingent labor by Amazon announced in 2016.
2 Source: Everest Group overall service provider share distribution by annual number of hires (2016).
3 See “Financial Information” in the Investors section of our website at www.trueblue.com for a definition and full reconciliation of non-GAAP financial measures to GAAP financial results.
4 Calculated as Adjusted Net Income divided by average equity over the prior four quarters.
Investment Highlights
Specialized Service Offerings to Meet Client Needs
February 2017
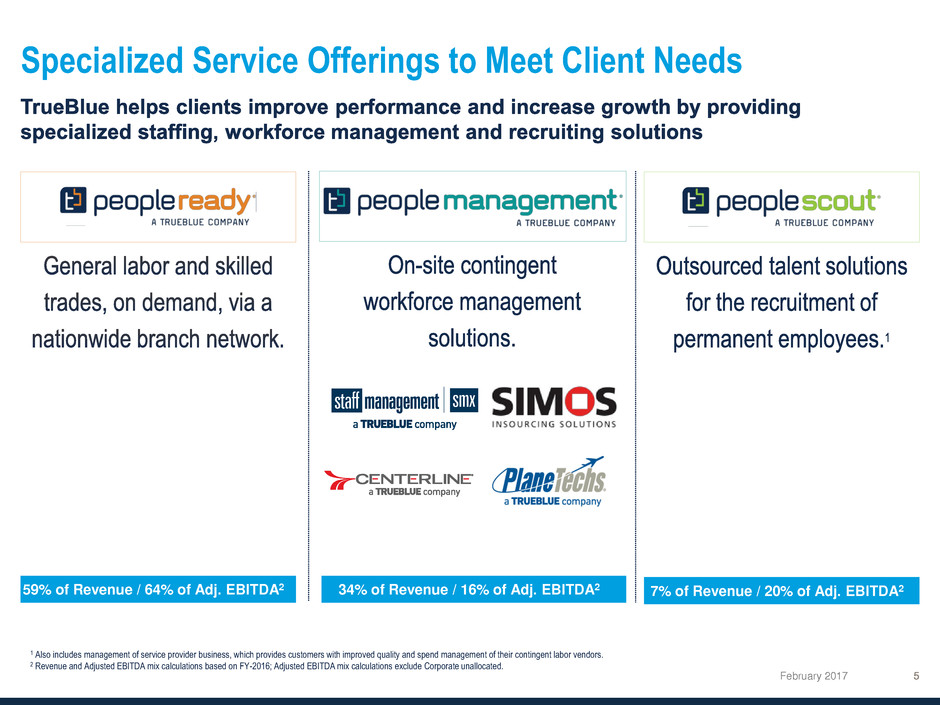
7% of Revenue / 20% of Adj. EBITDA2 34% of Revenue / 16% of Adj. EBITDA2 59% of Revenue / 64% of Adj. EBITDA2
1 Also includes management of service provider business, which provides customers with improved quality and spend management of their contingent labor vendors.
2 Revenue and Adjusted EBITDA mix calculations based on FY-2016; Adjusted EBITDA mix calculations exclude Corporate unallocated.
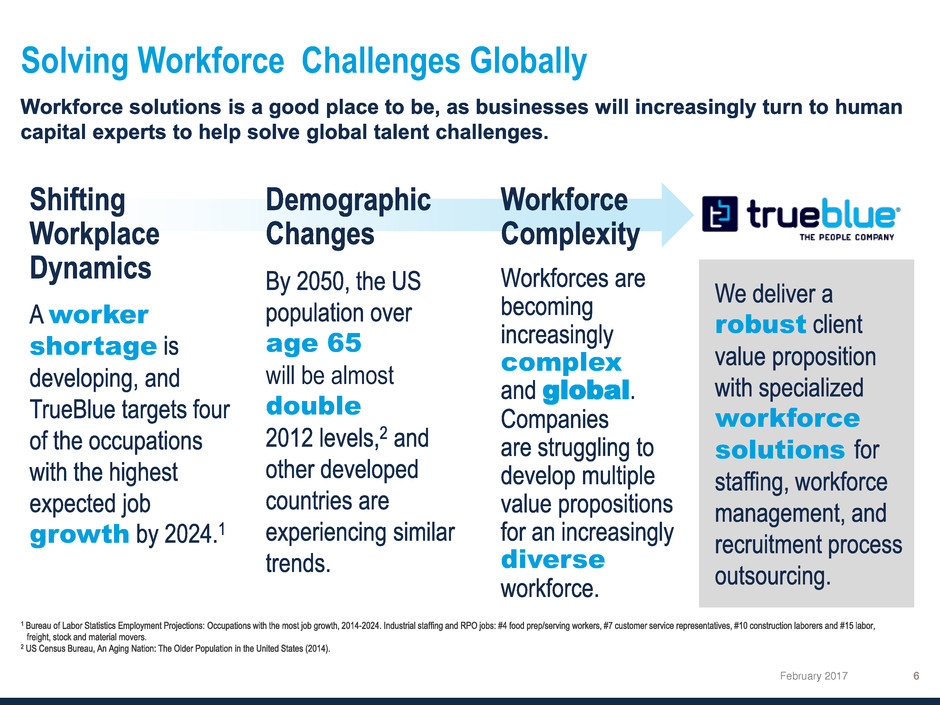
Solving Workforce Challenges Globally
February 2017
complex
global
diverse
age 65
will be almost
double
worker
shortage
growth
robust
workforce
solutions

Construction Manufacturing Transport & Wholesale Retail
In
d
u
s
tr
y
D
y
n
a
m
ic
s
Housing Starts Have Not Kept Pace US Manufacturing Renaissance Wholesale Trade At New High eCommerce Growing % of Retail Sales
Source: U.S. Census Bureau Source: U.S. Board of Governors of the Federal Reserve System (FRB) Source: Bureau of Labor Statistics Source: US Census Bureau
60
65
70
75
80
85
90
95
100
105
110
19
90
19
92
19
94
19
96
19
98
20
00
20
02
20
04
20
06
20
08
20
10
20
12
20
14
20
16
Industrial Production
Index
4%
5%
6%
7%
8%
9%
10%
11%
12%
13%
19
92
19
94
19
96
19
98
20
00
20
02
20
04
20
06
20
08
20
10
20
12
20
14
20
16
eCommerce % of Retail Sales
3.0
3.5
4.0
4.5
5.0
5.5
19
90
19
92
19
94
19
96
19
98
20
00
20
02
20
04
20
06
20
08
20
10
20
12
20
14
20
16
Transportation and Warehousing Employment
Millions
Strong Position in Attractive Vertical Markets
February 2017
-
500
1,000
1,500
2,000
2,500
150
170
190
210
230
250
270
290
310
330
350
19
70
19
75
19
80
19
85
19
90
19
95
20
00
20
05
20
10
20
15
US Population Housing Permits
Millions Thousands
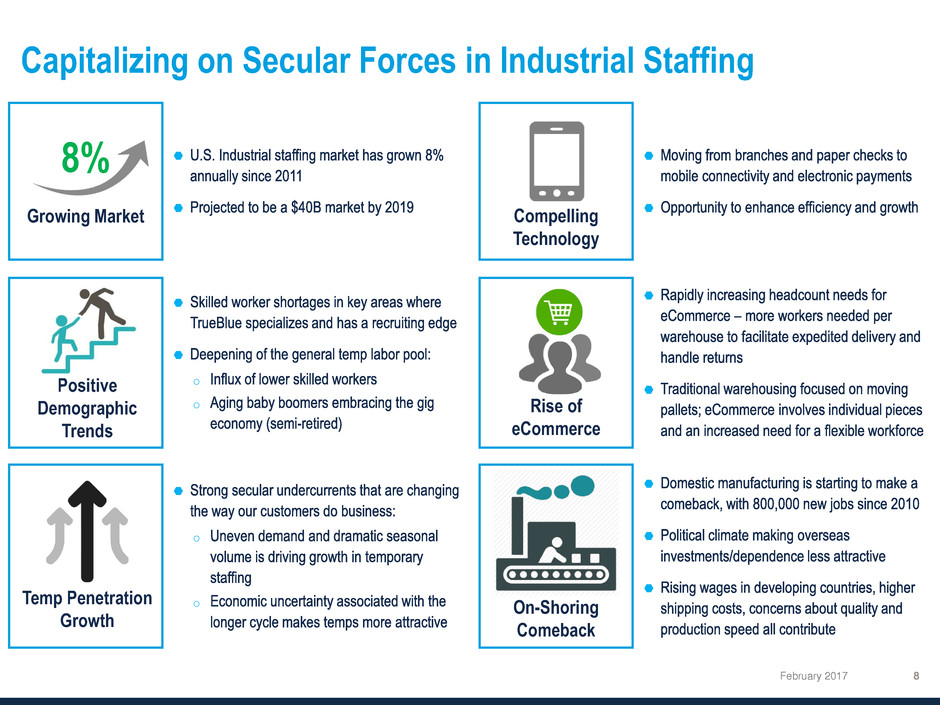
8%
Growing Market
Capitalizing on Secular Forces in Industrial Staffing
February 2017
o
o
o
o
Positive
Demographic
Trends
Temp Penetration
Growth
Compelling
Technology
Rise of
eCommerce
On-Shoring
Comeback
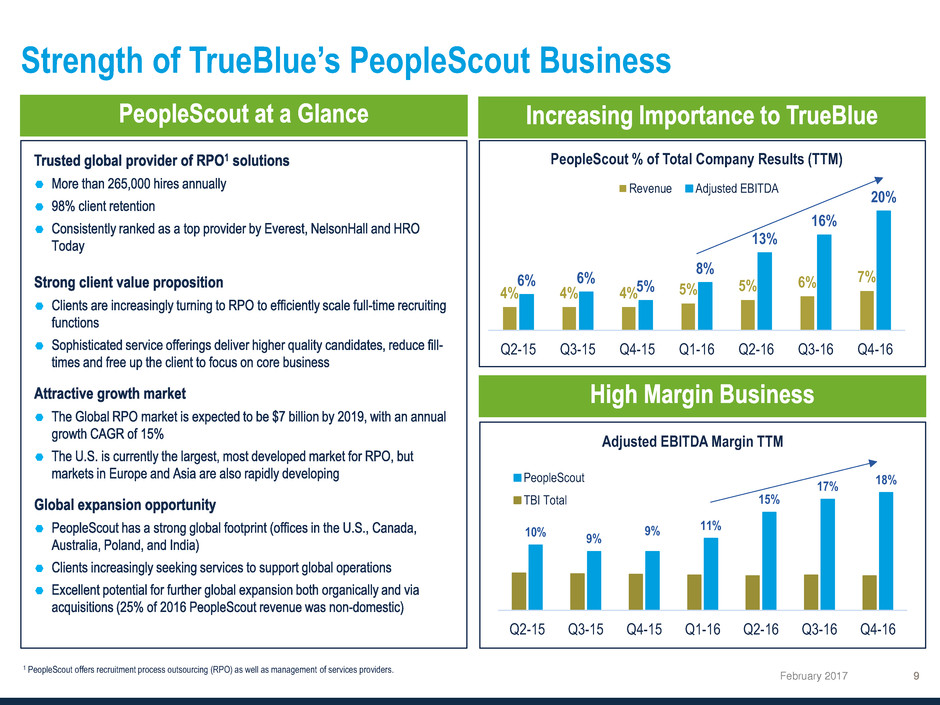
Strength of TrueBlue’s PeopleScout Business
February 2017
4% 4% 4% 5% 5%
6% 7% 6% 6% 5%
8%
13%
16%
20%
Q2-15 Q3-15 Q4-15 Q1-16 Q2-16 Q3-16 Q4-16
PeopleScout % of Total Company Results (TTM)
Revenue Adjusted EBITDA
18%
17%
15%
11% 9%
9%
10%
Q4-16Q3-16Q2-16Q1-16Q4-15Q3-15Q2-15
Adjusted EBITDA Margin TTM
PeopleScout
TBI Total
1 PeopleScout offers recruitment process outsourcing (RPO) as well as management of services providers.
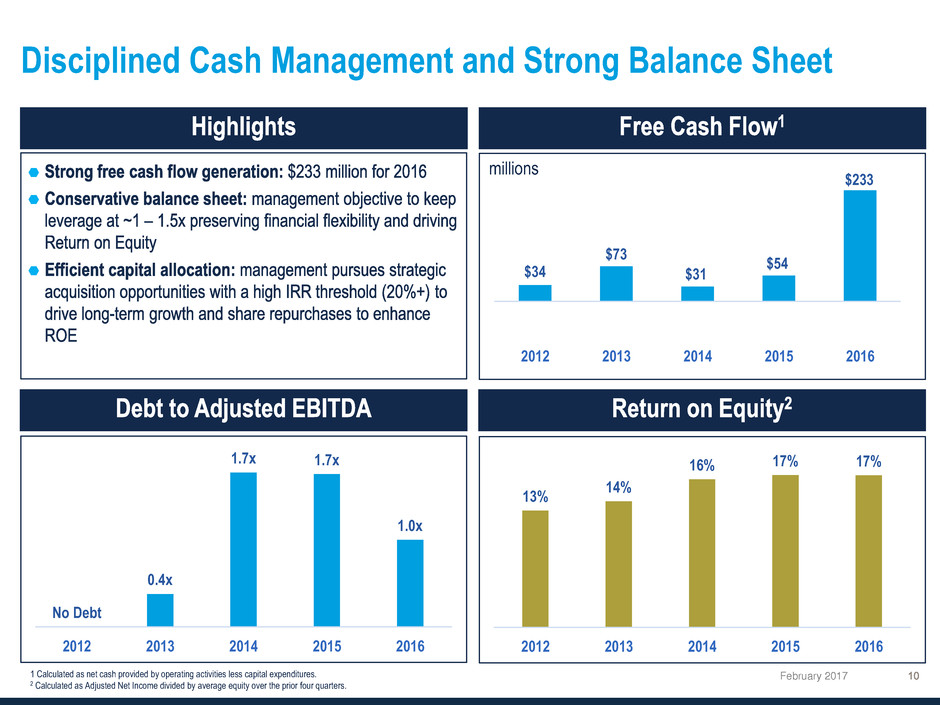
Disciplined Cash Management and Strong Balance Sheet
February 2017 1 Calculated as net cash provided by operating activities less capital expenditures.
2 Calculated as Adjusted Net Income divided by average equity over the prior four quarters.
$34
$73
$31
$54
$233
2012 2013 2014 2015 2016
No Debt
0.4x
1.7x 1.7x
1.0x
2012 2013 2014 2015 2016
13%
14%
16% 17% 17%
2012 2013 2014 2015 2016
millions
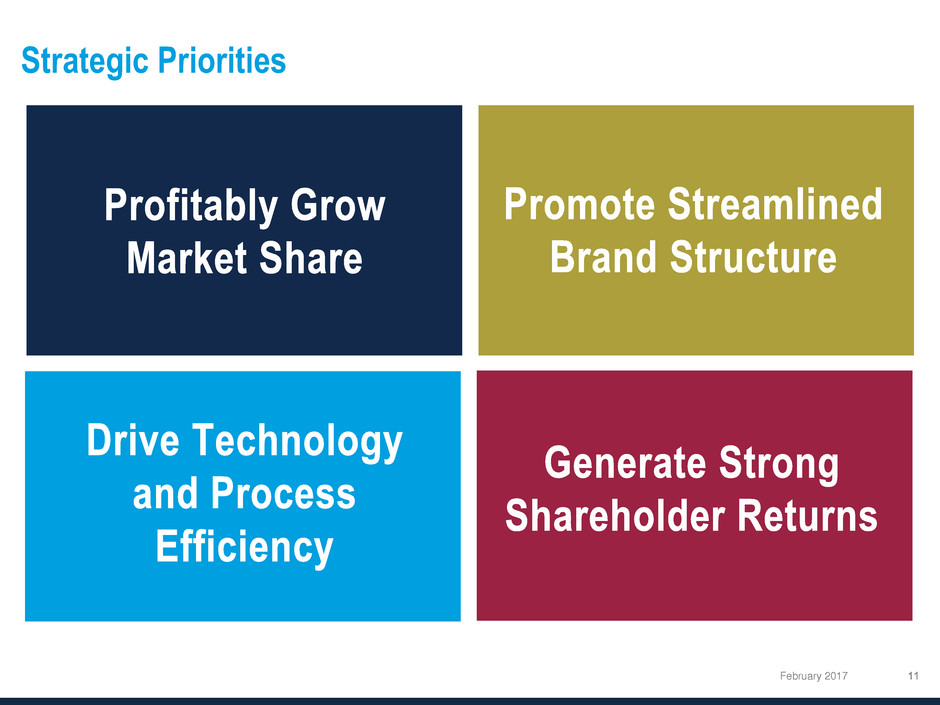
Strategic Priorities
February 2017
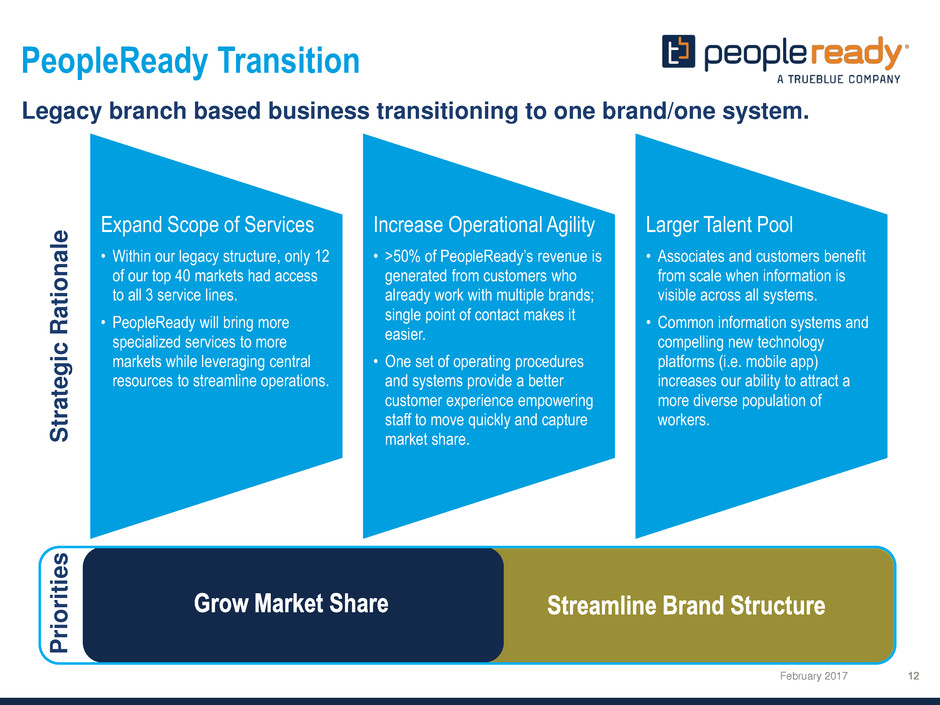
PeopleReady Transition
February 2017
Legacy branch based business transitioning to one brand/one system.
Expand Scope of Services
• Within our legacy structure, only 12
of our top 40 markets had access
to all 3 service lines.
• PeopleReady will bring more
specialized services to more
markets while leveraging central
resources to streamline operations.
Increase Operational Agility
• >50% of PeopleReady’s revenue is
generated from customers who
already work with multiple brands;
single point of contact makes it
easier.
• One set of operating procedures
and systems provide a better
customer experience empowering
staff to move quickly and capture
market share.
Larger Talent Pool
• Associates and customers benefit
from scale when information is
visible across all systems.
• Common information systems and
compelling new technology
platforms (i.e. mobile app)
increases our ability to attract a
more diverse population of
workers.
Str
a
tegic R
a
ti
o
nal
e
Priorit
ie
s
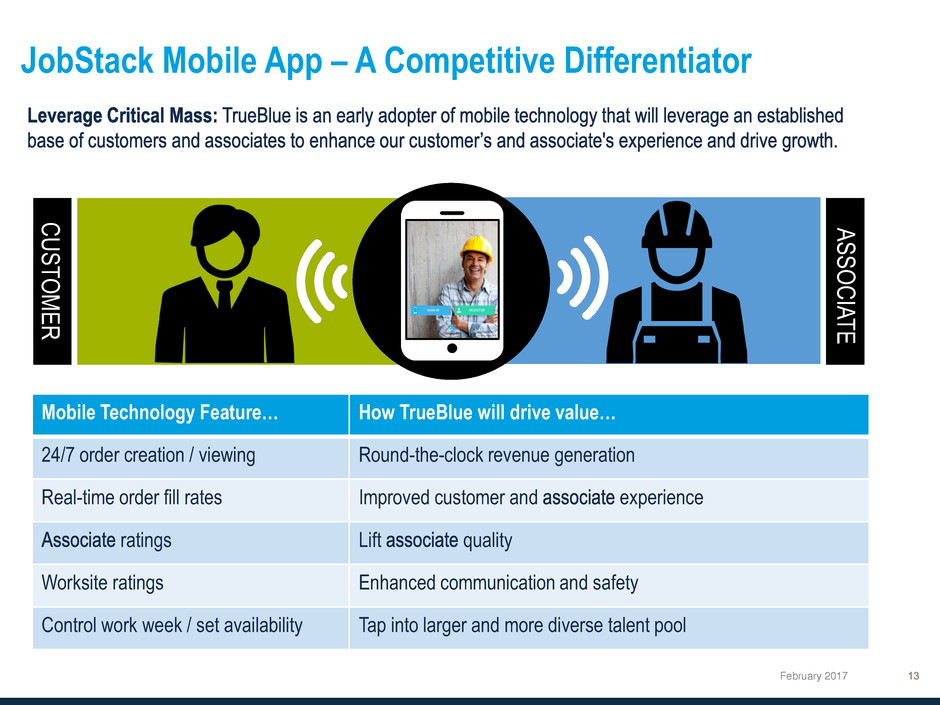
JobStack Mobile App – A Competitive Differentiator
February 2017
CUSTOMER
ASSOCIATE
Mobile Technology Feature… How TrueBlue will drive value…
24/7 order creation / viewing Round-the-clock revenue generation
Real-time order fill rates Improved customer and experience
ratings Lift quality
Worksite ratings Enhanced communication and safety
Control work week / set availability Tap into larger and more diverse talent pool

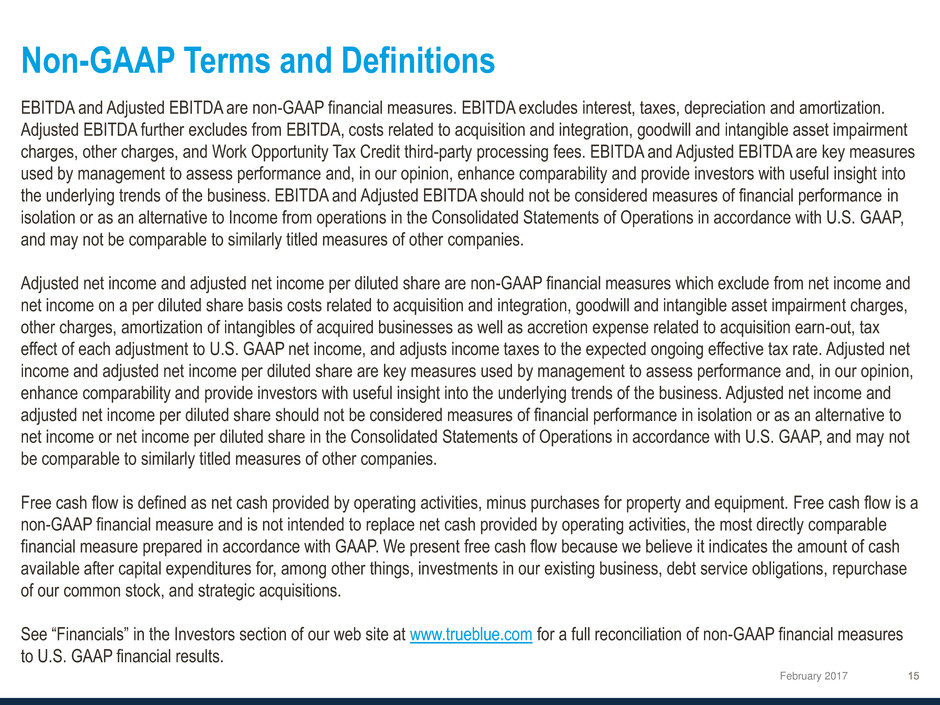
Non-GAAP Terms and Definitions
February 2017
EBITDA and Adjusted EBITDA are non-GAAP financial measures. EBITDA excludes interest, taxes, depreciation and amortization.
Adjusted EBITDA further excludes from EBITDA, costs related to acquisition and integration, goodwill and intangible asset impairment
charges, other charges, and Work Opportunity Tax Credit third-party processing fees. EBITDA and Adjusted EBITDA are key measures
used by management to assess performance and, in our opinion, enhance comparability and provide investors with useful insight into
the underlying trends of the business. EBITDA and Adjusted EBITDA should not be considered measures of financial performance in
isolation or as an alternative to Income from operations in the Consolidated Statements of Operations in accordance with U.S. GAAP,
and may not be comparable to similarly titled measures of other companies.
Adjusted net income and adjusted net income per diluted share are non-GAAP financial measures which exclude from net income and
net income on a per diluted share basis costs related to acquisition and integration, goodwill and intangible asset impairment charges,
other charges, amortization of intangibles of acquired businesses as well as accretion expense related to acquisition earn-out, tax
effect of each adjustment to U.S. GAAP net income, and adjusts income taxes to the expected ongoing effective tax rate. Adjusted net
income and adjusted net income per diluted share are key measures used by management to assess performance and, in our opinion,
enhance comparability and provide investors with useful insight into the underlying trends of the business. Adjusted net income and
adjusted net income per diluted share should not be considered measures of financial performance in isolation or as an alternative to
net income or net income per diluted share in the Consolidated Statements of Operations in accordance with U.S. GAAP, and may not
be comparable to similarly titled measures of other companies.
Free cash flow is defined as net cash provided by operating activities, minus purchases for property and equipment. Free cash flow is a
non-GAAP financial measure and is not intended to replace net cash provided by operating activities, the most directly comparable
financial measure prepared in accordance with GAAP. We present free cash flow because we believe it indicates the amount of cash
available after capital expenditures for, among other things, investments in our existing business, debt service obligations, repurchase
of our common stock, and strategic acquisitions.
See “Financials” in the Investors section of our web site at www.trueblue.com for a full reconciliation of non-GAAP financial measures
to U.S. GAAP financial results.