
2 Certain statements made by us in this presentation that are not historical facts or that relate to future plans, events or performances are forward-looking statements that reflect management’s current outlook for future periods, including statements regarding future financial performance. These forward-looking statements are based upon our current expectations, and our actual results may differ materially from those described or contemplated in the forward–looking statements. Factors that may cause our actual results to differ materially from those contained in the forward-looking statements, include without limitation the following: 1) national and global economic conditions, including the impact of changes in national and global credit markets and other changes that affect our customers; 2) our ability to continue to attract and retain customers and maintain profit margins in the face of new and existing competition; 3) new laws and regulations that could have a materially adverse effect on our operations and financial results; 4) increased costs and collateral requirements in connection with our insurance obligations, including workers’ compensation insurance; 5) our continuing ability to comply with the financial covenants of our credit agreement; 6) our ability to attract and retain qualified employees in key positions or to find temporary and permanent employees with the right skills to fulfill the needs of our customers; 7) our ability to successfully complete and integrate acquisitions that we may make; and 8) other risks described in our most recent filings with the Securities and Exchange Commission. Use of estimates and forecasts: Any references made to fiscal 2016 are based on management guidance issued February 3, 2016, and are included for informational purposes only and are not an update or reaffirmation. We assume no obligation to update or revise any forward-looking statement, whether as a result of new information, future events, or otherwise, except as required by law. Any other reference to future financial estimates are included for informational purposes only and subject to risk factors discussed in our most recent filings with the Securities Exchange Commission. February 2016 Investor Presentation
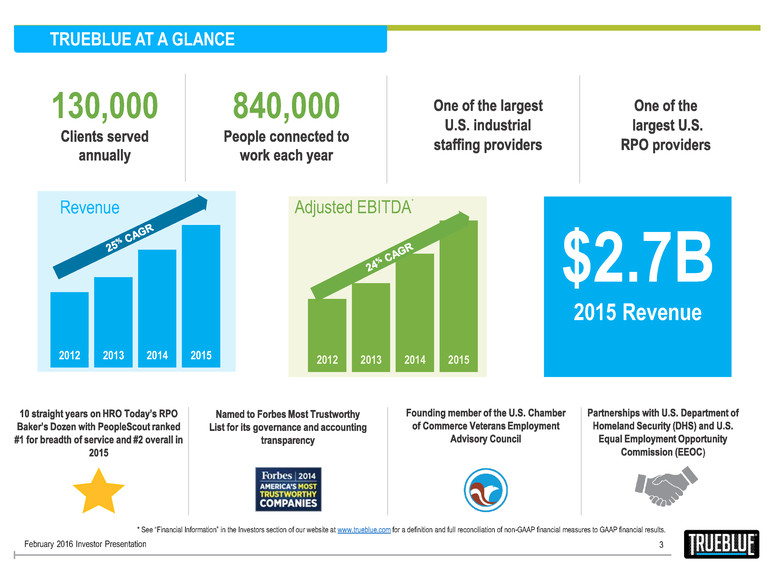
2012 2013 2014 2015 ) $2.7B 2015 Revenue 3 130,000 840,000 * See “Financial Information” in the Investors section of our website at www.trueblue.com for a definition and full reconciliation of non-GAAP financial measures to GAAP financial results. 2012 2013 2014 Revenue Adjusted EBITDA * February 2016 Investor Presentation 2012 2013 2014 2015 TRUEBLUE AT A GLANCE
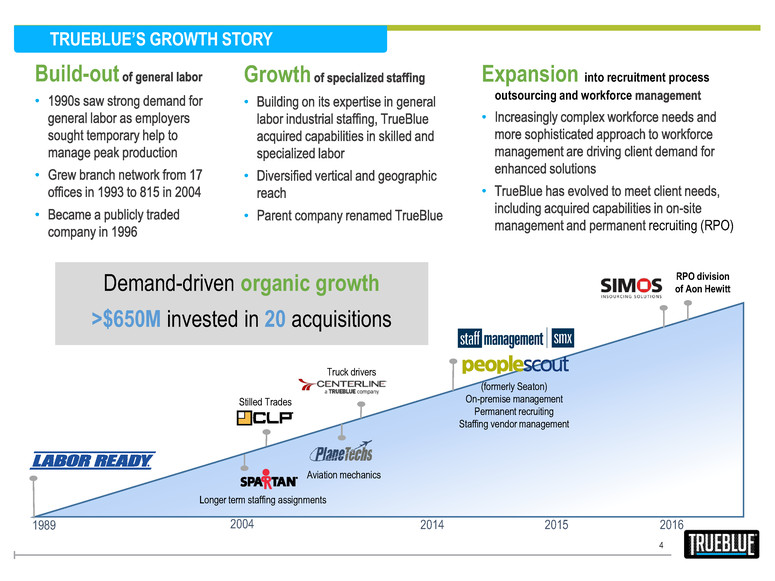
Demand-driven organic growth >$650M invested in 20 acquisitions 4 1989 Build-out • • • 2004 Growth • • • Expansion into recruitment process outsourcing and workforce • • recruiting (RPO) 2014 Longer term staffing assignments Stilled Trades Aviation mechanics Truck drivers (formerly Seaton) On-premise management Permanent recruiting Staffing vendor management 2015 TRUEBLUE’S GROWTH STORY RPO division of Aon Hewitt 2016
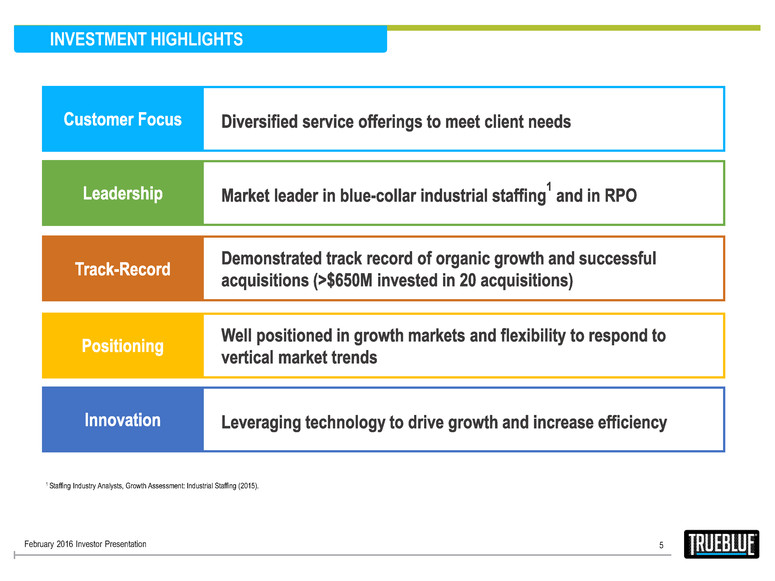
1 Staffing Industry Analysts, Growth Assessment: Industrial Staffing (2015). February 2016 Investor Presentation 5 INVESTMENT HIGHLIGHTS
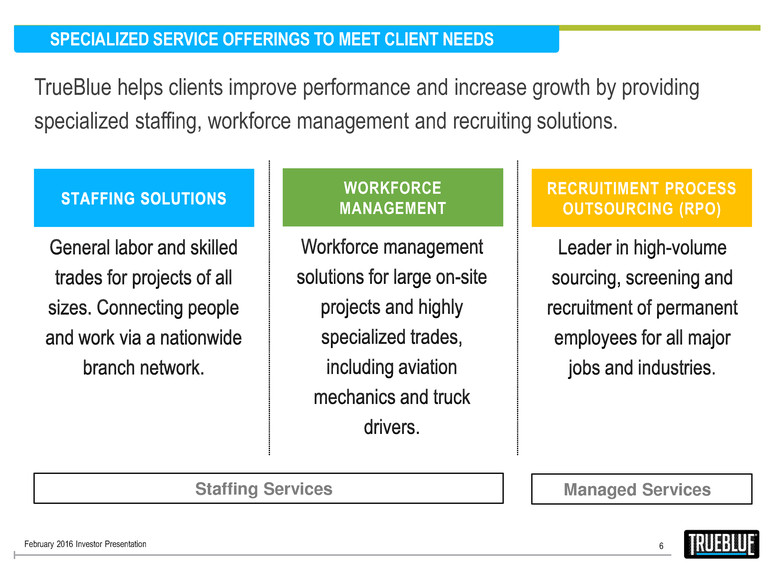
6 WORKFORCE MANAGEMENT RECRUITIMENT PROCESS OUTSOURCING (RPO) TrueBlue helps clients improve performance and increase growth by providing specialized staffing, workforce management and recruiting solutions. February 2016 Investor Presentation SPECIALIZED SERVICE OFFERINGS TO MEET CLIENT NEEDS Staffing Services Managed Services
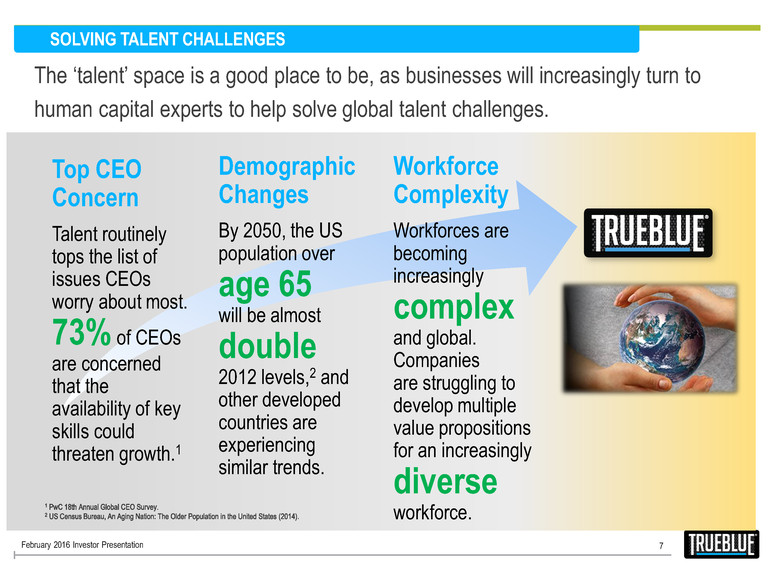
7 February 2016 Investor Presentation SOLVING TALENT CHALLENGES The ‘talent’ space is a good place to be, as businesses will increasingly turn to human capital experts to help solve global talent challenges. Workforce Complexity Workforces are becoming increasingly complex and global. Companies are struggling to develop multiple value propositions for an increasingly diverse workforce. Demographic Changes By 2050, the US population over age 65 will be almost double 2012 levels,2 and other developed countries are experiencing similar trends. Top CEO Concern Talent routinely tops the list of issues CEOs worry about most. 73% of CEOs are concerned that the availability of key skills could threaten growth.1
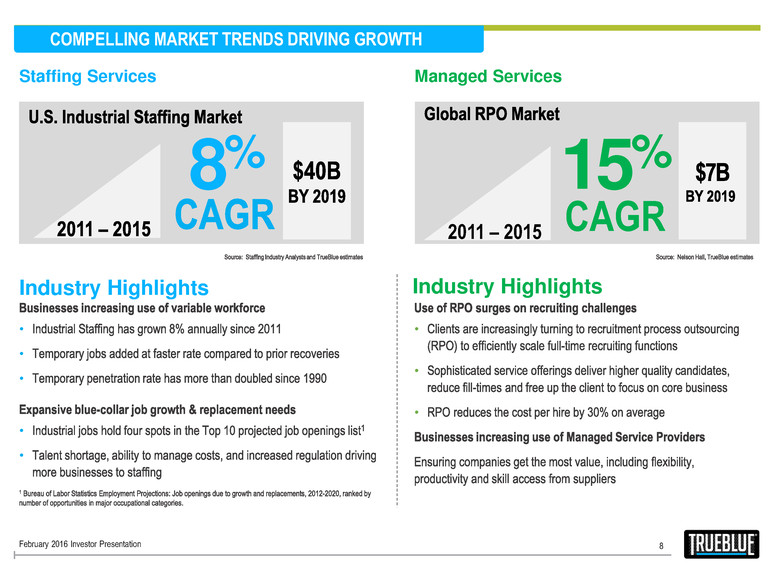
8% • • • • • • • • 8 Staffing Services Managed Services Industry Highlights CAGR 15% 2011 – 2015 Industry Highlights February 2016 Investor Presentation COMPELLING MARKET TRENDS DRIVING GROWTH
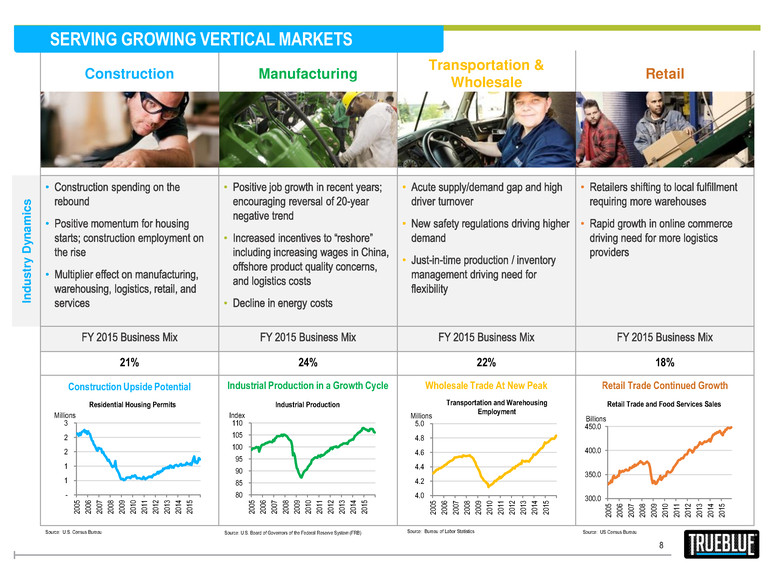
Construction Manufacturing Transportation & Wholesale Retail In d u s tr y D y n a m ic s • • • • • • • • • • • 21% 24% 22% 18% Construction Upside Potential Industrial Production in a Growth Cycle Wholesale Trade At New Peak Retail Trade Continued Growth Source: U.S. Census Bureau Source: U.S. Board of Governors of the Federal Reserve System (FRB) Source: Bureau of Labor Statistics Source: US Census Bureau 300.0 350.0 400.0 450.0 20 05 20 06 20 07 20 08 20 09 20 10 20 11 20 12 20 13 20 14 20 15 Retail Trade and Food Services Sales Billions 4.0 4.2 4.4 4.6 4.8 5.0 20 05 20 06 20 07 20 08 20 09 20 10 20 11 20 12 20 13 20 14 20 15 Transportation and Warehousing Employment Millions 80 85 90 95 100 105 110 20 05 20 06 20 07 20 08 20 09 20 10 20 11 20 12 20 13 20 14 20 15 Industrial Production Index 8 - 1 1 2 2 3 20 05 20 06 20 07 20 08 20 09 20 10 20 11 20 12 20 13 20 14 20 15 Residential Housing Permits Millions SERVING GROWING VERTICAL MARKETS
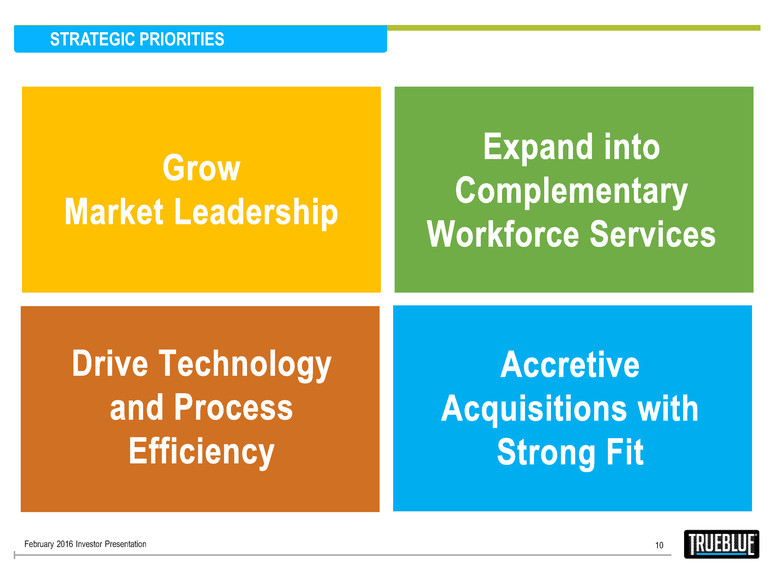
10 February 2016 Investor Presentation STRATEGIC PRIORITIES

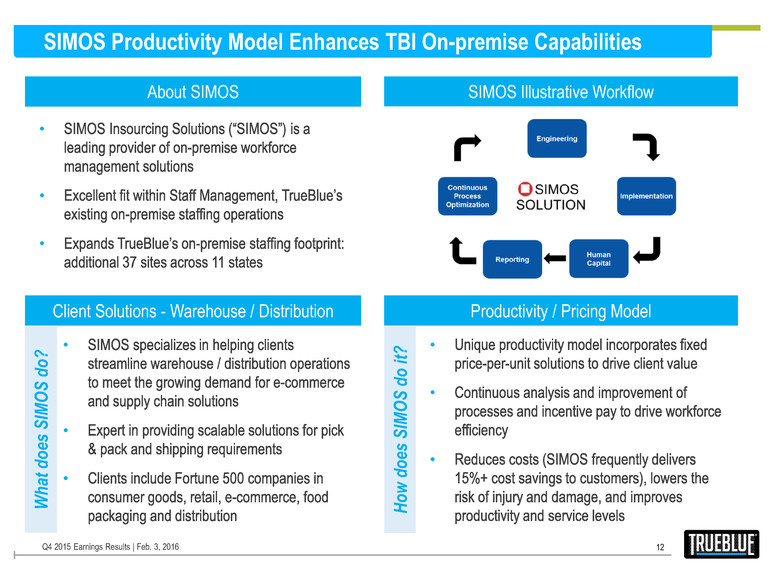
SIMOS Productivity Model Enhances TBI On-premise Capabilities 12 Q4 2015 Earnings Results | Feb. 3, 2016 • • • About SIMOS SIMOS Illustrative Workflow Client Solutions - Warehouse / Distribution Productivity / Pricing Model • • • • • • W h at d o es SI M O S d o ? Ho w d o es SI M O S d o it ?
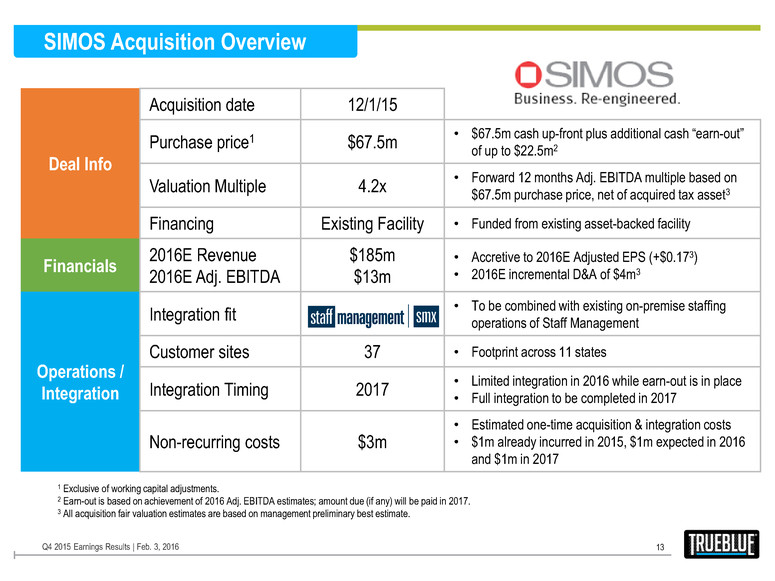
SIMOS Acquisition Overview 13 Q4 2015 Earnings Results | Feb. 3, 2016 Deal Info Acquisition date 12/1/15 Purchase price1 $67.5m • $67.5m cash up-front plus additional cash “earn-out” of up to $22.5m2 Valuation Multiple 4.2x • Forward 12 months Adj. EBITDA multiple based on $67.5m purchase price, net of acquired tax asset3 Financing Existing Facility • Funded from existing asset-backed facility Financials 2016E Revenue 2016E Adj. EBITDA $185m $13m • Accretive to 2016E Adjusted EPS (+$0.173) • 2016E incremental D&A of $4m3 Operations / Integration Integration fit • To be combined with existing on-premise staffing operations of Staff Management Customer sites 37 • Footprint across 11 states Integration Timing 2017 • Limited integration in 2016 while earn-out is in place • Full integration to be completed in 2017 Non-recurring costs $3m • Estimated one-time acquisition & integration costs • $1m already incurred in 2015, $1m expected in 2016 and $1m in 2017 1 Exclusive of working capital adjustments. 2 Earn-out is based on achievement of 2016 Adj. EBITDA estimates; amount due (if any) will be paid in 2017. 3 All acquisition fair valuation estimates are based on management preliminary best estimate.
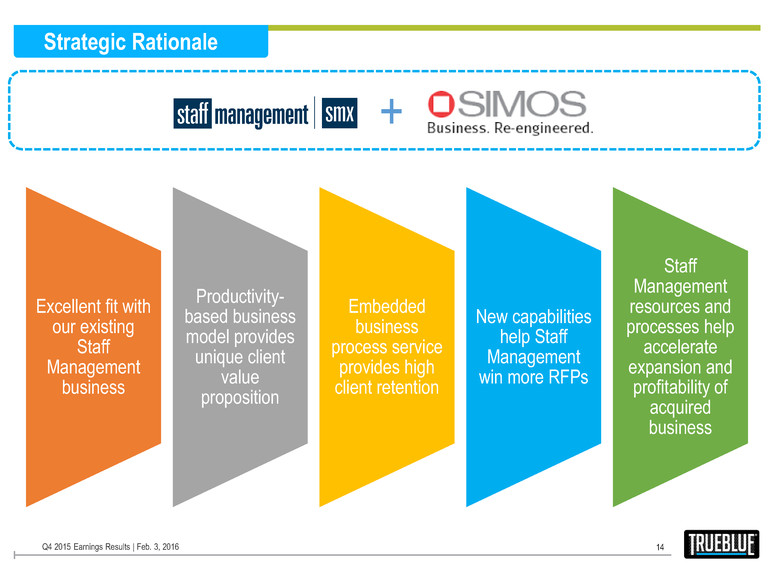
Strategic Rationale 14 Q4 2015 Earnings Results | Feb. 3, 2016 Excellent fit with our existing Staff Management business Productivity- based business model provides unique client value proposition Embedded business process service provides high client retention New capabilities help Staff Management win more RFPs Staff Management resources and processes help accelerate expansion and profitability of acquired business +
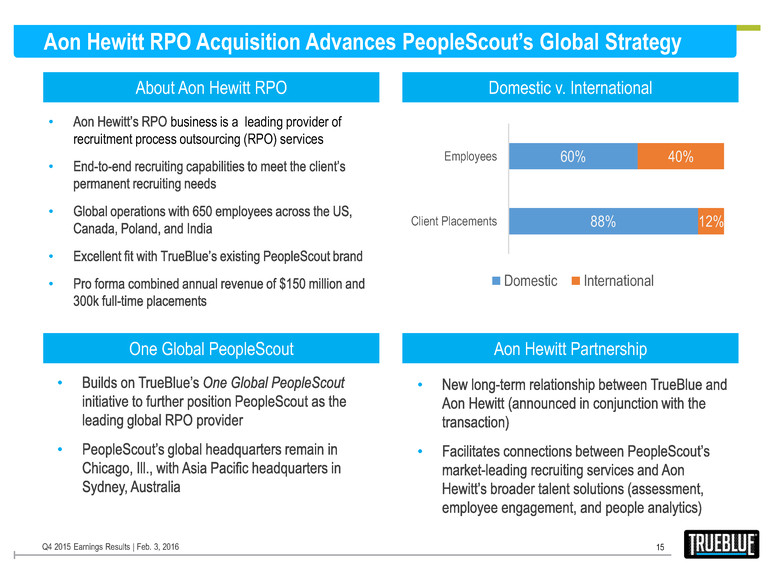
Aon Hewitt RPO Acquisition Advances PeopleScout’s Global Strategy 15 Q4 2015 Earnings Results | Feb. 3, 2016 • business is a leading provider of recruitment process outsourcing (RPO) services • • • • About Aon Hewitt RPO Domestic v. International One Global PeopleScout Aon Hewitt Partnership • • • • 88% 60% 12% 40% Client Placements Employees Domestic International
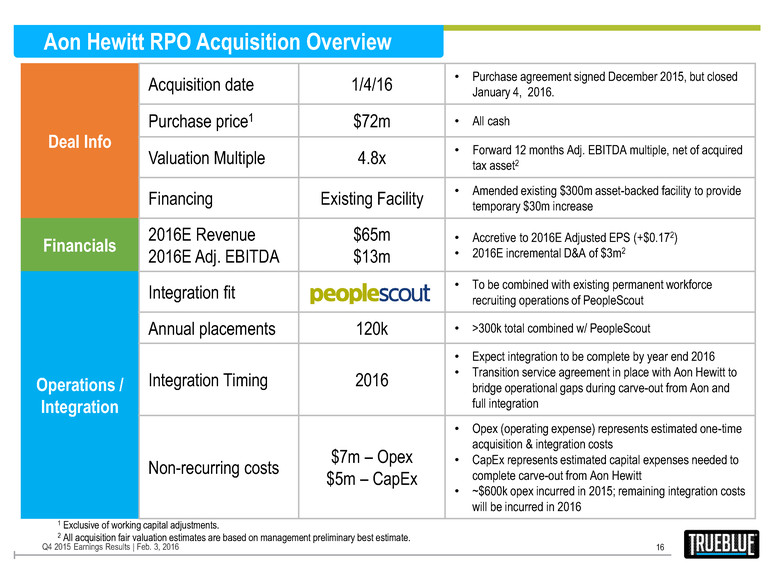
Deal Info Acquisition date 1/4/16 • Purchase agreement signed December 2015, but closed January 4, 2016. Purchase price1 $72m • All cash Valuation Multiple 4.8x • Forward 12 months Adj. EBITDA multiple, net of acquired tax asset2 Financing Existing Facility • Amended existing $300m asset-backed facility to provide temporary $30m increase Financials 2016E Revenue 2016E Adj. EBITDA $65m $13m • Accretive to 2016E Adjusted EPS (+$0.172) • 2016E incremental D&A of $3m2 Operations / Integration Integration fit • To be combined with existing permanent workforce recruiting operations of PeopleScout Annual placements 120k • >300k total combined w/ PeopleScout Integration Timing 2016 • Expect integration to be complete by year end 2016 • Transition service agreement in place with Aon Hewitt to bridge operational gaps during carve-out from Aon and full integration Non-recurring costs $7m – Opex $5m – CapEx • Opex (operating expense) represents estimated one-time acquisition & integration costs • CapEx represents estimated capital expenses needed to complete carve-out from Aon Hewitt • ~$600k opex incurred in 2015; remaining integration costs will be incurred in 2016 Aon Hewitt RPO Acquisition Overview 16 Q4 2015 Earnings Results | Feb. 3, 2016 1 Exclusive of working capital adjustments. 2 All acquisition fair valuation estimates are based on management preliminary best estimate.
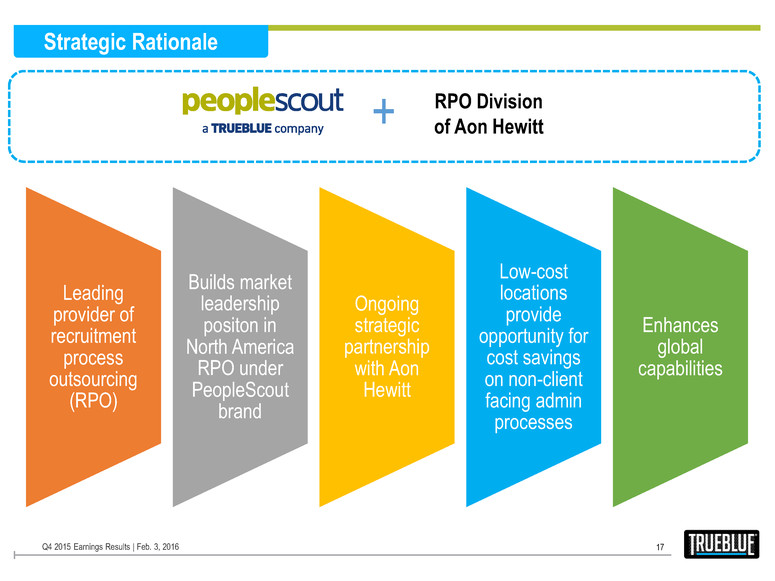
Strategic Rationale 17 Q4 2015 Earnings Results | Feb. 3, 2016 Leading provider of recruitment process outsourcing (RPO) Builds market leadership positon in North America RPO under PeopleScout brand Ongoing strategic partnership with Aon Hewitt Low-cost locations provide opportunity for cost savings on non-client facing admin processes Enhances global capabilities + RPO Division of Aon Hewitt

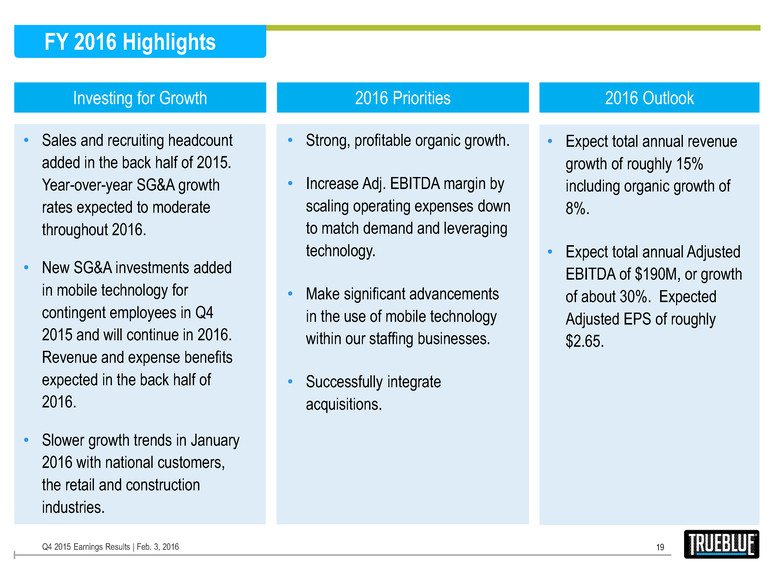
FY 2016 Highlights 19 Q4 2015 Earnings Results | Feb. 3, 2016 Investing for Growth 2016 Priorities 2016 Outlook • Sales and recruiting headcount added in the back half of 2015. Year-over-year SG&A growth rates expected to moderate throughout 2016. • New SG&A investments added in mobile technology for contingent employees in Q4 2015 and will continue in 2016. Revenue and expense benefits expected in the back half of 2016. • Slower growth trends in January 2016 with national customers, the retail and construction industries. • Top priority is strong, profitable organic growth • Make significant advancements in the use of mobile technology within our staffing businesses • Harness the benefit of 2015 investments and 2016 technology investments to drive progressively higher operating leverage throughout 2016. • Successfully integrate acquisitions. • Expect total annual revenue growth of roughly 15% including organic growth of 8%. • Expect total annual Adjusted EBITDA of $190M, or growth of about 30%. Expected Adjusted EPS of roughly $2.65. Strong, prof table organic growth. • Increase Adj. EBITDA margin by scaling operating expenses down to match demand and leveraging technology. • Make significant advancements in the use of mobile technology within our staffing businesses. • Successfully integrate acquisitions.
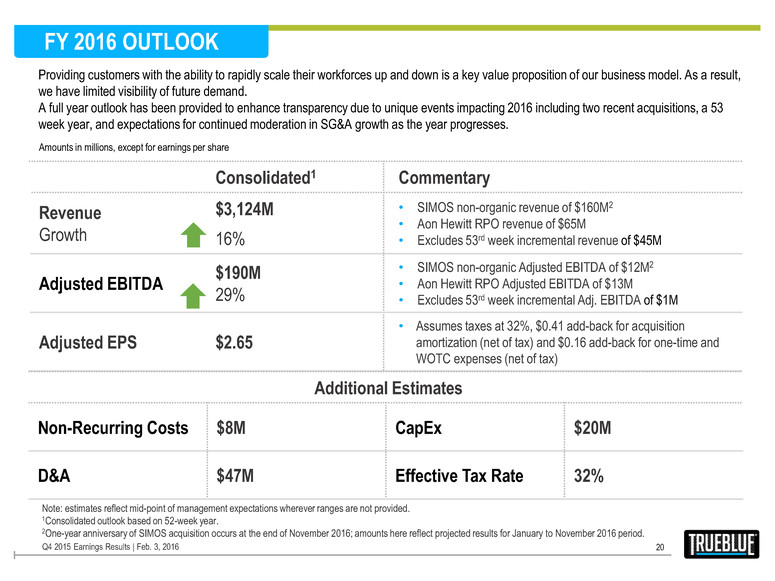
Consolidated1 Commentary Revenue Growth $3,124M 16% • SIMOS non-organic revenue of $160M2 • Aon Hewitt RPO revenue of $65M • Excludes 53rd week incremental revenue of $45M Adjusted EBITDA $190M 29% • SIMOS non-organic Adjusted EBITDA of $12M2 • Aon Hewitt RPO Adjusted EBITDA of $13M • Excludes 53rd week incremental Adj. EBITDA of $1M Adjusted EPS $2.65 • Assumes taxes at 32%, $0.41 add-back for acquisition amortization (net of tax) and $0.16 add-back for one-time and WOTC expenses (net of tax) Amounts in millions, except for earnings per share FY 2016 OUTLOOK 20 Q4 2015 Earnings Results | Feb. 3, 2016 Additional Estimates Non-Recurring Costs $8M CapEx $20M D&A $47M Effective Tax Rate 32% Note: estimates reflect mid-point of management expectations wherever ranges are not provided. 1Consolidated outlook based on 52-week year. 2One-year anniversary of SIMOS acquisition occurs at the end of November 2016; amounts here reflect projected results for January to November 2016 period. Providing customers with the ability to rapidly scale their workforces up and down is a key value proposition of our business model. As a result, we have limited visibility of future demand. A full year outlook has been provided to enhance transparency due to unique events impacting 2016 including two recent acquisitions, a 53 week year, and expectations for continued moderation in SG&A growth as the year progresses.

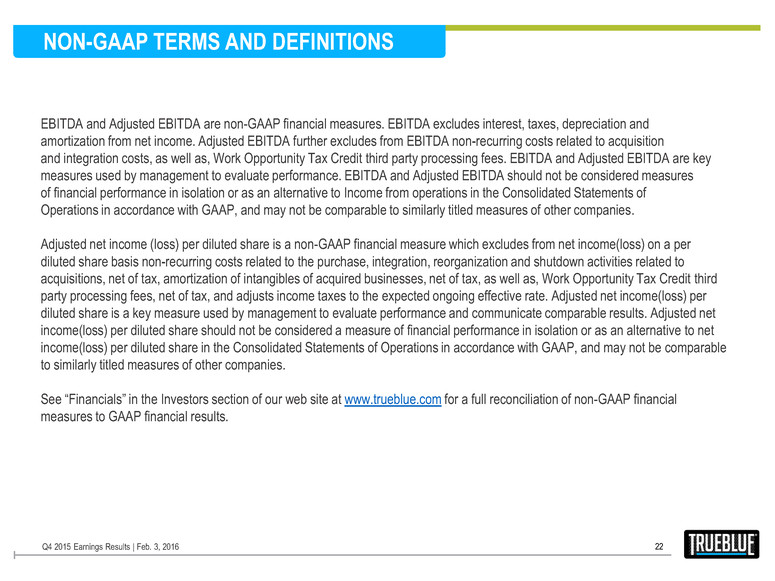
EBITDA and Adjusted EBITDA are non-GAAP financial measures. EBITDA excludes interest, taxes, depreciation and amortization from net income. Adjusted EBITDA further excludes from EBITDA non-recurring costs related to acquisition and integration costs, as well as, Work Opportunity Tax Credit third party processing fees. EBITDA and Adjusted EBITDA are key measures used by management to evaluate performance. EBITDA and Adjusted EBITDA should not be considered measures of financial performance in isolation or as an alternative to Income from operations in the Consolidated Statements of Operations in accordance with GAAP, and may not be comparable to similarly titled measures of other companies. Adjusted net income (loss) per diluted share is a non-GAAP financial measure which excludes from net income(loss) on a per diluted share basis non-recurring costs related to the purchase, integration, reorganization and shutdown activities related to acquisitions, net of tax, amortization of intangibles of acquired businesses, net of tax, as well as, Work Opportunity Tax Credit third party processing fees, net of tax, and adjusts income taxes to the expected ongoing effective rate. Adjusted net income(loss) per diluted share is a key measure used by management to evaluate performance and communicate comparable results. Adjusted net income(loss) per diluted share should not be considered a measure of financial performance in isolation or as an alternative to net income(loss) per diluted share in the Consolidated Statements of Operations in accordance with GAAP, and may not be comparable to similarly titled measures of other companies. See “Financials” in the Investors section of our web site at www.trueblue.com for a full reconciliation of non-GAAP financial measures to GAAP financial results. NON-GAAP TERMS AND DEFINITIONS 22 Q4 2015 Earnings Results | Feb. 3, 2016