
2 Certain statements made by us in this presentation that are not historical facts or that relate to future plans, events or performances are forward-looking statements that reflect management’s current outlook for future periods, including statements regarding future financial performance. These forward-looking statements are based upon our current expectations, and our actual results may differ materially from those described or contemplated in the forward–looking statements. Factors that may cause our actual results to differ materially from those contained in the forward-looking statements, include without limitation the following: 1) national and global economic conditions, including the impact of changes in national and global credit markets and other changes that affect our customers; 2) our ability to continue to attract and retain customers and maintain profit margins in the face of new and existing competition; 3) new laws and regulations that could have a materially adverse effect on our operations and financial results; 4) increased costs and collateral requirements in connection with our insurance obligations, including workers’ compensation insurance; 5) our continuing ability to comply with the financial covenants of our credit agreement; 6) our ability to attract and retain qualified employees in key positions or to find temporary and permanent employees with the right skills to fulfill the needs of our customers; 7) our ability to successfully complete and integrate acquisitions that we may make; and 8) other risks described in our most recent filings with the Securities and Exchange Commission. Use of estimates and forecasts: Any references made to fiscal 2015 are based on management guidance issued October 21, 2015, and are included for informational purposes only and are not an update or reaffirmation. We assume no obligation to update or revise any forward-looking statement, whether as a result of new information, future events, or otherwise, except as required by law. Any other reference to future financial estimates are included for informational purposes only and subject to risk factors discussed in our most recent filings with the Securities Exchange Commission. October 2015 Investor Presentation
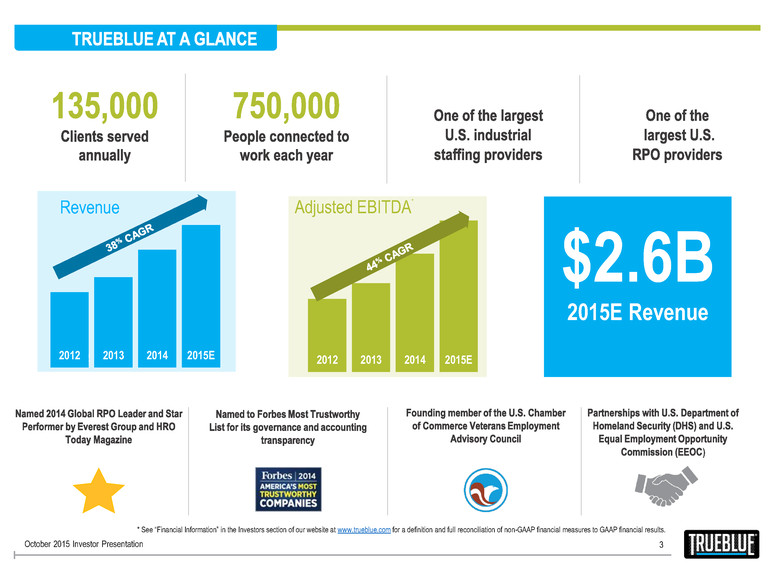
) $2.6B 2015E Revenue 3 * See “Financial Information” in the Investors section of our website at www.trueblue.com for a definition and full reconciliation of non-GAAP financial measures to GAAP financial results. 2012 2013 2014 Revenue Adjusted EBITDA * October 2015 Investor Presentation 2012 2013 2014 2015E 2012 2013 2014 2015E
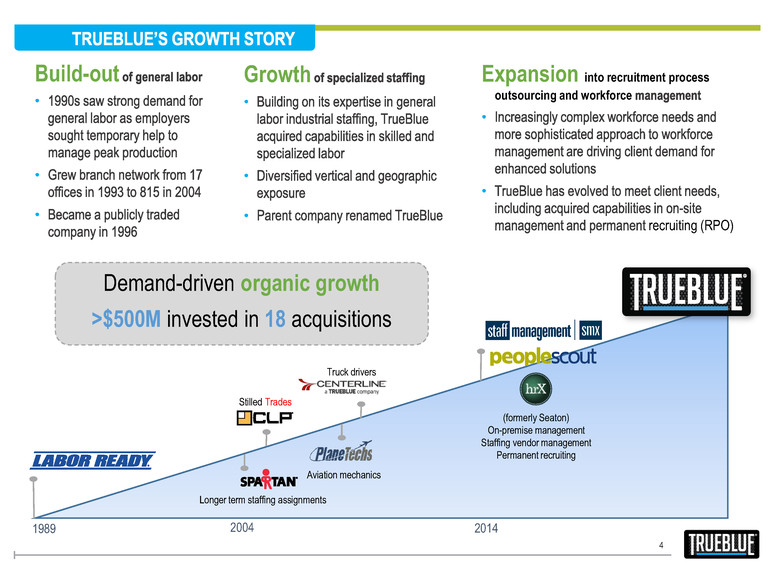
Demand-driven organic growth >$500M invested in 18 acquisitions 4 1989 Build-out • • • 2004 Growth • • • Expansion into recruitment process outsourcing and workforce • • recruiting (RPO) 2014 Longer term staffing assignments Stilled Trades Aviation mechanics Truck drivers (formerly Seaton) On-premise management Staffing vendor management Permanent recruiting
1 Source: Staffing Industry Analysts 2014 revenue; Pro forma for acquisition of Seaton. October 2015 Investor Presentation 5
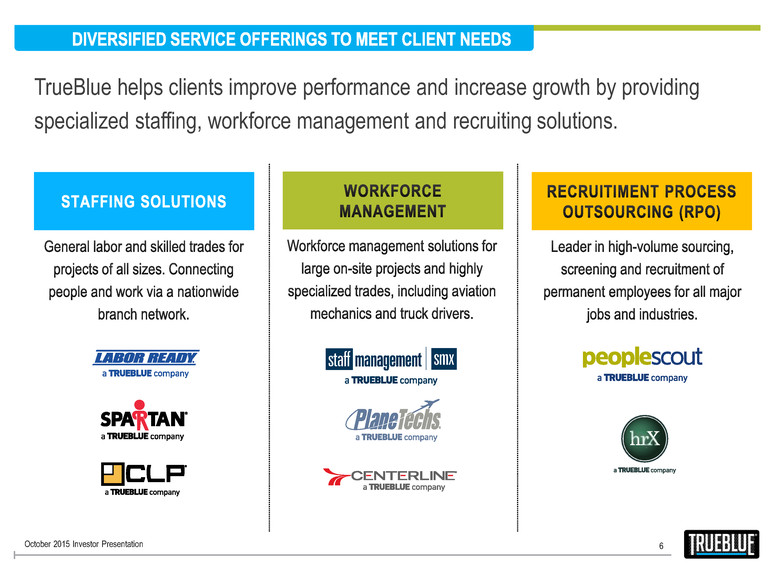
6 TrueBlue helps clients improve performance and increase growth by providing specialized staffing, workforce management and recruiting solutions. October 2015 Investor Presentation
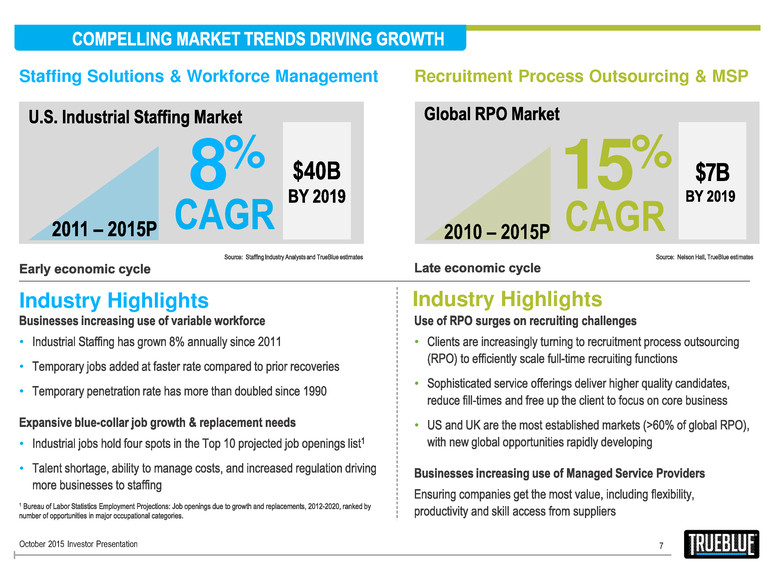
• • • • • • • • 7 Staffing Solutions & Workforce Management Recruitment Process Outsourcing & MSP Industry Highlights CAGR 15% 2010 – 2015P Industry Highlights 8% October 2015 Investor Presentation
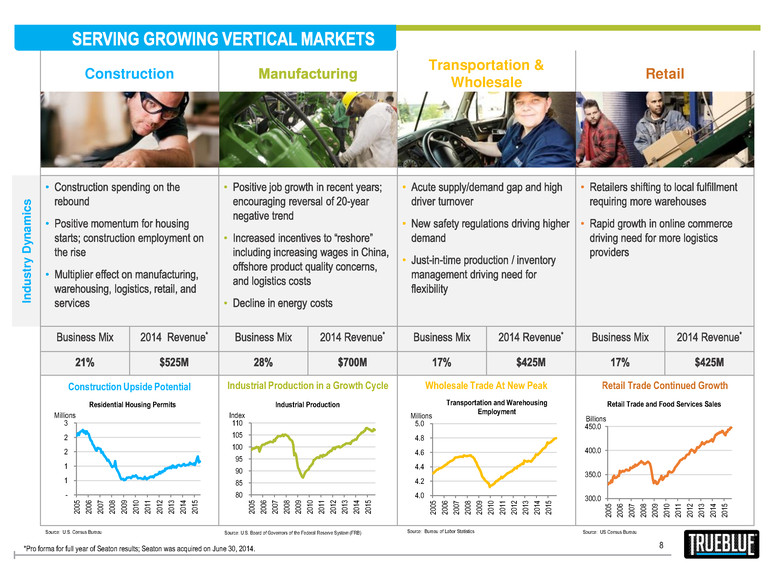
Construction Transportation & Wholesale Retail In d u s tr y D y n a m ic s • • • • • • • • • • • Construction Upside Potential Industrial Production in a Growth Cycle Wholesale Trade At New Peak Retail Trade Continued Growth Source: U.S. Census Bureau Source: U.S. Board of Governors of the Federal Reserve System (FRB) Source: Bureau of Labor Statistics Source: US Census Bureau *Pro forma for full year of Seaton results; Seaton was acquired on June 30, 2014. 300.0 350.0 400.0 450.0 20 05 20 06 20 07 20 08 20 09 20 10 20 11 20 12 20 13 20 14 20 15 Retail Trade and Food Services Sales Billions 4.0 4.2 4.4 4.6 4.8 5.0 20 05 20 06 20 07 20 08 20 09 20 10 20 11 20 12 20 13 20 14 20 15 Transportation and Warehousing Employment Millions 80 85 90 95 100 105 110 20 05 20 06 20 07 20 08 20 09 20 10 20 11 20 12 20 13 20 14 20 15 Industrial Production Index 8 - 1 1 2 2 3 20 05 20 06 20 07 20 08 20 09 20 10 20 11 20 12 20 13 20 14 20 15 Residential Housing Permits Millions
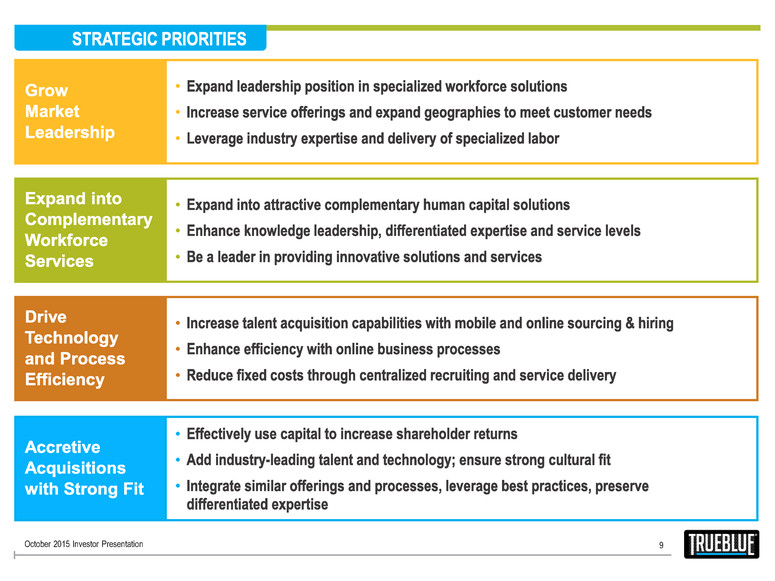
9 • • • • • • • • • • • • October 2015 Investor Presentation