Q1 2015 Investor Presentation
Q1 2015 Investor Presentation 2 Certain statements made by us in this presentation that are not historical facts or that relate to future plans, events or performances are forward-looking statements that reflect management’s current outlook for future periods, including statements regarding future financial performance. These forward-looking statements are based upon our current expectations, and our actual results may differ materially from those described or contemplated in the forward–looking statements. Factors that may cause our actual results to differ materially from those contained in the forward-looking statements, include without limitation the following: 1) national and global economic conditions, including the impact of changes in national and global credit markets and other changes that affect our customers; 2) our ability to continue to attract and retain customers and maintain profit margins in the face of new and existing competition; 3) new laws and regulations that could have a materially adverse effect on our operations and financial results; 4) significant labor disturbances which could disrupt industries we serve; 5) increased costs and collateral requirements in connection with our insurance obligations, including workers’ compensation insurance; 6) the adequacy of our financial reserves; 7) our continuing ability to comply with the financial covenants of our lines of credit and other financing agreements; 8) our ability to attract and retain competent employees in key positions or to find temporary and permanent employees to fulfill the needs of our customers; 9) our ability to successfully complete and integrate acquisitions that we may make; and 10) other risks described in our most recent filings with the Securities and Exchange Commission. Use of estimates and forecasts: Any references made to 2015 are based on management guidance issued Feb. 5, 2015, and are included for informational purposes only and are not an update or reaffirmation. We assume no obligation to update or revise any forward-looking statement, whether as a result of new information, future events, or otherwise, except as required by law. Any other reference to future financial estimates are included for informational purposes only and subject to risk factors discussed in our most recent filings with the Securities Exchange Commission.
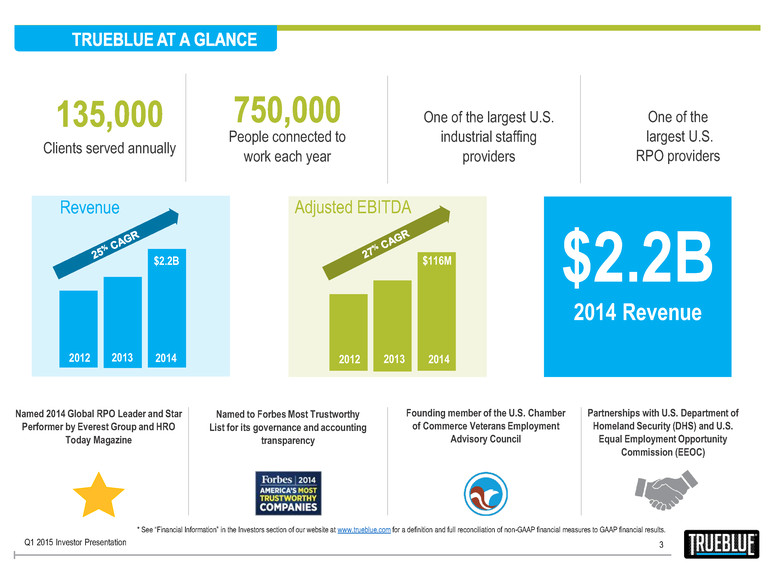
Named 2014 Global RPO Leader and Star Performer by Everest Group and HRO Today Magazine Named to Forbes Most Trustworthy List for its governance and accounting transparency Founding member of the U.S. Chamber of Commerce Veterans Employment Advisory Council Partnerships with U.S. Department of Homeland Security (DHS) and U.S. Equal Employment Opportunity Commission (EEOC) $2.2B 2014 Revenue Clients served annually People connected to work each year One of the largest U.S. industrial staffing providers 3 One of the largest U.S. RPO providers Q1 2015 Investor Presentation * See “Financial Information” in the Investors section of our website at www.trueblue.com for a definition and full reconciliation of non-GAAP financial measures to GAAP financial results. 2012 2013 2014 Revenue 2012 2013 2014 Adjusted EBITDA $2.2B $116M
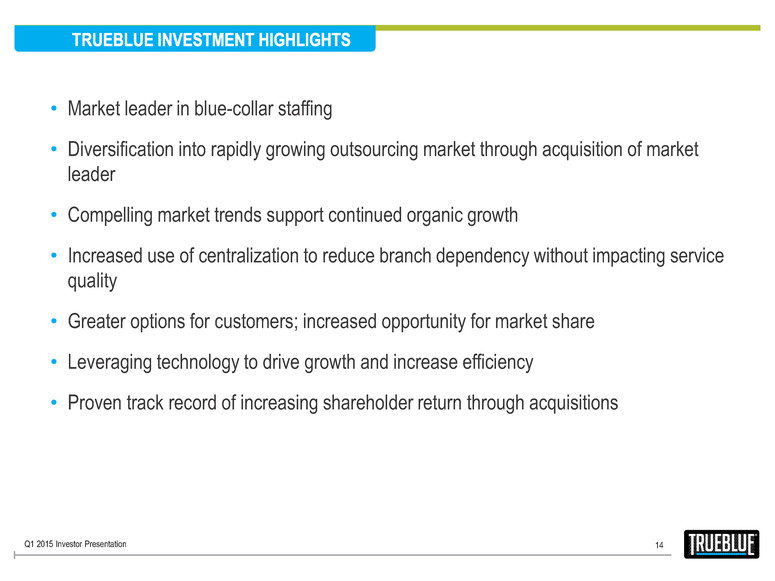
4 • Market leader in blue-collar staffing • Diversification into rapidly growing outsourcing market through acquisition of market leader • Compelling market trends support continued organic growth • Increased use of centralization to reduce branch dependency without impacting service quality • Greater options for customers; increased opportunity for market share • Leveraging technology to drive growth and increase efficiency • Proven track record of increasing shareholder return through acquisitions Q1 2015 Investor Presentation
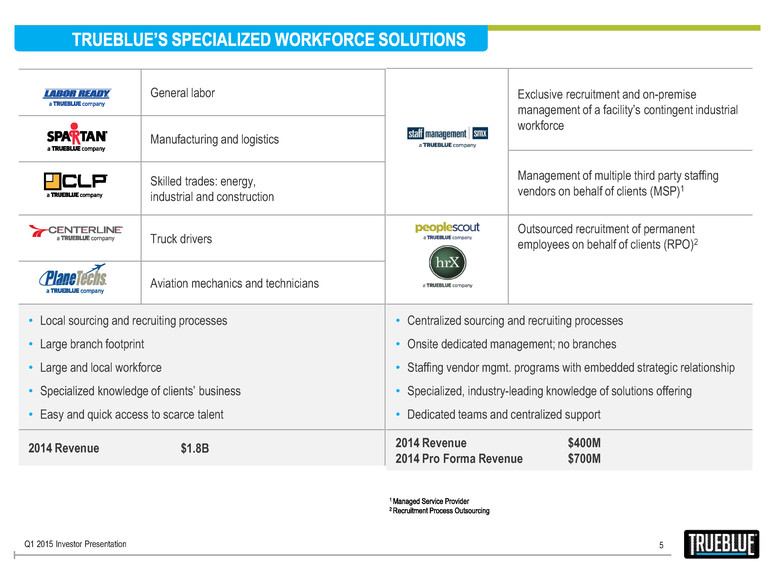
Exclusive recruitment and on-premise management of a facility’s contingent industrial workforce Management of multiple third party staffing vendors on behalf of clients (MSP)1 Outsourced recruitment of permanent employees on behalf of clients (RPO)2 • Centralized sourcing and recruiting processes • Onsite dedicated management; no branches • Staffing vendor mgmt. programs with embedded strategic relationship • Specialized, industry-leading knowledge of solutions offering • Dedicated teams and centralized support 2014 Revenue 2014 Pro Forma Revenue $400M $700M 5 General labor Manufacturing and logistics Skilled trades: energy, industrial and construction Truck drivers Aviation mechanics and technicians • Local sourcing and recruiting processes • Large branch footprint • Large and local workforce • Specialized knowledge of clients’ business • Easy and quick access to scarce talent 2014 Revenue $1.8B Q1 2015 Investor Presentation
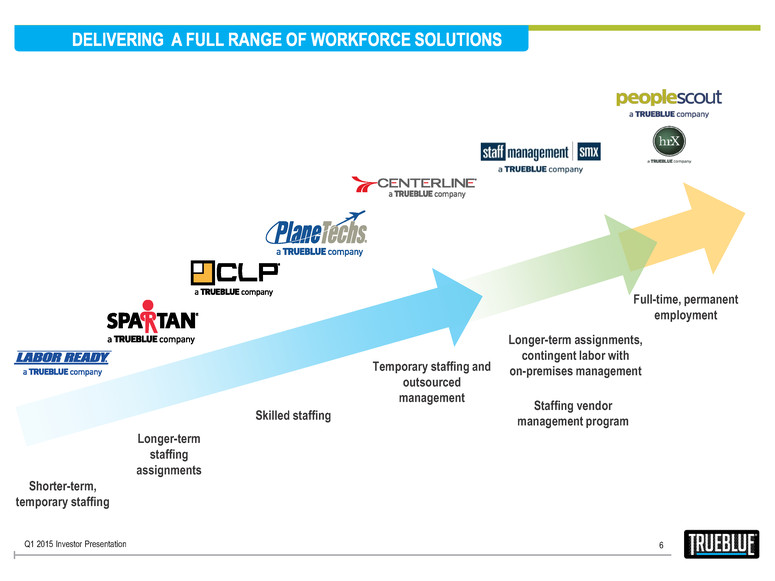
6 Skilled staffing Longer-term staffing assignments Staffing vendor management program Full-time, permanent employment Shorter-term, temporary staffing Longer-term assignments, contingent labor with on-premises management Temporary staffing and outsourced management Q1 2015 Investor Presentation
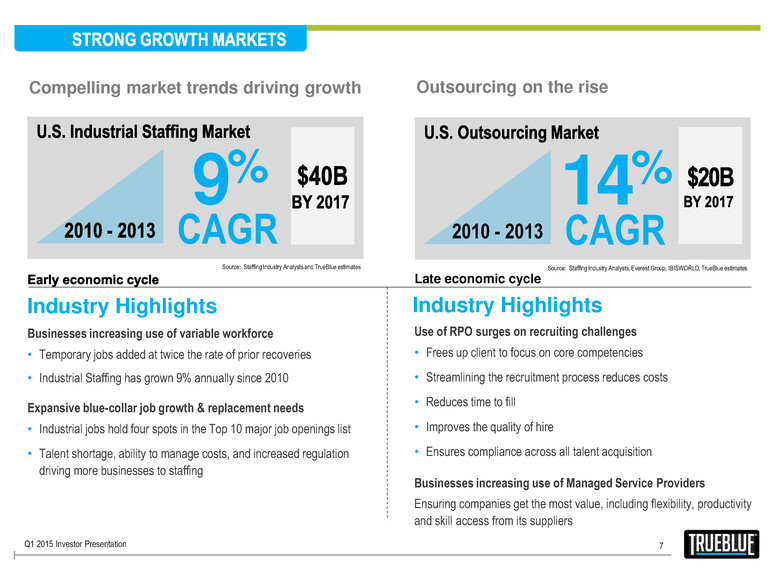
Use of RPO surges on recruiting challenges • Frees up client to focus on core competencies • Streamlining the recruitment process reduces costs • Reduces time to fill • Improves the quality of hire • Ensures compliance across all talent acquisition Businesses increasing use of Managed Service Providers Ensuring companies get the most value, including flexibility, productivity and skill access from its suppliers Businesses increasing use of variable workforce • Temporary jobs added at twice the rate of prior recoveries • Industrial Staffing has grown 9% annually since 2010 Expansive blue-collar job growth & replacement needs • Industrial jobs hold four spots in the Top 10 major job openings list • Talent shortage, ability to manage costs, and increased regulation driving more businesses to staffing Late economic cycle 7 Compelling market trends driving growth Outsourcing on the rise Industry Highlights CAGR 14% CAGR 9% 2010 - 2013 Industry Highlights Source: Staffing Industry Analysts, Everest Group, IBISWORLD, TrueBlue estimates Source: Staffing Industry Analysts and TrueBlue estimates Q1 2015 Investor Presentation
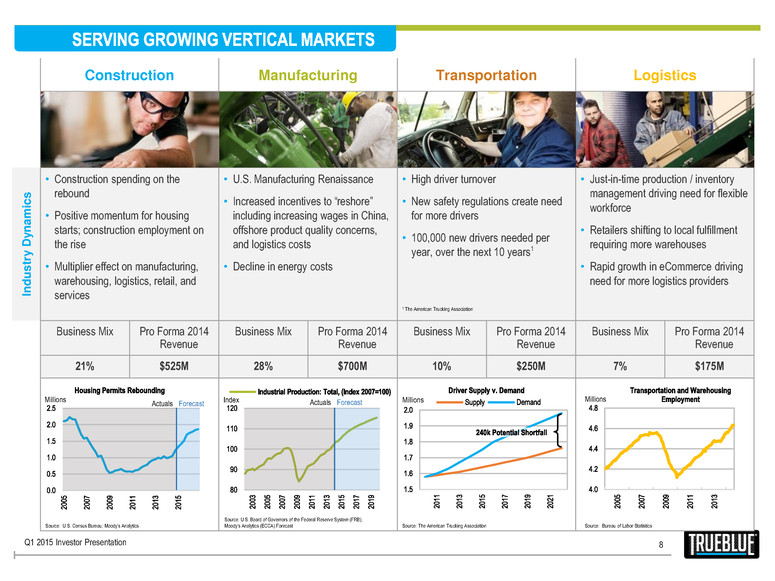
Construction Manufacturing Transportation Logistics In d u s tr y D y n a m ic s • Construction spending on the rebound • Positive momentum for housing starts; construction employment on the rise • Multiplier effect on manufacturing, warehousing, logistics, retail, and services • U.S. Manufacturing Renaissance • Increased incentives to “reshore” including increasing wages in China, offshore product quality concerns, and logistics costs • Decline in energy costs • High driver turnover • New safety regulations create need for more drivers • 100,000 new drivers needed per year, over the next 10 years1 • Just-in-time production / inventory management driving need for flexible workforce • Retailers shifting to local fulfillment requiring more warehouses • Rapid growth in eCommerce driving need for more logistics providers Business Mix Pro Forma 2014 Revenue Business Mix Pro Forma 2014 Revenue Business Mix Pro Forma 2014 Revenue Business Mix Pro Forma 2014 Revenue 21% $525M 28% $700M 10% $250M 7% $175M Residential Construction on the Rise Industrial Production in a Growth Cycle Driver Shortage Logistics At New Peak 8 Source: U.S. Census Bureau; Moody's Analytics Source: The American Trucking Association Source: U.S. Board of Governors of the Federal Reserve System (FRB); Moody's Analytics (ECCA) Forecast Actuals Forecast Millions Millions Actuals Forecast Index Millions Source: Bureau of Labor Statistics 1 The American Trucking Association Q1 2015 Investor Presentation
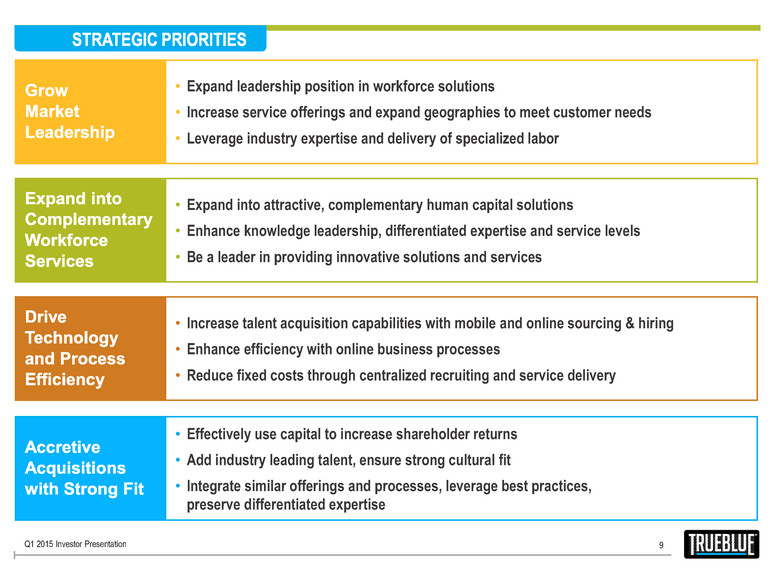
9 • Effectively use capital to increase shareholder returns • Add industry leading talent, ensure strong cultural fit • Integrate similar offerings and processes, leverage best practices, preserve differentiated expertise • Expand leadership position in workforce solutions • Increase service offerings and expand geographies to meet customer needs • Leverage industry expertise and delivery of specialized labor • Expand into attractive, complementary human capital solutions • Enhance knowledge leadership, differentiated expertise and service levels • Be a leader in providing innovative solutions and services • Increase talent acquisition capabilities with mobile and online sourcing & hiring • Enhance efficiency with online business processes • Reduce fixed costs through centralized recruiting and service delivery Q1 2015 Investor Presentation
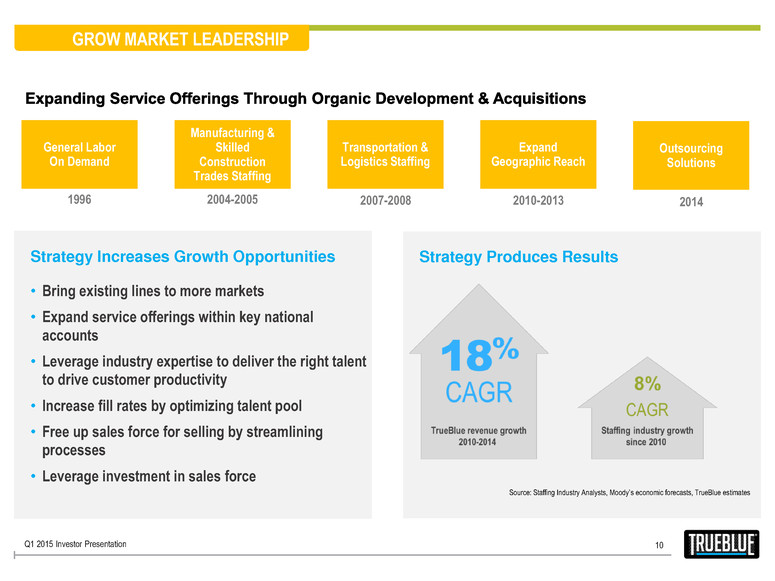
10 GROW MARKET LEADERSHIP Strategy Produces Results Strategy Increases Growth Opportunities • Bring existing lines to more markets • Expand service offerings within key national accounts • Leverage industry expertise to deliver the right talent to drive customer productivity • Increase fill rates by optimizing talent pool • Free up sales force for selling by streamlining processes • Leverage investment in sales force 1996 General Labor On Demand 2004-2005 Manufacturing & Skilled Construction Trades Staffing 2007-2008 Transportation & Logistics Staffing 2010-2013 Expand Geographic Reach Source: Staffing Industry Analysts, Moody’s economic forecasts, TrueBlue estimates 2014 Outsourcing Solutions Q1 2015 Investor Presentation
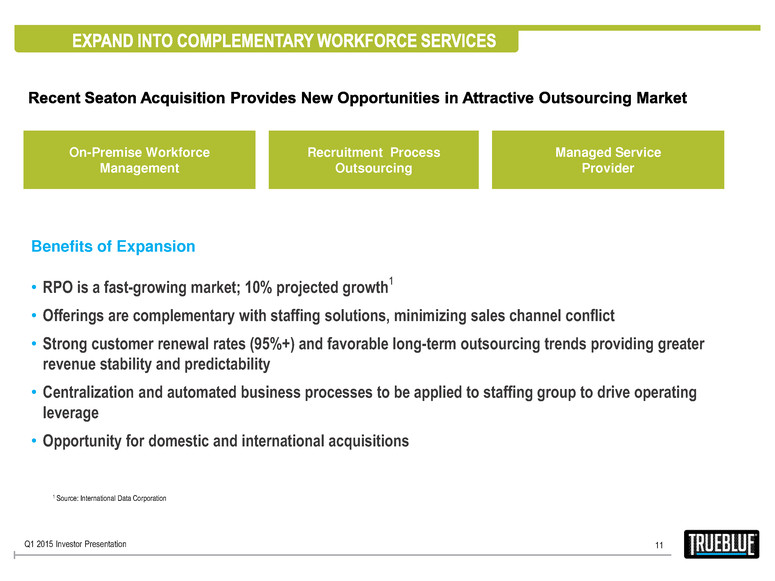
11 • RPO is a fast-growing market; 10% projected growth 1 • Offerings are complementary with staffing solutions, minimizing sales channel conflict • Strong customer renewal rates (95%+) and favorable long-term outsourcing trends providing greater revenue stability and predictability • Centralization and automated business processes to be applied to staffing group to drive operating leverage • Opportunity for domestic and international acquisitions Benefits of Expansion On-Premise Workforce Management Recruitment Process Outsourcing Managed Service Provider 1 Source: International Data Corporation Q1 2015 Investor Presentation
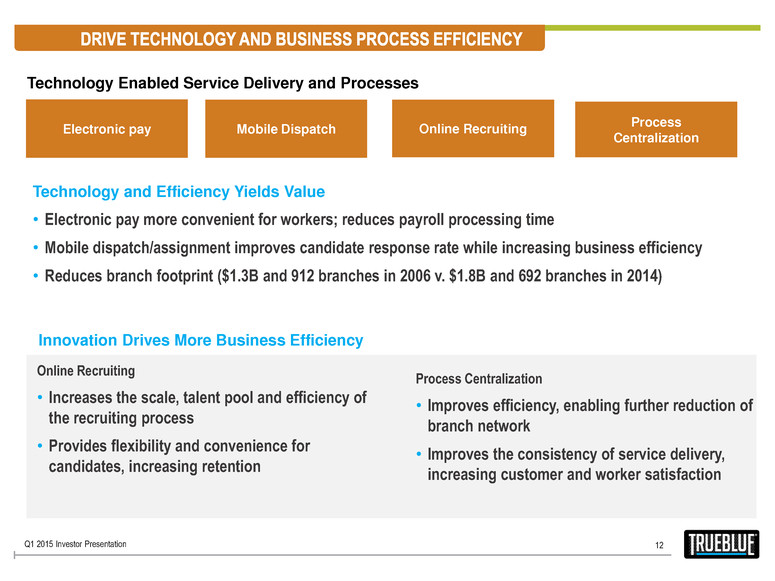
12 Technology Enabled Service Delivery and Processes Technology and Efficiency Yields Value • Electronic pay more convenient for workers; reduces payroll processing time • Mobile dispatch/assignment improves candidate response rate while increasing business efficiency • Reduces branch footprint ($1.3B and 912 branches in 2006 v. $1.8B and 692 branches in 2014) Electronic pay Mobile Dispatch Online Recruiting Process Centralization Innovation Drives More Business Efficiency Online Recruiting • Increases the scale, talent pool and efficiency of the recruiting process • Provides flexibility and convenience for candidates, increasing retention Process Centralization • Improves efficiency, enabling further reduction of branch network • Improves the consistency of service delivery, increasing customer and worker satisfaction Q1 2015 Investor Presentation
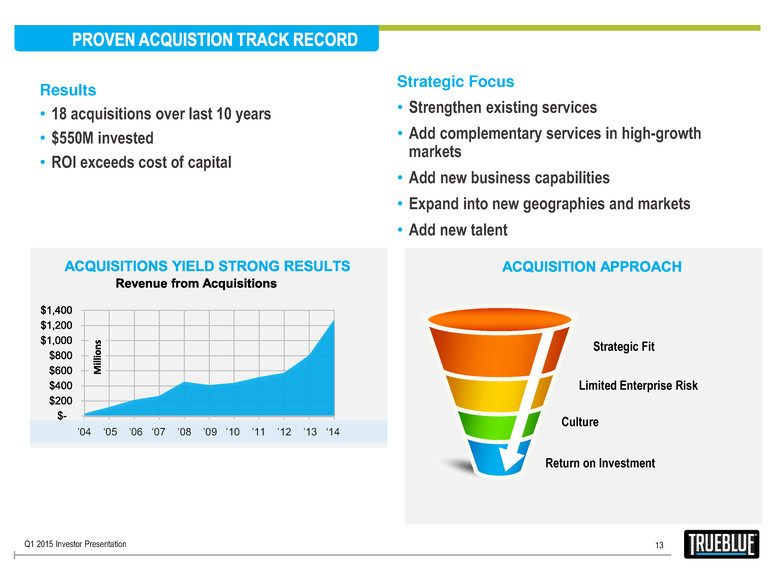
13 Strategic Focus • Strengthen existing services • Add complementary services in high-growth markets • Add new business capabilities • Expand into new geographies and markets • Add new talent Results • 18 acquisitions over last 10 years • $550M invested • ROI exceeds cost of capital Strategic Fit Limited Enterprise Risk Culture Return on Investment ’04 ‘05 ’06 ‘07 ’08 ’09 ’10 ’11 ’12 ’13 ‘14 Q1 2015 Investor Presentation
14 • Market leader in blue-collar staffing • Diversification into rapidly growing outsourcing market through acquisition of market leader • Compelling market trends support continued organic growth • Increased use of centralization to reduce branch dependency without impacting service quality • Greater options for customers; increased opportunity for market share • Leveraging technology to drive growth and increase efficiency • Proven track record of increasing shareholder return through acquisitions Q1 2015 Investor Presentation