Q2 2014 Earnings Results | July 24, 2014 | page 2 FORWARD-LOOKING STATEMENT Certain statements made by us in this presentation that are not historical facts or that relate to future plans, events or performances are forward-looking statements that reflect management’s current outlook for future periods, including statements regarding future financial performance. These forward-looking statements are based upon our current expectations, and our actual results may differ materially from those described or contemplated in the forward–looking statements. Factors that may cause our actual results to differ materially from those contained in the forward-looking statements, include without limitation the following: 1) national and global economic conditions, including the impact of changes in national and global credit markets and other changes that affect our customers; 2) our ability to continue to attract and retain customers and maintain profit margins in the face of new and existing competition; 3) new laws and regulations that could have a materially adverse effect on our operations and financial results; 4) significant labor disturbances which could disrupt industries we serve; 5) increased costs and collateral requirements in connection with our insurance obligations, including workers’ compensation insurance; 6) the adequacy of our financial reserves; 7) our continuing ability to comply with the financial covenants of our lines of credit and other financing agreements; 8) our ability to attract and retain competent employees in key positions or to find temporary employees to fulfill the needs of our customers; 9) our ability to successfully complete and integrate acquisitions that we may make; and 10) other risks described in our most recent filings with the Securities and Exchange Commission. Use of estimates and forecasts: Any references made to 2014 and 2015 are based on management guidance issued July 24, 2014, and are included for informational purposes only and are not an update or reaffirmation. We assume no obligation to update or revise any forward-looking statement, whether as a result of new information, future events, or otherwise, except as required by law. Any other reference to future financial estimates are included for informational purposes only and subject to risk factors discussed in our most recent filings with the Securities Exchange Commission.
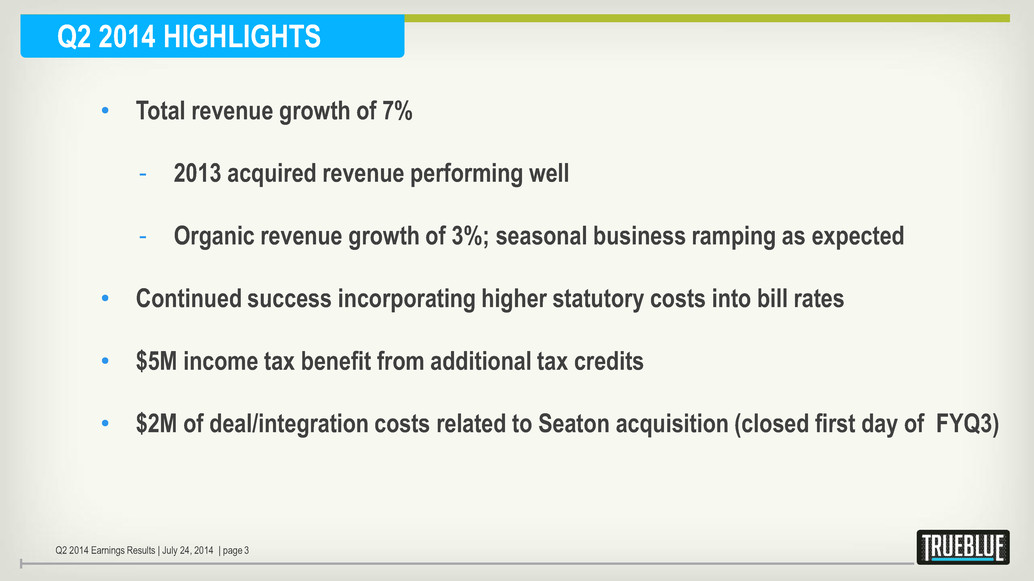
Q2 2014 HIGHLIGHTS • Total revenue growth of 7% - 2013 acquired revenue performing well - Organic revenue growth of 3%; seasonal business ramping as expected • Continued success incorporating higher statutory costs into bill rates • $5M income tax benefit from additional tax credits • $2M of deal/integration costs related to Seaton acquisition (closed first day of FYQ3) Q2 2014 Earnings Results | July 24, 2014 | page 3
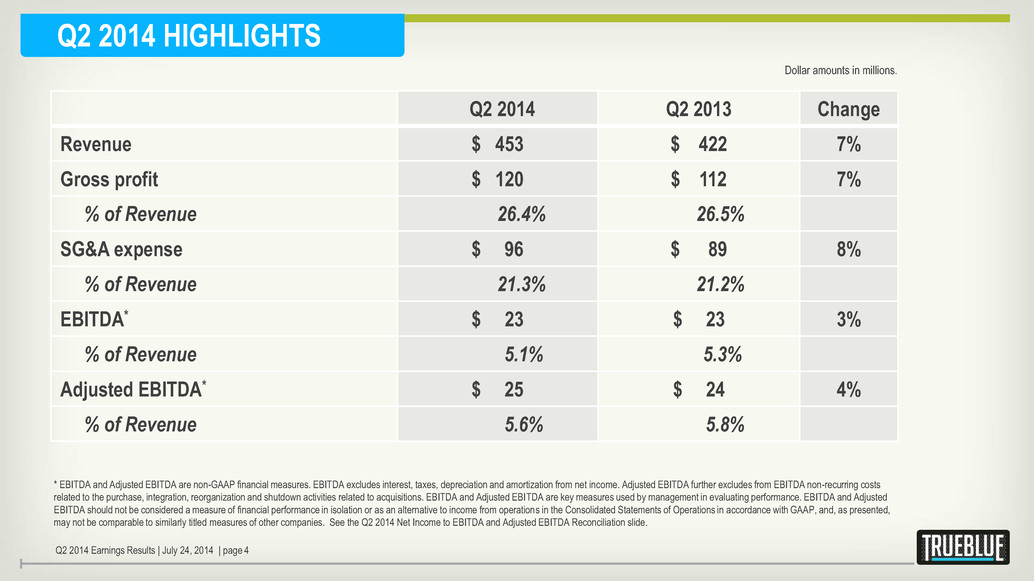
Q2 2014 HIGHLIGHTS Dollar amounts in millions. Q2 2014 Q2 2013 Change Revenue $ 453 $ 422 7% Gross profit $ 120 $ 112 7% % of Revenue 26.4% 26.5% SG&A expense $ 96 $ 89 8% % of Revenue 21.3% 21.2% EBITDA* $ 23 $ 23 3% % of Revenue 5.1% 5.3% Adjusted EBITDA* $ 25 $ 24 4% % of Revenue 5.6% 5.8% * EBITDA and Adjusted EBITDA are non-GAAP financial measures. EBITDA excludes interest, taxes, depreciation and amortization from net income. Adjusted EBITDA further excludes from EBITDA non-recurring costs related to the purchase, integration, reorganization and shutdown activities related to acquisitions. EBITDA and Adjusted EBITDA are key measures used by management in evaluating performance. EBITDA and Adjusted EBITDA should not be considered a measure of financial performance in isolation or as an alternative to income from operations in the Consolidated Statements of Operations in accordance with GAAP, and, as presented, may not be comparable to similarly titled measures of other companies. See the Q2 2014 Net Income to EBITDA and Adjusted EBITDA Reconciliation slide. Q2 2014 Earnings Results | July 24, 2014 | page 4
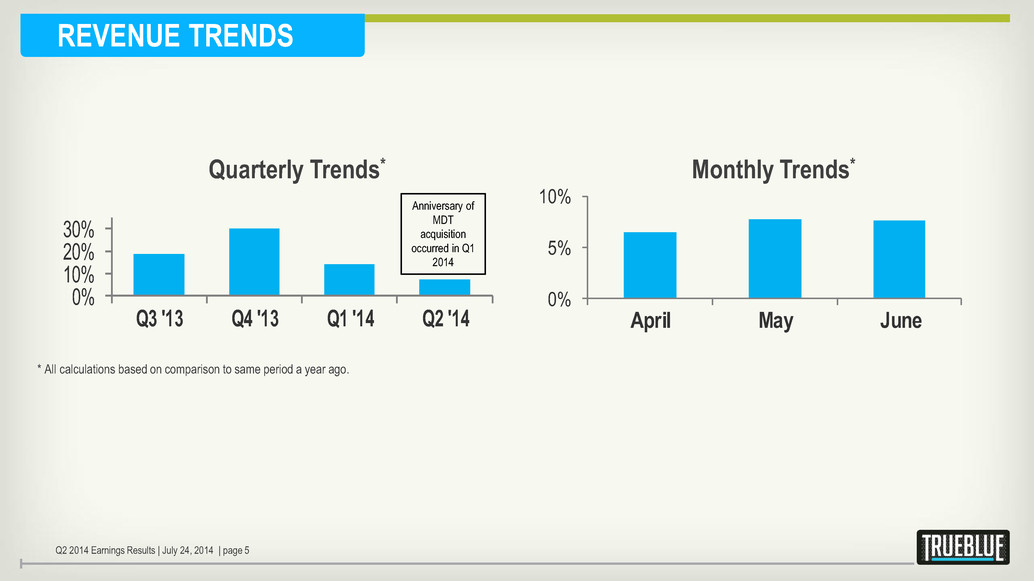
REVENUE TRENDS 0% 10% 20% 30% Q3 '13 Q4 '13 Q1 '14 Q2 '14 0% 5% 10% April May June * All calculations based on comparison to same period a year ago. Monthly Trends* Quarterly Trends* Q2 2014 Earnings Results | July 24, 2014 | page 5 Anniversary of MDT acquisition occurred in Q1 2014
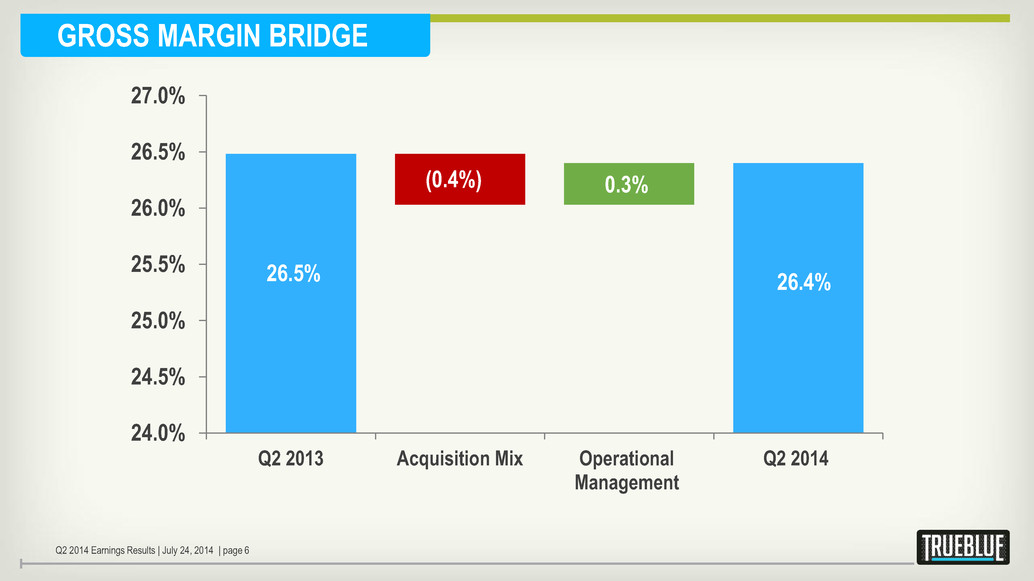
GROSS MARGIN BRIDGE 24.0% 24.5% 25.0% 25.5% 26.0% 26.5% 27.0% Q2 2013 Acquisition Mix Operational Management Q2 2014 26.4% (0.4%) 0.3% 26.5% Q2 2014 Earnings Results | July 24, 2014 | page 6
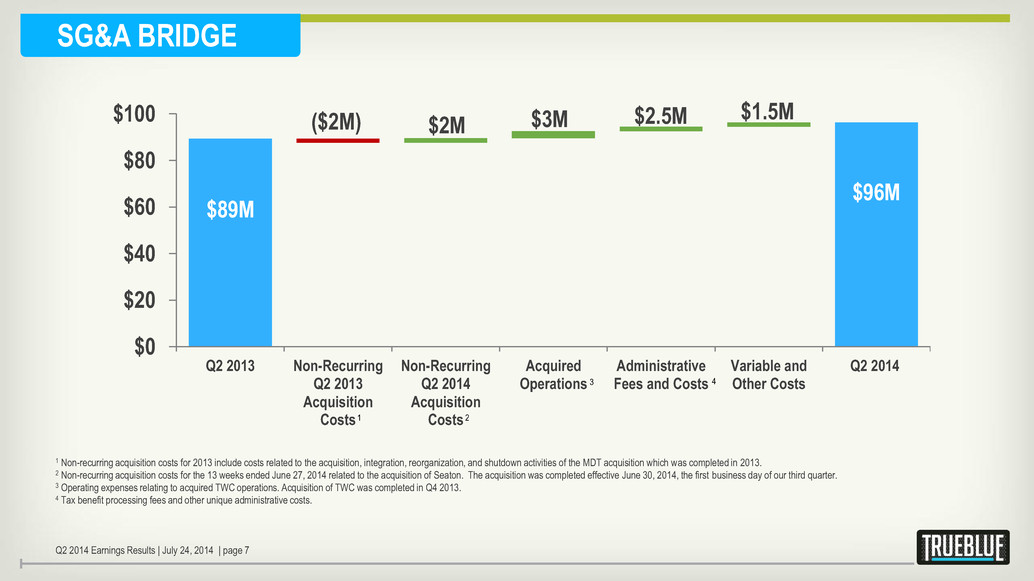
SG&A BRIDGE 1 Non-recurring acquisition costs for 2013 include costs related to the acquisition, integration, reorganization, and shutdown activities of the MDT acquisition which was completed in 2013. 2 Non-recurring acquisition costs for the 13 weeks ended June 27, 2014 related to the acquisition of Seaton. The acquisition was completed effective June 30, 2014, the first business day of our third quarter. 3 Operating expenses relating to acquired TWC operations. Acquisition of TWC was completed in Q4 2013. 4 Tax benefit processing fees and other unique administrative costs. $0 $20 $40 $60 $80 $100 Q2 2013 Non-Recurring Q2 2013 Acquisition Costs Non-Recurring Q2 2014 Acquisition Costs Acquired Operations Administrative Fees and Costs Variable and Other Costs Q2 2014 $89M $96M ($2M) $1.5M $2M $3M $2.5M Q2 2014 Earnings Results | July 24, 2014 | page 7 1 2 3 4
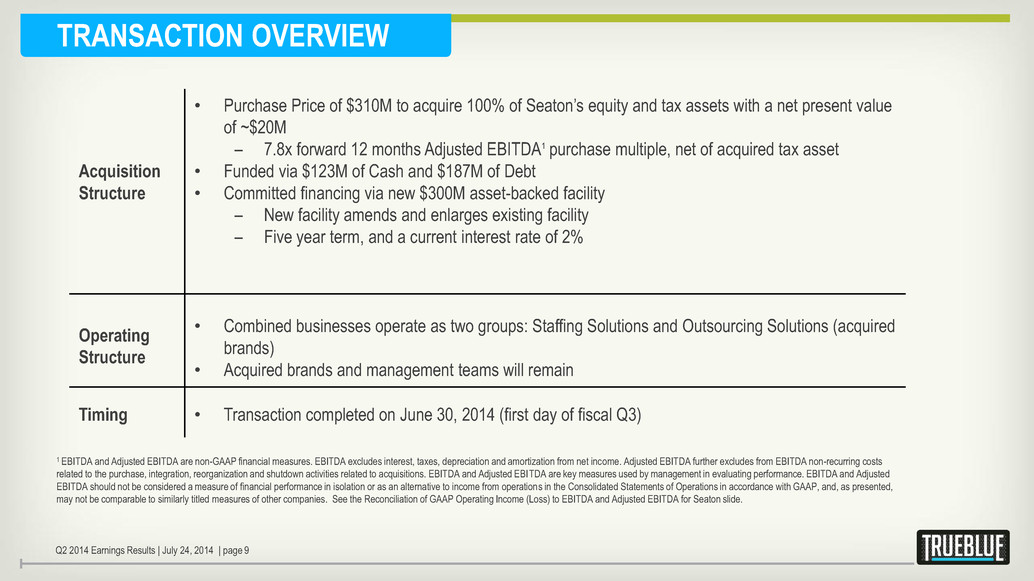
Q2 2014 Earnings Results | July 24, 2014 | page 9 Acquisition Structure • Purchase Price of $310M to acquire 100% of Seaton’s equity and tax assets with a net present value of ~$20M – 7.8x forward 12 months Adjusted EBITDA1 purchase multiple, net of acquired tax asset • Funded via $123M of Cash and $187M of Debt • Committed financing via new $300M asset-backed facility – New facility amends and enlarges existing facility – Five year term, and a current interest rate of 2% Operating Structure • Combined businesses operate as two groups: Staffing Solutions and Outsourcing Solutions (acquired brands) • Acquired brands and management teams will remain Timing • Transaction completed on June 30, 2014 (first day of fiscal Q3) TRANSACTION OVERVIEW 1 EBITDA and Adjusted EBITDA are non-GAAP financial measures. EBITDA excludes interest, taxes, depreciation and amortization from net income. Adjusted EBITDA further excludes from EBITDA non-recurring costs related to the purchase, integration, reorganization and shutdown activities related to acquisitions. EBITDA and Adjusted EBITDA are key measures used by management in evaluating performance. EBITDA and Adjusted EBITDA should not be considered a measure of financial performance in isolation or as an alternative to income from operations in the Consolidated Statements of Operations in accordance with GAAP, and, as presented, may not be comparable to similarly titled measures of other companies. See the Reconciliation of GAAP Operating Income (Loss) to EBITDA and Adjusted EBITDA for Seaton slide.
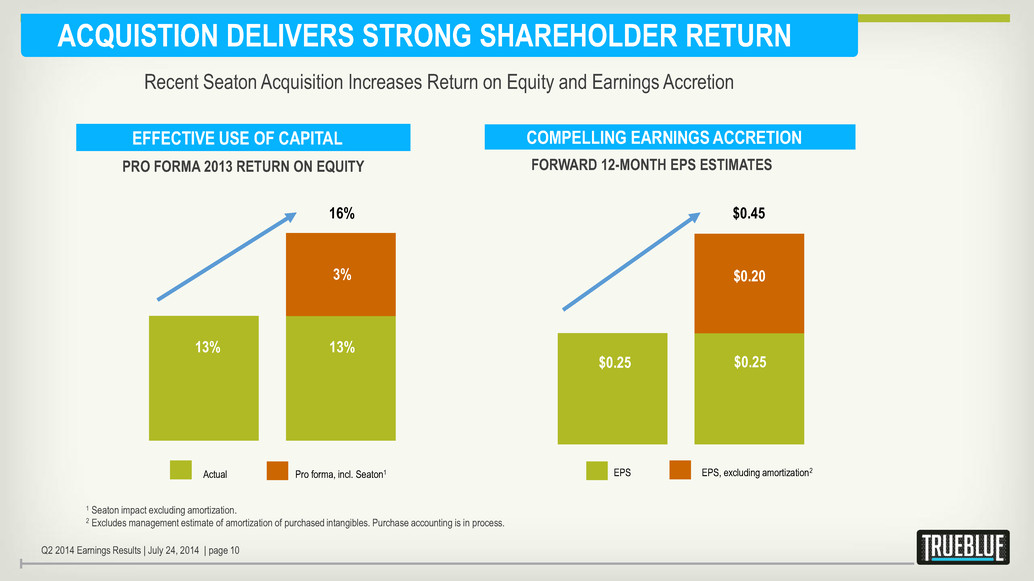
ACQUISTION DELIVERS STRONG SHAREHOLDER RETURN Q2 2014 Earnings Results | July 24, 2014 | page 10 1 Seaton impact excluding amortization. 2 Excludes management estimate of amortization of purchased intangibles. Purchase accounting is in process. Actual Pro forma, incl. Seaton1 13% 13% 16% $0.25 COMPELLING EARNINGS ACCRETION EFFECTIVE USE OF CAPITAL PRO FORMA 2013 RETURN ON EQUITY FORWARD 12-MONTH EPS ESTIMATES EPS EPS, excluding amortization2 3% $0.25 $0.20 $0.45 Recent Seaton Acquisition Increases Return on Equity and Earnings Accretion
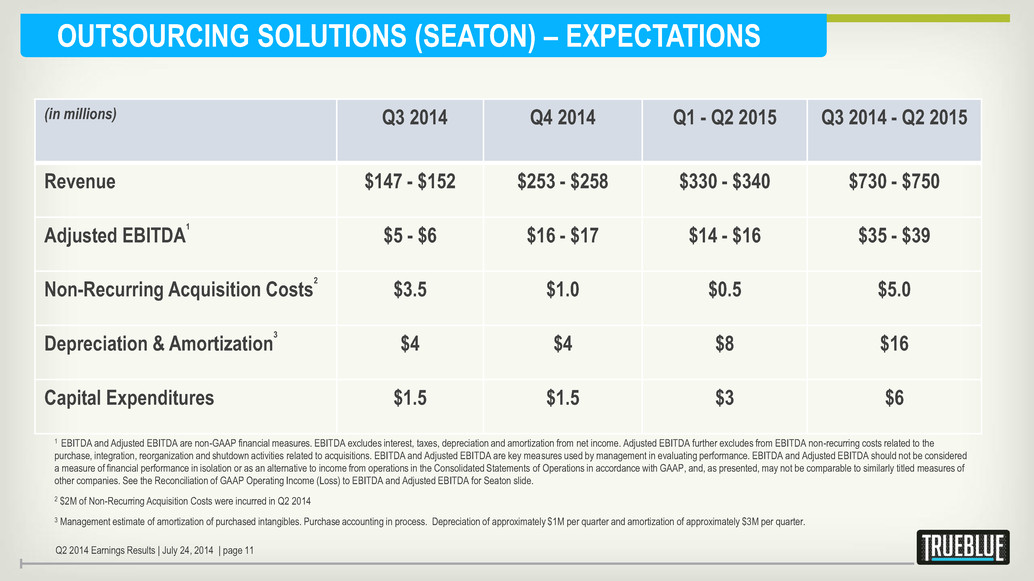
OUTSOURCING SOLUTIONS (SEATON) – EXPECTATIONS 1 EBITDA and Adjusted EBITDA are non-GAAP financial measures. EBITDA excludes interest, taxes, depreciation and amortization from net income. Adjusted EBITDA further excludes from EBITDA non-recurring costs related to the purchase, integration, reorganization and shutdown activities related to acquisitions. EBITDA and Adjusted EBITDA are key measures used by management in evaluating performance. EBITDA and Adjusted EBITDA should not be considered a measure of financial performance in isolation or as an alternative to income from operations in the Consolidated Statements of Operations in accordance with GAAP, and, as presented, may not be comparable to similarly titled measures of other companies. See the Reconciliation of GAAP Operating Income (Loss) to EBITDA and Adjusted EBITDA for Seaton slide. 2 $2M of Non-Recurring Acquisition Costs were incurred in Q2 2014 3 Management estimate of amortization of purchased intangibles. Purchase accounting in process. Depreciation of approximately $1M per quarter and amortization of approximately $3M per quarter. Q2 2014 Earnings Results | July 24, 2014 | page 11 (in millions) Q3 2014 Q4 2014 Q1 - Q2 2015 Q3 2014 - Q2 2015 Revenue $147 - $152 $253 - $258 $330 - $340 $730 - $750 Adjusted EBITDA 1 $5 - $6 $16 - $17 $14 - $16 $35 - $39 Non-Recurring Acquisition Costs 2 $3.5 $1.0 $0.5 $5.0 Depreciation & Amortization 3 $4 $4 $8 $16 Capital Expenditures $1.5 $1.5 $3 $6

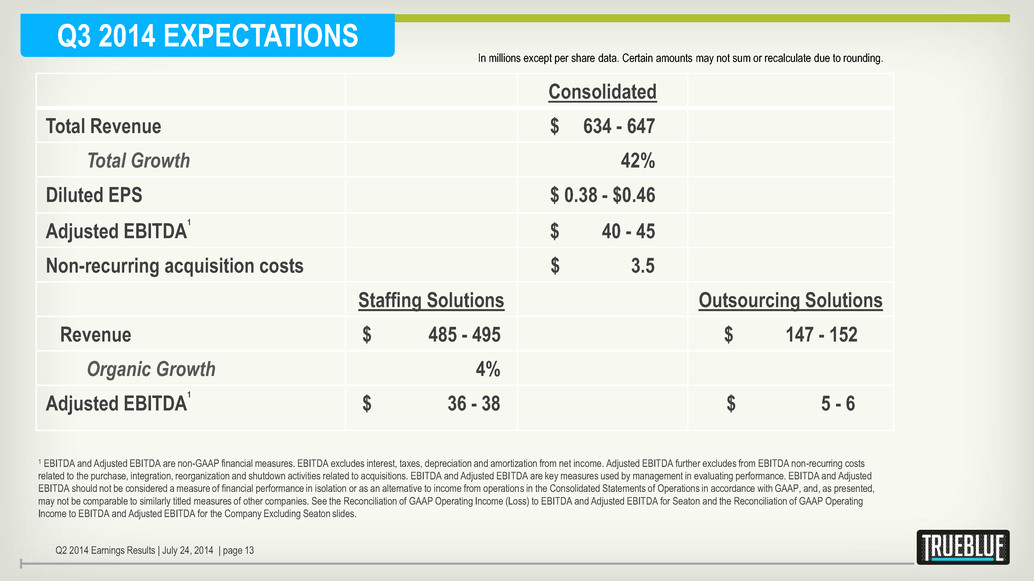
In millions except per share data. Certain amounts may not sum or recalculate due to rounding. 1 EBITDA and Adjusted EBITDA are non-GAAP financial measures. EBITDA excludes interest, taxes, depreciation and amortization from net income. Adjusted EBITDA further excludes from EBITDA non-recurring costs related to the purchase, integration, reorganization and shutdown activities related to acquisitions. EBITDA and Adjusted EBITDA are key measures used by management in evaluating performance. EBITDA and Adjusted EBITDA should not be considered a measure of financial performance in isolation or as an alternative to income from operations in the Consolidated Statements of Operations in accordance with GAAP, and, as presented, may not be comparable to similarly titled measures of other companies. See the Reconciliation of GAAP Operating Income (Loss) to EBITDA and Adjusted EBITDA for Seaton and the Reconciliation of GAAP Operating Income to EBITDA and Adjusted EBITDA for the Company Excluding Seaton slides. Q3 2014 EXPECTATIONS Q2 2014 Earnings Results | July 24, 2014 | page 13 Consolidated Total Revenue $ 634 - 647 Total Growth 42% Diluted EPS $ 0.38 - $0.46 Adjusted EBITDA 1 $ 40 - 45 Non-recurring acquisition costs $ 3.5 Staffing Solutions Outsourcing Solutions Revenue $ 485 - 495 $ 147 - 152 Organic Growth 4% Adjusted EBITDA 1 $ 36 - 38 $ 5 - 6
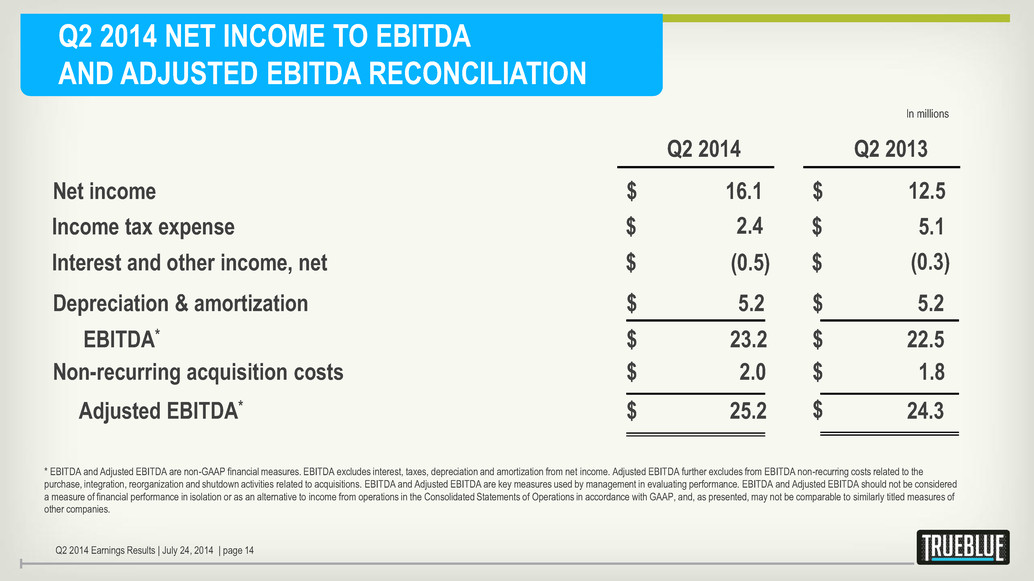
Q2 2014 NET INCOME TO EBITDA AND ADJUSTED EBITDA RECONCILIATION Q2 2014 Net income 16.1 $ Q2 2013 12.5 $ In millions Depreciation & amortization 5.2 $ EBITDA* 23.2 $ Non-recurring acquisition costs 2.0 $ Adjusted EBITDA* 25.2 $ 5.2 $ 22.5 $ 1.8 $ 24.3 $ Income tax expense 2.4 $ 5.1 $ Interest and other income, net (0.5) $ (0.3) $ * EBITDA and Adjusted EBITDA are non-GAAP financial measures. EBITDA excludes interest, taxes, depreciation and amortization from net income. Adjusted EBITDA further excludes from EBITDA non-recurring costs related to the purchase, integration, reorganization and shutdown activities related to acquisitions. EBITDA and Adjusted EBITDA are key measures used by management in evaluating performance. EBITDA and Adjusted EBITDA should not be considered a measure of financial performance in isolation or as an alternative to income from operations in the Consolidated Statements of Operations in accordance with GAAP, and, as presented, may not be comparable to similarly titled measures of other companies. Q2 2014 Earnings Results | July 24, 2014 | page 14
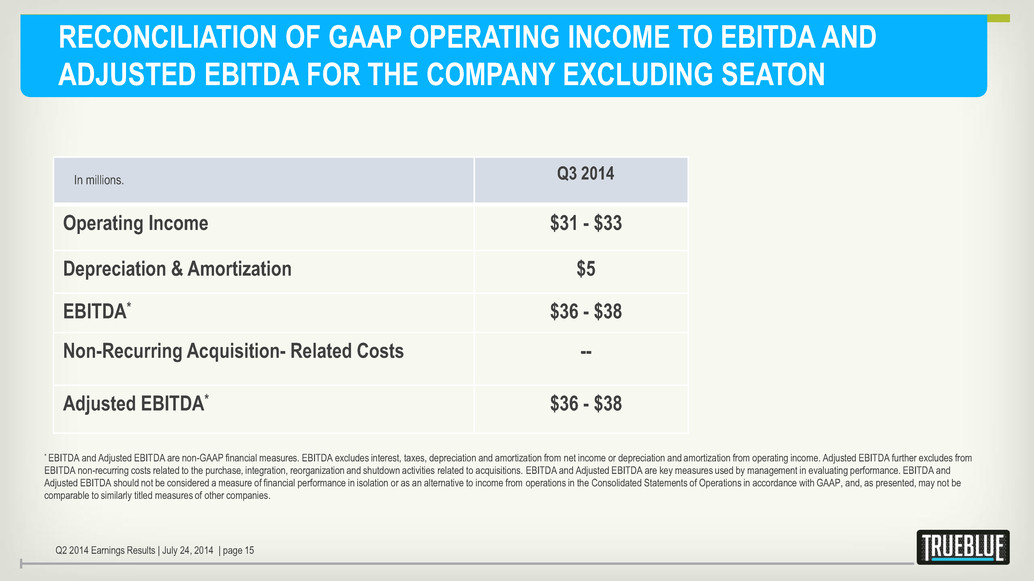
RECONCILIATION OF GAAP OPERATING INCOME TO EBITDA AND ADJUSTED EBITDA FOR THE COMPANY EXCLUDING SEATON * EBITDA and Adjusted EBITDA are non-GAAP financial measures. EBITDA excludes interest, taxes, depreciation and amortization from net income or depreciation and amortization from operating income. Adjusted EBITDA further excludes from EBITDA non-recurring costs related to the purchase, integration, reorganization and shutdown activities related to acquisitions. EBITDA and Adjusted EBITDA are key measures used by management in evaluating performance. EBITDA and Adjusted EBITDA should not be considered a measure of financial performance in isolation or as an alternative to income from operations in the Consolidated Statements of Operations in accordance with GAAP, and, as presented, may not be comparable to similarly titled measures of other companies. Q2 2014 Earnings Results | July 24, 2014 | page 15 Q3 2014 Operating Income $31 - $33 Depreciation & Amortization $5 EBITDA* $36 - $38 Non-Recurring Acquisition- Related Costs -- Adjusted EBITDA* $36 - $38 In millions.
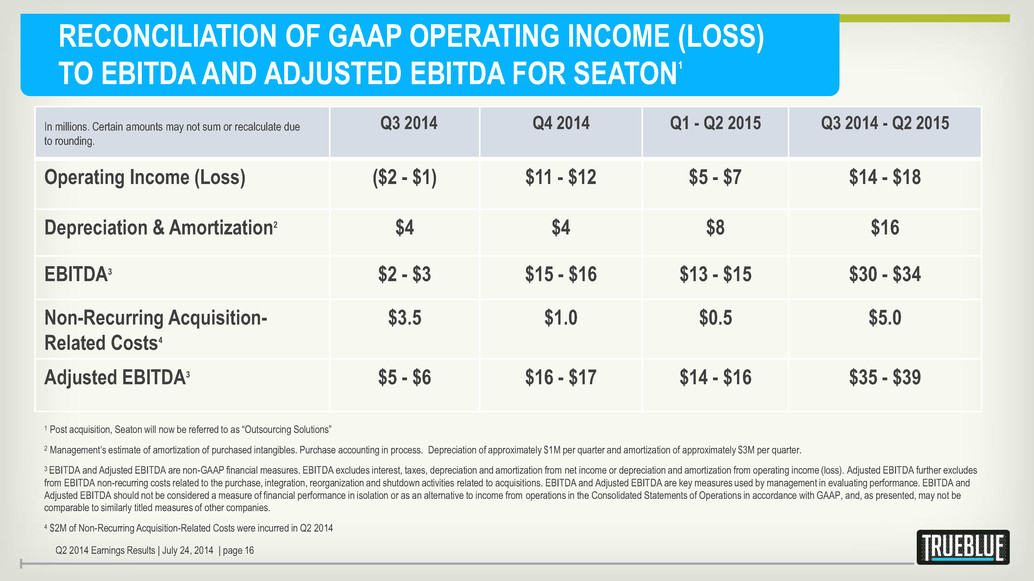
RECONCILIATION OF GAAP OPERATING INCOME (LOSS) TO EBITDA AND ADJUSTED EBITDA FOR SEATON 1 1 Post acquisition, Seaton will now be referred to as “Outsourcing Solutions” 2 Management’s estimate of amortization of purchased intangibles. Purchase accounting in process. Depreciation of approximately $1M per quarter and amortization of approximately $3M per quarter. 3 EBITDA and Adjusted EBITDA are non-GAAP financial measures. EBITDA excludes interest, taxes, depreciation and amortization from net income or depreciation and amortization from operating income (loss). Adjusted EBITDA further excludes from EBITDA non-recurring costs related to the purchase, integration, reorganization and shutdown activities related to acquisitions. EBITDA and Adjusted EBITDA are key measures used by management in evaluating performance. EBITDA and Adjusted EBITDA should not be considered a measure of financial performance in isolation or as an alternative to income from operations in the Consolidated Statements of Operations in accordance with GAAP, and, as presented, may not be comparable to similarly titled measures of other companies. 4 $2M of Non-Recurring Acquisition-Related Costs were incurred in Q2 2014 Q2 2014 Earnings Results | July 24, 2014 | page 16 Q3 2014 Q4 2014 Q1 - Q2 2015 Q3 2014 - Q2 2015 Operating Income (Loss) ($2 - $1) $11 - $12 $5 - $7 $14 - $18 Depreciation & Amortization2 $4 $4 $8 $16 EBITDA3 $2 - $3 $15 - $16 $13 - $15 $30 - $34 Non-Recurring Acquisition- Related Costs4 $3.5 $1.0 $0.5 $5.0 Adjusted EBITDA3 $5 - $6 $16 - $17 $14 - $16 $35 - $39 In millions. Certain amounts may not sum or recalculate due to rounding.