Certain statements made by us in this presentation that are not historical facts or that relate to future plans, events or performances are forward-looking statements that reflect management’s current outlook for future periods, including statements regarding future financial performance. These forward-looking statements are based upon our current expectations, and our actual results may differ materially from those described or contemplated in the forward–looking statements. Factors that may cause our actual results to differ materially from those contained in the forward-looking statements, include without limitation the following: 1) national and global economic conditions, including the impact of changes in national and global credit markets and other changes on our customers; 2) our ability to continue to attract and retain customers and maintain profit margins in the face of new and existing competition; 3) new laws and regulations that could have a materially adverse effect on our operations and financial results; 4) significant labor disturbances which could disrupt industries we serve; 5) increased costs and collateral requirements in connection with our insurance obligations, including workers’ compensation insurance; 6) the adequacy of our financial reserves; 7) our continuing ability to comply with financial covenants in our lines of credit and other financing agreements; 8) our ability to attract and retain competent employees in key positions or to find temporary employees to fulfill the needs of our customers; 9) our ability to successfully complete and integrate acquisitions that we may make; and 10) other risks described in our filings with the Securities and Exchange Commission, including our most recent Form 10-K and Form 10-Q filings. Use of estimates and forecasts: Any references made to 2014 are based on management guidance issued Feb. 6, 2014, and are included for informational purposes only and are not an update or reaffirmation. We assume no obligation to update or revise any forward-looking statement, whether as a result of new information, future events, or otherwise, except as required by law. Any other reference to future financial estimates are included for informational purposes only and subject to risk factors discussed in our most recent 10-K and 10-Q filings. Q4 2013 Earnings Results | Feb. 6, 2014 | page 2 FORWARD-LOOKING STATEMENT
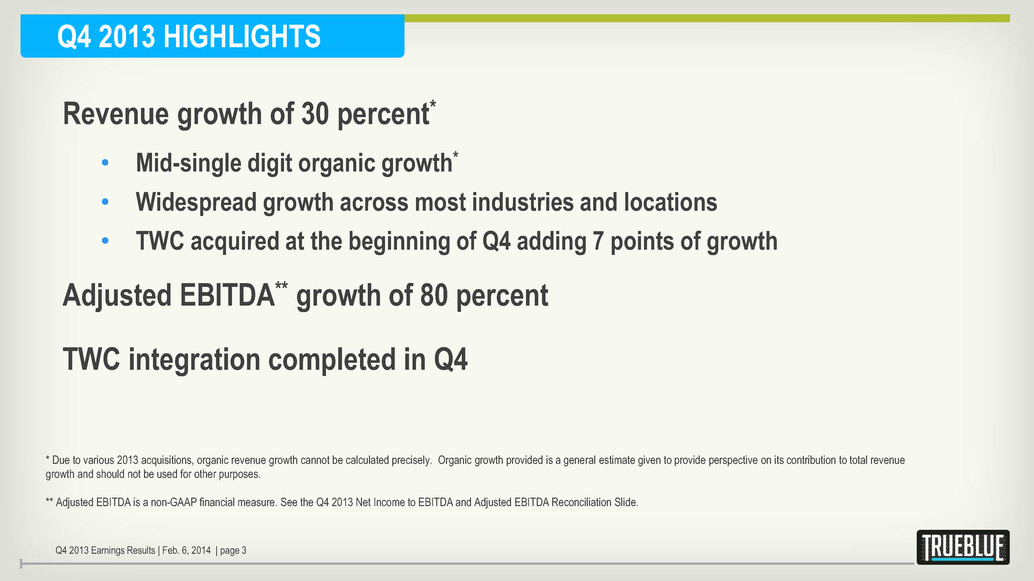
Q4 2013 HIGHLIGHTS Revenue growth of 30 percent* • Mid-single digit organic growth* • Widespread growth across most industries and locations • TWC acquired at the beginning of Q4 adding 7 points of growth Adjusted EBITDA** growth of 80 percent TWC integration completed in Q4 Q4 2013 Earnings Results | Feb. 6, 2014 | page 3 * Due to various 2013 acquisitions, organic revenue growth cannot be calculated precisely. Organic growth provided is a general estimate given to provide perspective on its contribution to total revenue growth and should not be used for other purposes. ** Adjusted EBITDA is a non-GAAP financial measure. See the Q4 2013 Net Income to EBITDA and Adjusted EBITDA Reconciliation Slide.
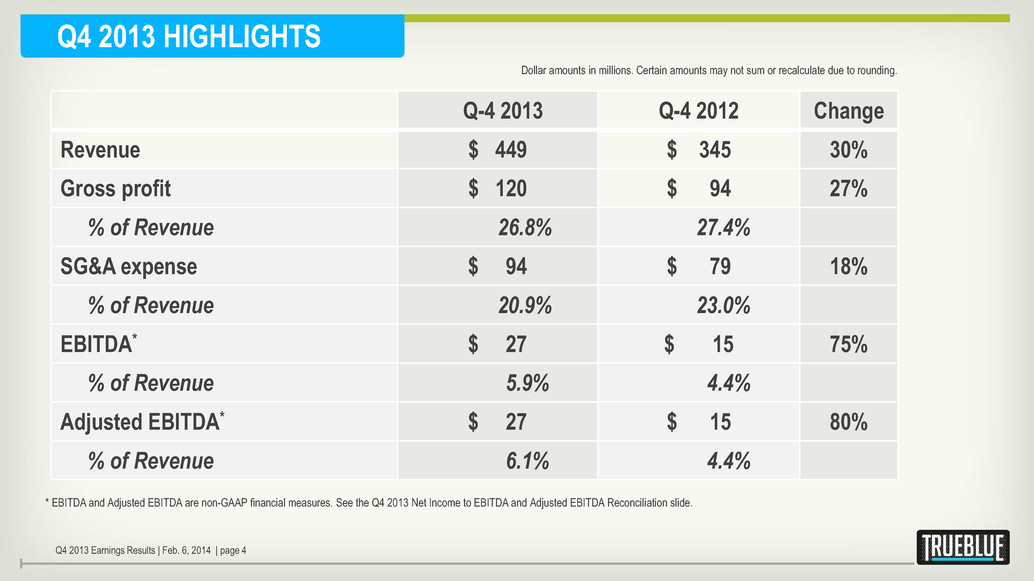
Q4 2013 HIGHLIGHTS Dollar amounts in millions. Certain amounts may not sum or recalculate due to rounding. Q-4 2013 Q-4 2012 Change Revenue $ 449 $ 345 30% Gross profit $ 120 $ 94 27% % of Revenue 26.8% 27.4% SG&A expense $ 94 $ 79 18% % of Revenue 20.9% 23.0% EBITDA* $ 27 $ 15 75% % of Revenue 5.9% 4.4% Adjusted EBITDA* $ 27 $ 15 80% % of Revenue 6.1% 4.4% * EBITDA and Adjusted EBITDA are non-GAAP financial measures. See the Q4 2013 Net Income to EBITDA and Adjusted EBITDA Reconciliation slide. Q4 2013 Earnings Results | Feb. 6, 2014 | page 4
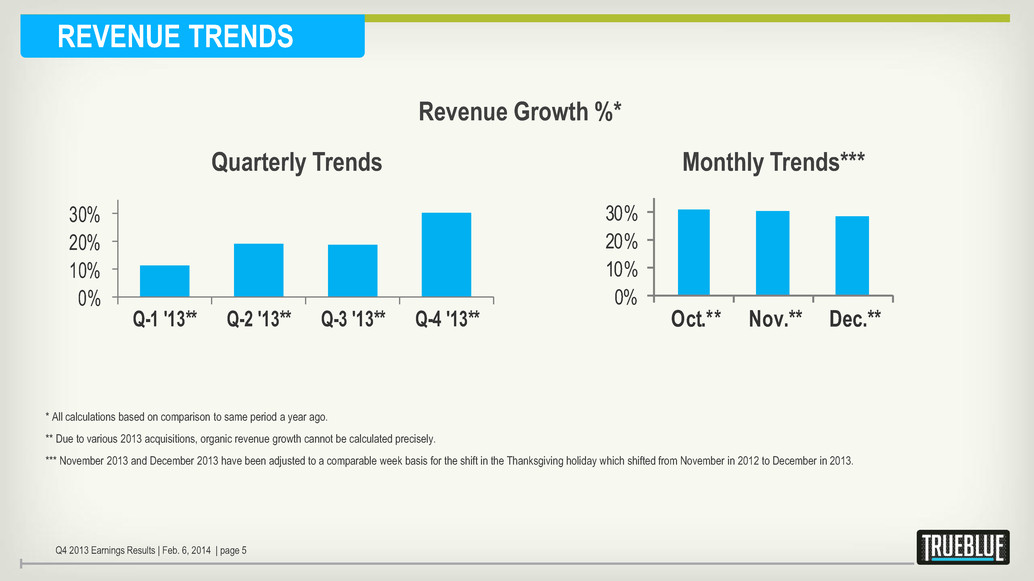
REVENUE TRENDS 0% 10% 20% 30% Q-1 '13** Q-2 '13** Q-3 '13** Q-4 '13** 0% 10% 20% 30% Oct.** Nov.** Dec.** * All calculations based on comparison to same period a year ago. ** Due to various 2013 acquisitions, organic revenue growth cannot be calculated precisely. *** November 2013 and December 2013 have been adjusted to a comparable week basis for the shift in the Thanksgiving holiday which shifted from November in 2012 to December in 2013. Monthly Trends*** Revenue Growth %* Quarterly Trends Q4 2013 Earnings Results | Feb. 6, 2014 | page 5
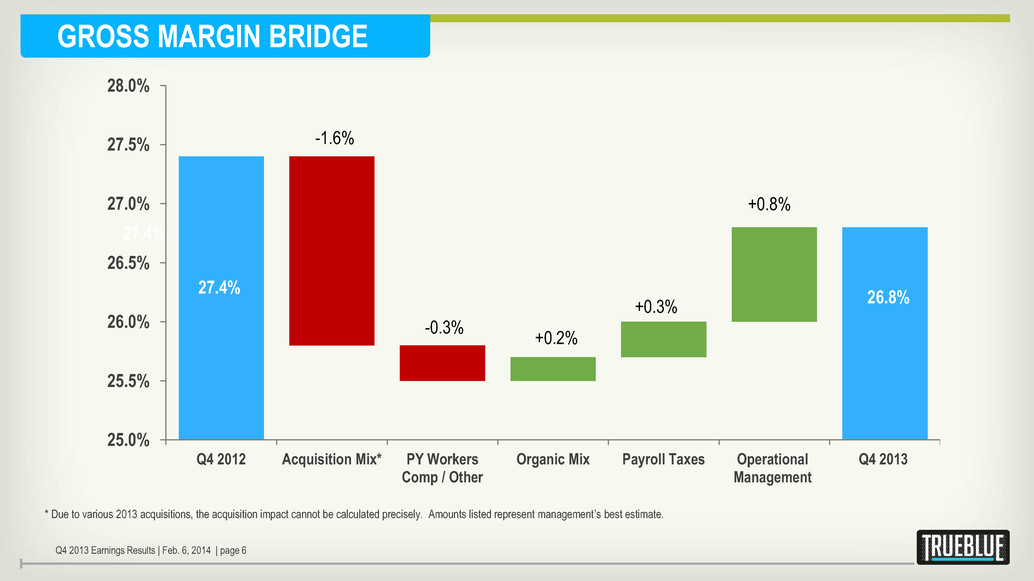
GROSS MARGIN BRIDGE * Due to various 2013 acquisitions, the acquisition impact cannot be calculated precisely. Amounts listed represent management’s best estimate. Q4 2013 Earnings Results | Feb. 6, 2014 | page 6 25.0% 25.5% 26.0% 26.5% 27.0% 27.5% 28.0% Q4 2012 Acquisition Mix* PY Workers Comp / Other Organic Mix Payroll Taxes Operational Management Q4 2013 27.4% 26.8% -1.6% +0.8% +0.2% +0.3% -0.3% 27.4%
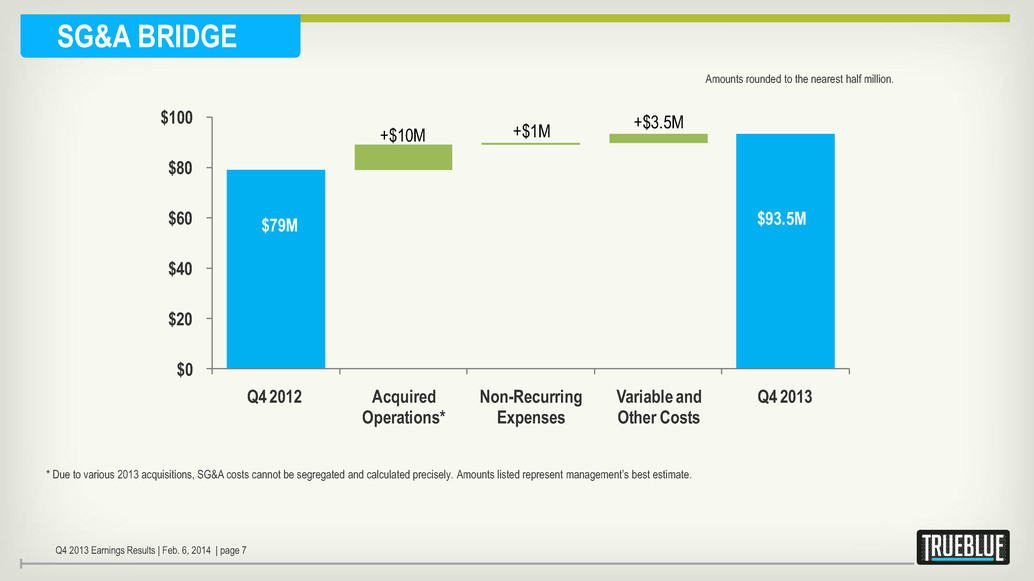
$0 $20 $40 $60 $80 $100 Q4 2012 Acquired Operations* Non-Recurring Expenses Variable and Other Costs Q4 2013 +$10M $79M $93.5M +$3.5M +$1M SG&A BRIDGE * Due to various 2013 acquisitions, SG&A costs cannot be segregated and calculated precisely. Amounts listed represent management’s best estimate. Q4 2013 Earnings Results | Feb. 6, 2014 | page 7 Amounts rounded to the nearest half million.
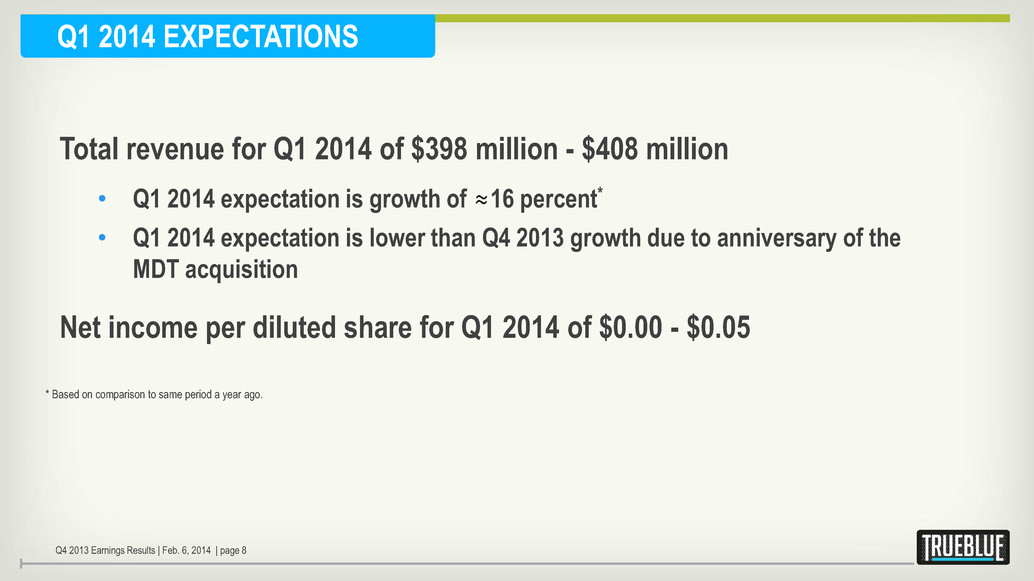
Q1 2014 EXPECTATIONS Total revenue for Q1 2014 of $398 million - $408 million • Q1 2014 expectation is growth of 16 percent* • Q1 2014 expectation is lower than Q4 2013 growth due to anniversary of the MDT acquisition Net income per diluted share for Q1 2014 of $0.00 - $0.05 * Based on comparison to same period a year ago. Q4 2013 Earnings Results | Feb. 6, 2014 | page 8

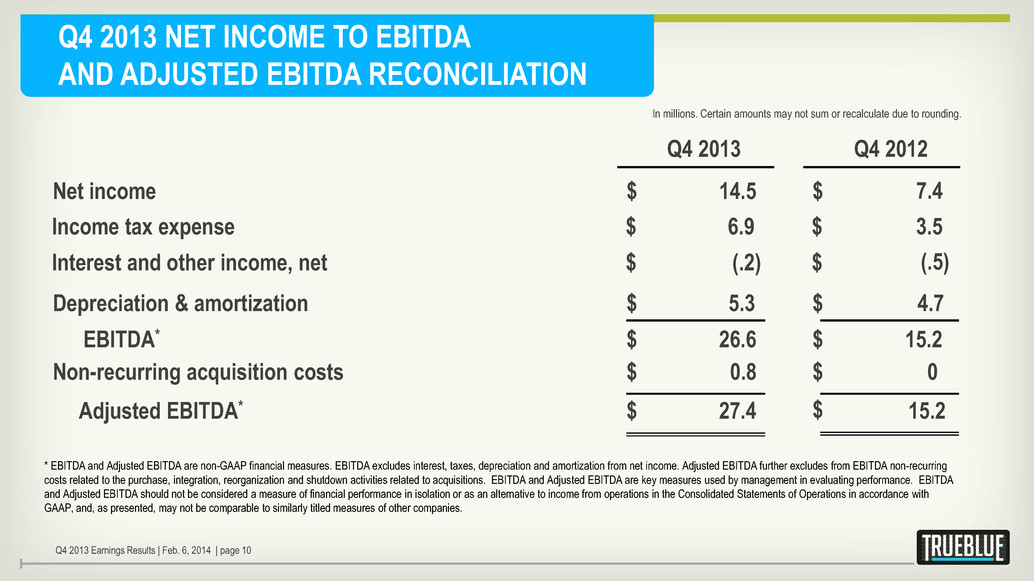
Q4 2013 NET INCOME TO EBITDA AND ADJUSTED EBITDA RECONCILIATION Q4 2013 Net income 14.5 $ Q4 2012 7.4 $ Q4 2013 Earnings Results | Feb. 6, 2014 | page 10 In millions. Certain amounts may not sum or recalculate due to rounding. Depreciation & amortization 5.3 $ EBITDA* 26.6 $ Non-recurring acquisition costs 0.8 $ Adjusted EBITDA* 27.4 $ 4.7 $ 15.2 $ 0 $ 15.2 $ Income tax expense 6.9 $ 3.5 $ Interest and other income, net (.2) $ (.5) $ * EBITDA and Adjusted EBITDA are non-GAAP financial measures. EBITDA excludes interest, taxes, depreciation and amortization from net income. Adjusted EBITDA further excludes from EBITDA non-recurring costs related to the purchase, integration, reorganization and shutdown activities related to acquisitions. EBITDA and Adjusted EBITDA are key measures used by management in evaluating performance. EBITDA and Adjusted EBITDA should not be considered a measure of financial performance in isolation or as an alternative to income from operations in the Consolidated Statements of Operations in accordance with GAAP, and, as presented, may not be comparable to similarly titled measures of other companies.