
Certain statements made by us in this presentation that are not historical facts or that relate to future plans, events or performances are forward-looking statements that reflect management’s current outlook for future periods, including statements regarding future financial performance. These forward-looking statements are based upon our current expectations, and our actual results may differ materially from those described or contemplated in the forward–looking statements. Factors that may cause our actual results to differ materially from those contained in the forward-looking statements, include without limitation the following: 1) national and global economic conditions, including the impact of changes in national and global credit markets and other changes on our customers; 2) our ability to continue to attract and retain customers and maintain profit margins in the face of new and existing competition; 3) new laws and regulations that could have a materially adverse effect on our operations and financial results; 4) significant labor disturbances which could disrupt industries we serve; 5) increased costs and collateral requirements in connection with our insurance obligations, including workers’ compensation insurance; 6) the adequacy of our financial reserves; 7) our continuing ability to comply with financial covenants in our lines of credit and other financing agreements; 8) our ability to attract and retain competent employees in key positions or to find temporary employees to fulfill the needs of our customers; 9) our ability to successfully complete and integrate acquisitions that we may make from time to time; and 10) other risks described in our filings with the Securities and Exchange Commission, including our most recent Form 10-K and Form 10-Q filings. Use of estimates and forecasts: Any references made to Q-2 2011 or fiscal year 2011 are based on management guidance issued April 27, 2011, and are included for informational purposes only and are not an update or reaffirmation. Any other reference to future financial estimates are included for informational purposes only and subject to factors discussed in our 10-K and 10-Q filings. Cautionary Note About Forward-Looking Statements: 2
TrueBlue Investment Highlights 3 Specialized approach in serving the market Compelling growth potential for staffing industry Unique industry-related drivers for TrueBlue More opportunities to serve the staffing market Multiple growth strategies Strong operating leverage Solid balance sheet
Every day, we use our specialized approach to the market to find new opportunities to better serve customers and workers at all skill levels. A Leading Provider of Blue-Collar Staffing 4
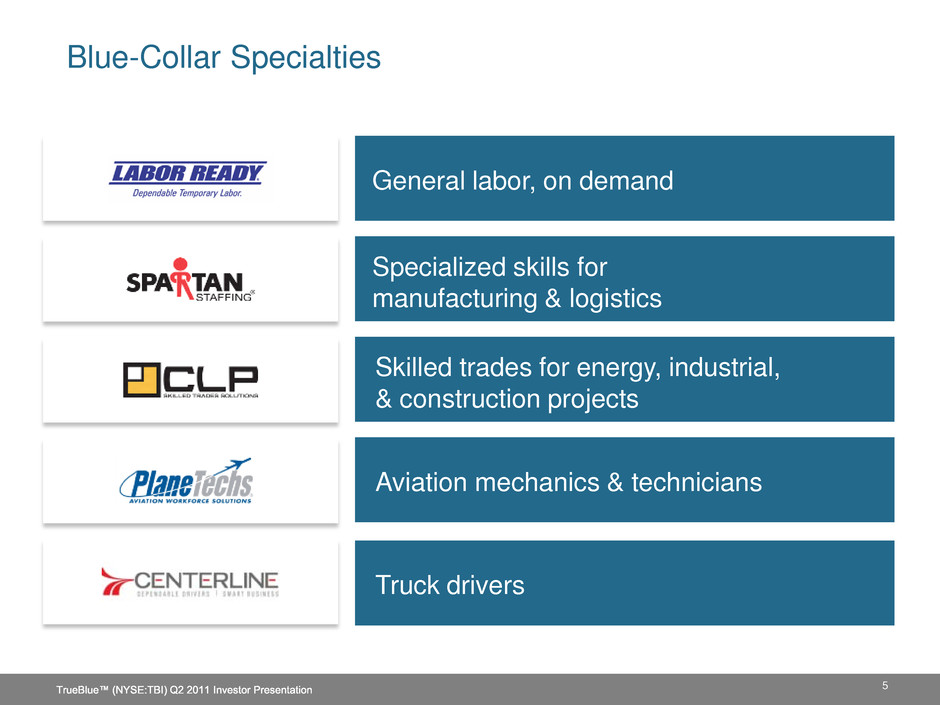
General labor, on demand Specialized skills for manufacturing & logistics Skilled trades for energy, industrial, & construction projects Aviation mechanics & technicians Truck drivers Blue-Collar Specialties 5
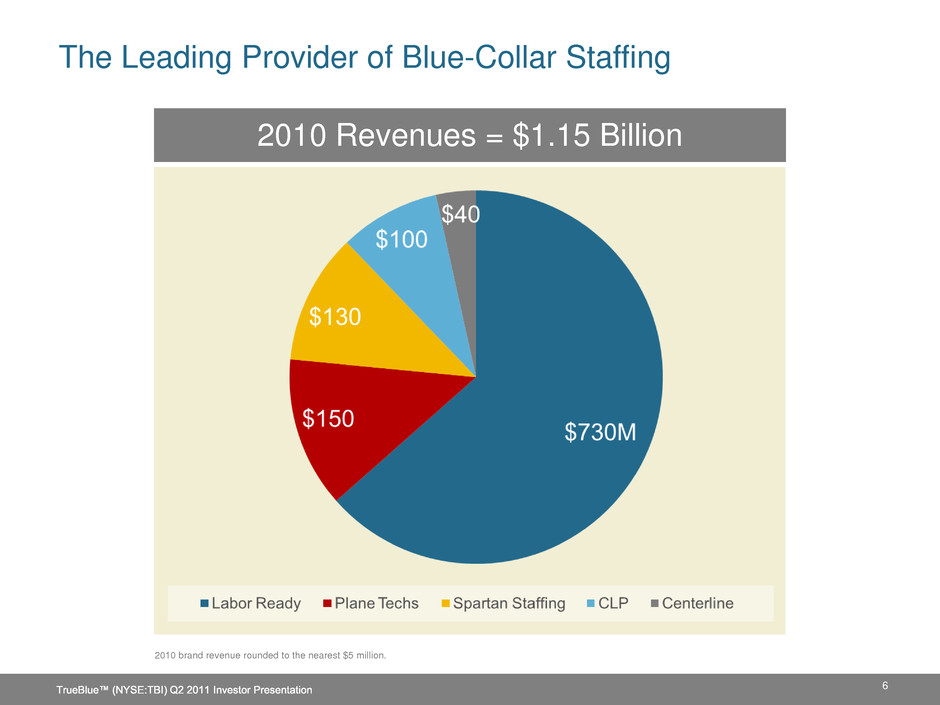
The Leading Provider of Blue-Collar Staffing 2010 Revenues = $1.15 Billion 2010 brand revenue rounded to the nearest $5 million. 6
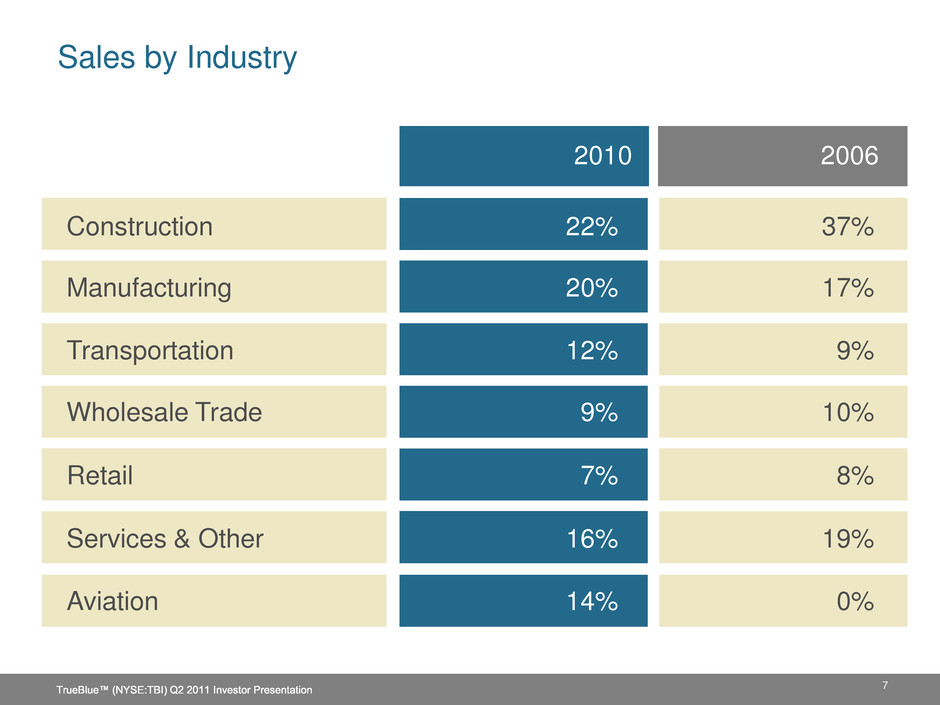
7 Sales by Industry 2010 2006 Construction 22% 37% Manufacturing 20% 17% Transportation 12% 9% Wholesale Trade 9% 10% Retail 7% 8% Services & Other 16% 19% Aviation 14% 0%
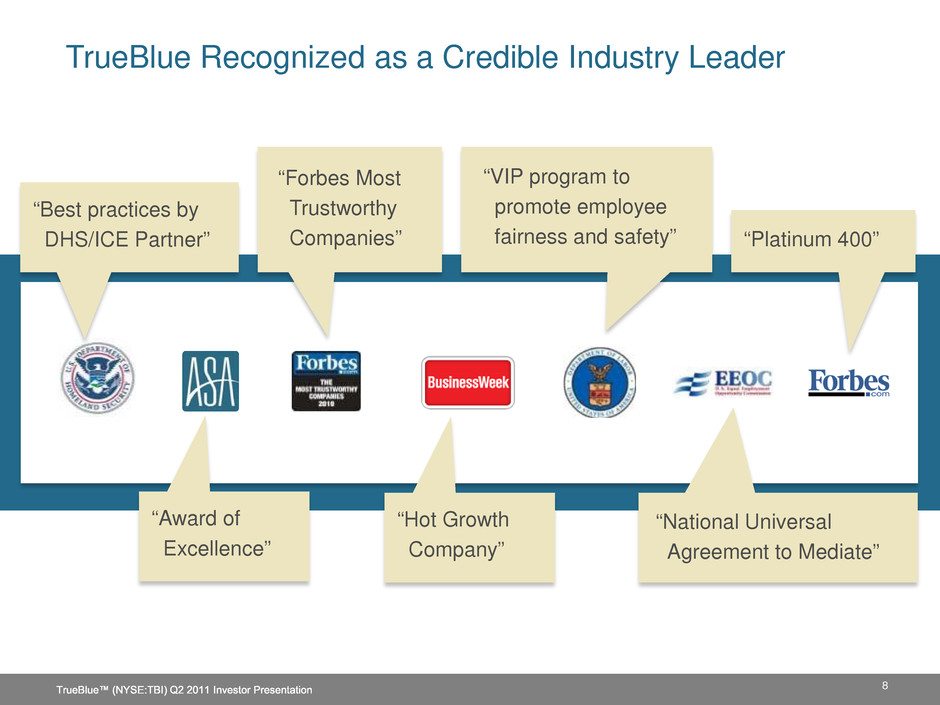
“Best practices by DHS/ICE Partner” “Forbes Most Trustworthy Companies” “VIP program to promote employee fairness and safety” “Platinum 400” “Award of Excellence” “Hot Growth Company” “National Universal Agreement to Mediate” 8 TrueBlue Recognized as a Credible Industry Leader
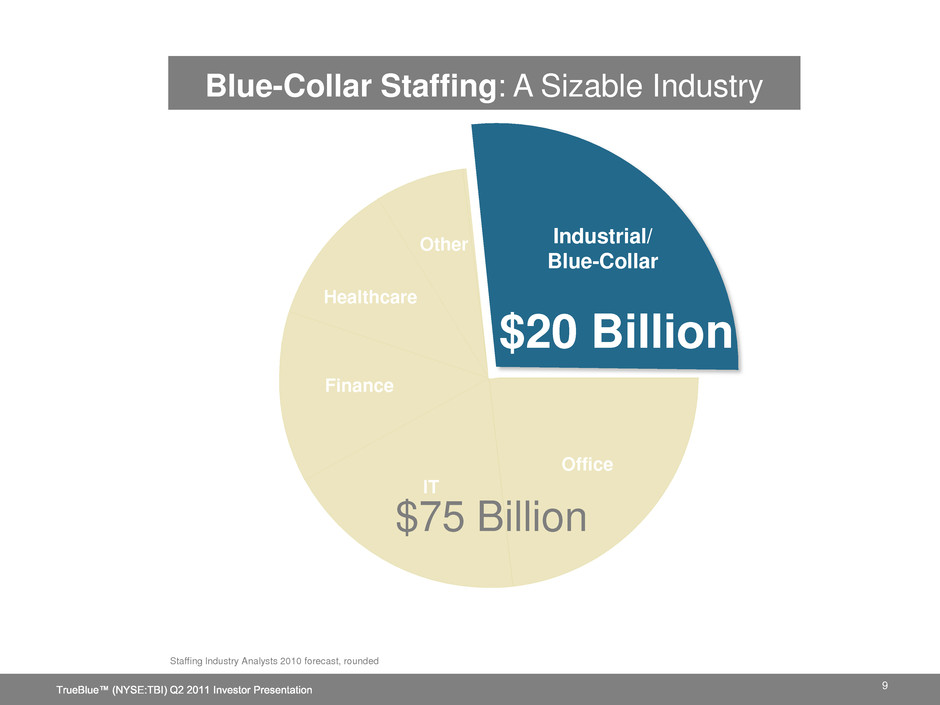
Other Finance Healthcare Office IT 9 Blue-Collar Staffing: A Sizable Industry Staffing Industry Analysts 2010 forecast, rounded $20 Billion Industrial/ Blue-Collar $75 Billion
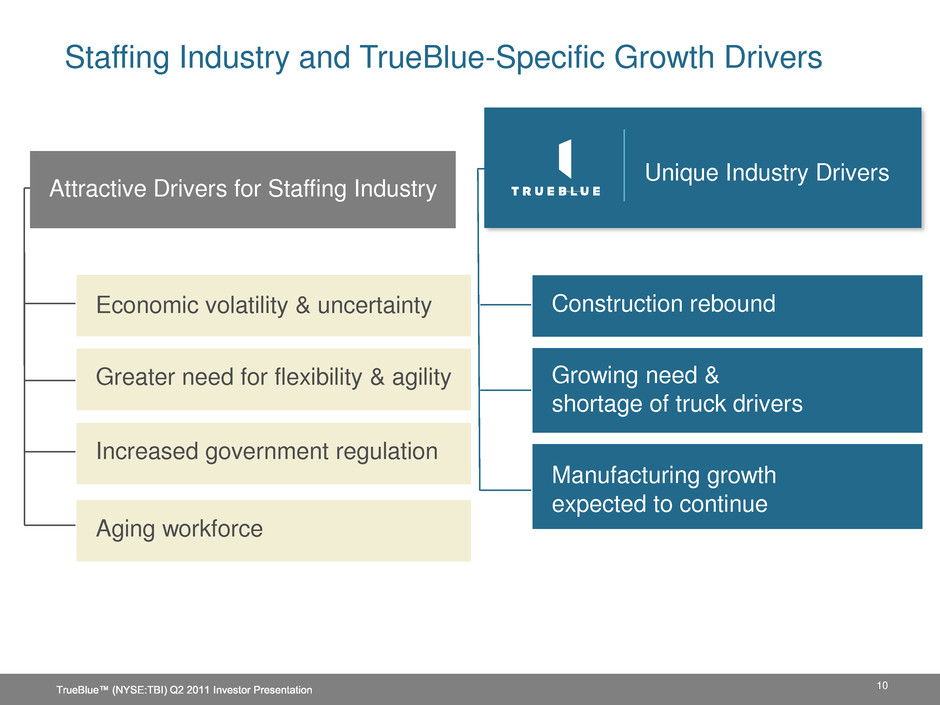
Attractive Drivers for Staffing Industry Economic volatility & uncertainty Greater need for flexibility & agility Increased government regulation Unique Industry Drivers Construction rebound Growing need & shortage of truck drivers Manufacturing growth expected to continue Staffing Industry and TrueBlue-Specific Growth Drivers 10 Aging workforce
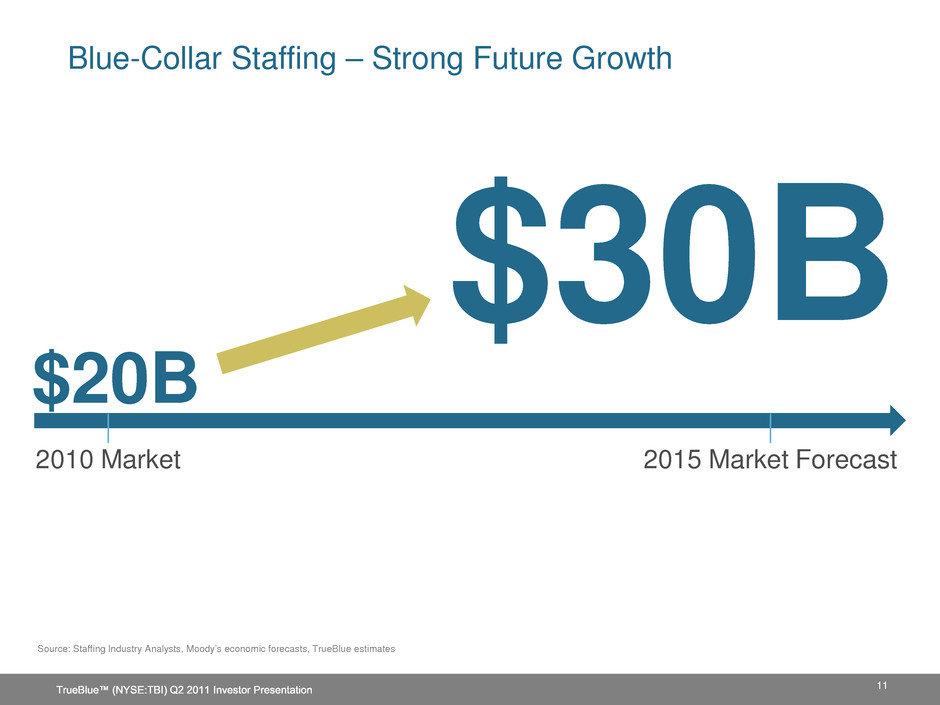
$20B 2015 Market Forecast $30B Source: Staffing Industry Analysts, Moody’s economic forecasts, TrueBlue estimates 2010 Market Blue-Collar Staffing – Strong Future Growth 11
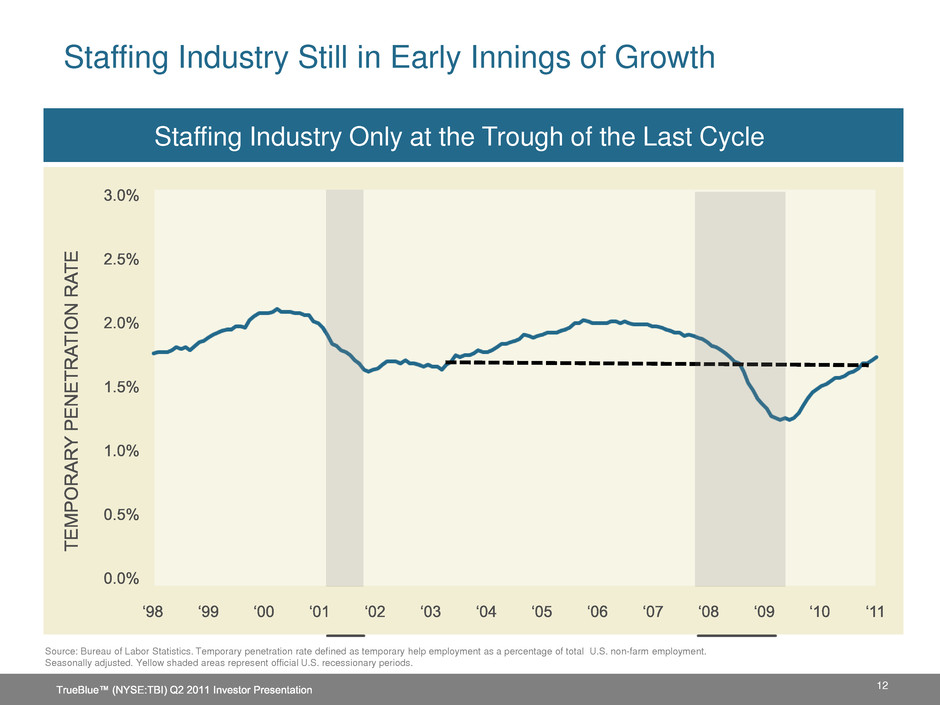
Staffing Industry Still in Early Innings of Growth Staffing Industry Only at the Trough of the Last Cycle Source: Bureau of Labor Statistics. Temporary penetration rate defined as temporary help employment as a percentage of total U.S. non-farm employment. Seasonally adjusted. Yellow shaded areas represent official U.S. recessionary periods. 12
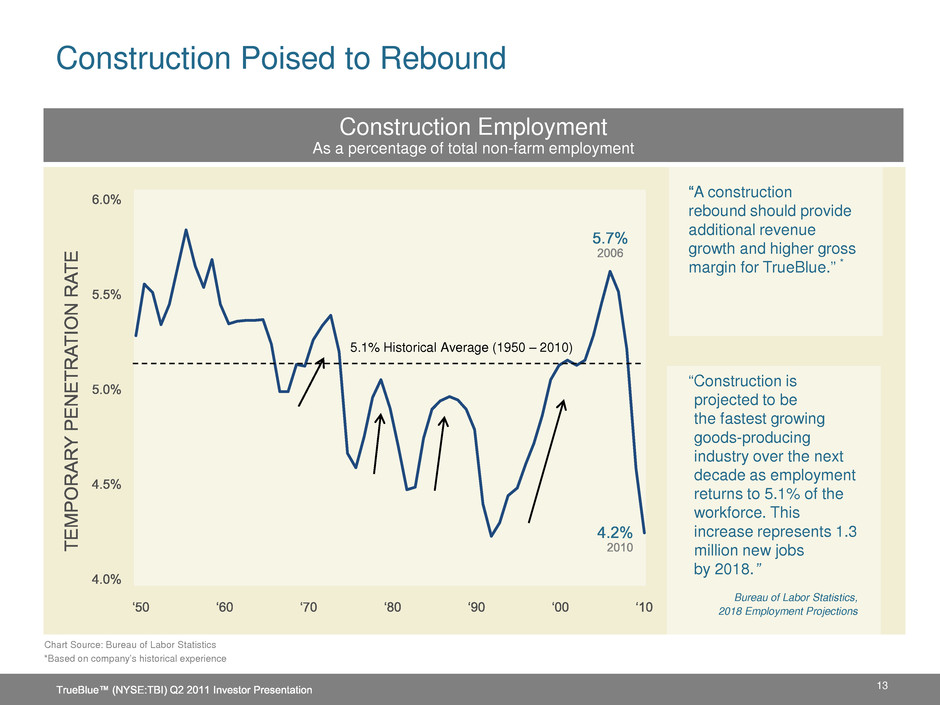
Construction Poised to Rebound Construction Employment As a percentage of total non-farm employment 13 5.1% Historical Average (1950 – 2010) “Construction is projected to be the fastest growing goods-producing industry over the next decade as employment returns to 5.1% of the workforce. This increase represents 1.3 million new jobs by 2018.” Bureau of Labor Statistics, 2018 Employment Projections A construction rebound should provide additional revenue growth and higher gross margin for TrueBlue.” * Chart Source: Bureau of Labor Statistics *Based on company’s historical experience
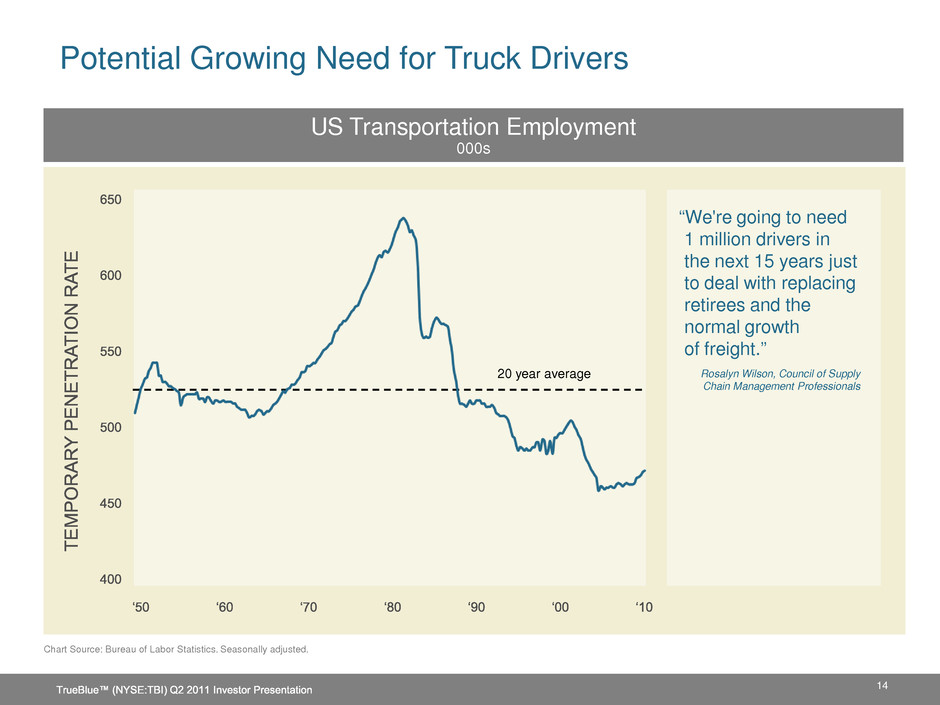
Potential Growing Need for Truck Drivers US Transportation Employment 000s Chart Source: Bureau of Labor Statistics. Seasonally adjusted. 14 “We're going to need 1 million drivers in the next 15 years just to deal with replacing retirees and the normal growth of freight.” Rosalyn Wilson, Council of Supply Chain Management Professionals 20 year average
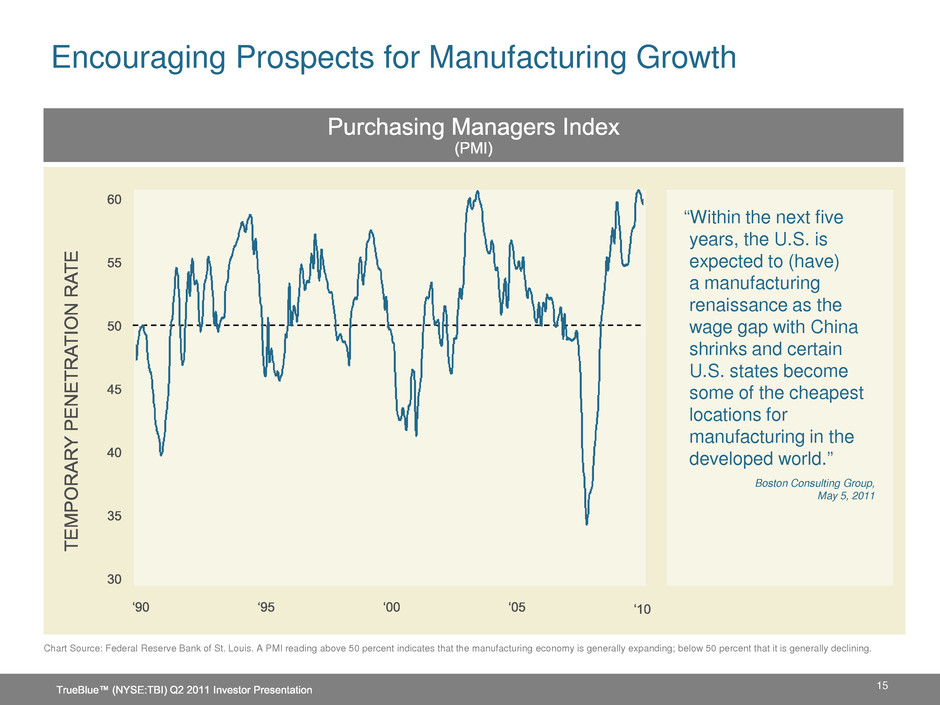
Encouraging Prospects for Manufacturing Growth Chart Source: Federal Reserve Bank of St. Louis. A PMI reading above 50 percent indicates that the manufacturing economy is generally expanding; below 50 percent that it is generally declining. 15 “Within the next five years, the U.S. is expected to (have) a manufacturing renaissance as the wage gap with China shrinks and certain U.S. states become some of the cheapest locations for manufacturing in the developed world.” Boston Consulting Group, May 5, 2011
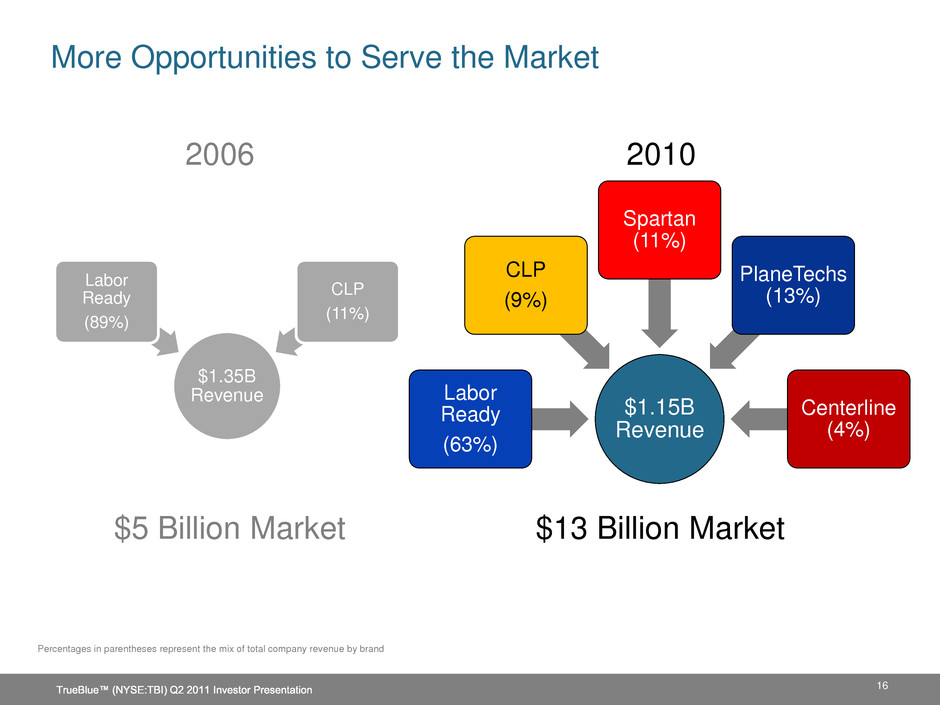
$1.35B Revenue Labor Ready (89%) CLP (11%) $5 Billion Market 2006 $1.15B Revenue Labor Ready (63%) CLP (9%) Spartan (11%) PlaneTechs (13%) Centerline (4%) 2010 $13 Billion Market 16 More Opportunities to Serve the Market Percentages in parentheses represent the mix of total company revenue by brand
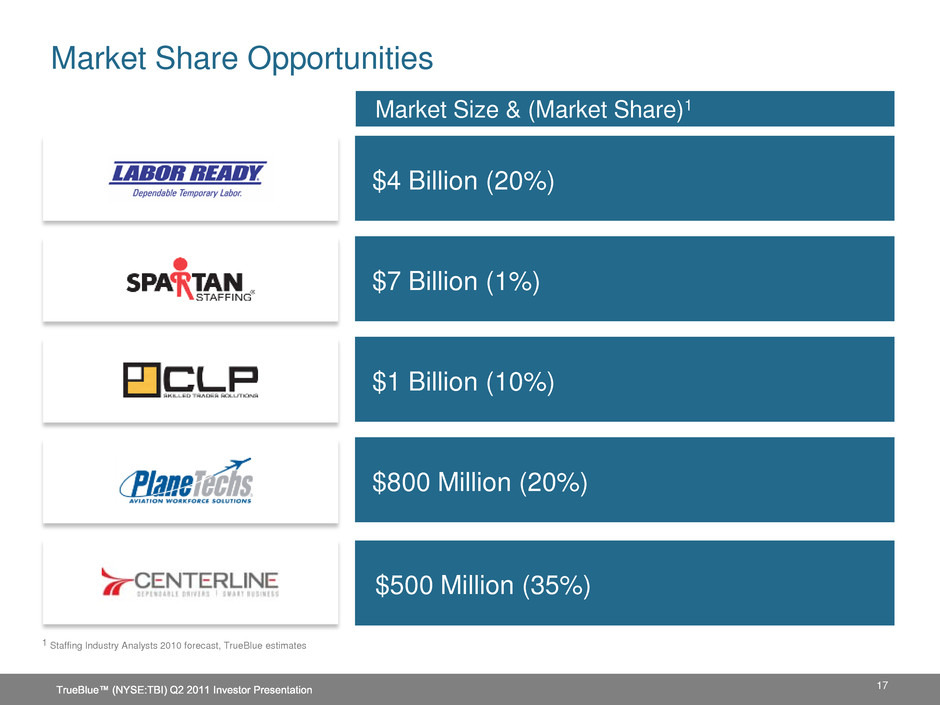
$4 Billion (20%) $7 Billion (1%) $1 Billion (10%) $800 Million (20%) $500 Million (35%) Market Share Opportunities 1 Staffing Industry Analysts 2010 forecast, TrueBlue estimates Market Size & (Market Share)1 17
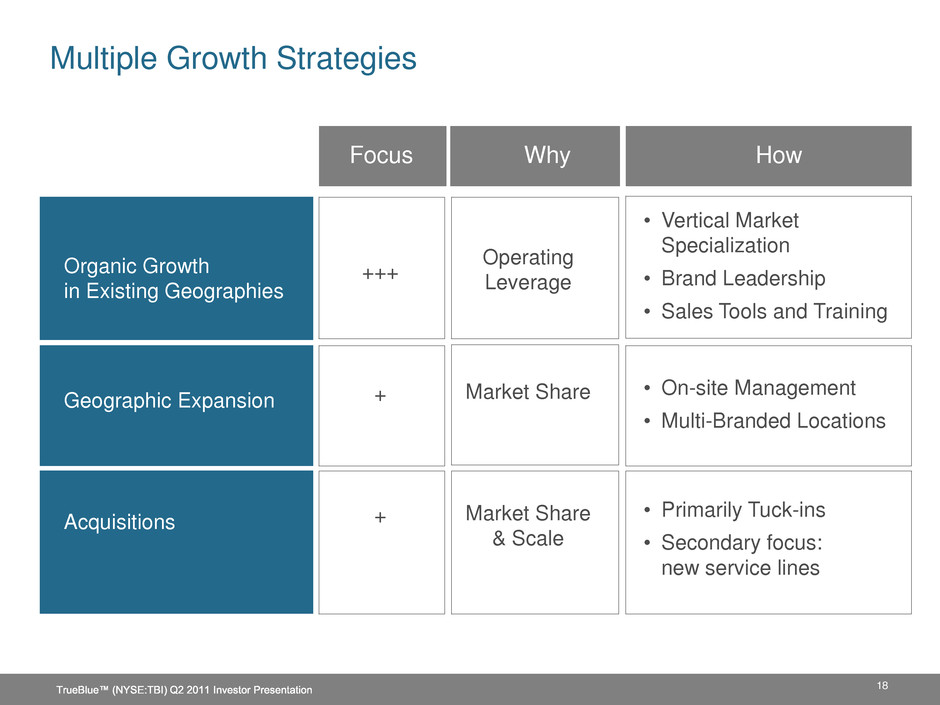
18 Multiple Growth Strategies Focus HowWhy Organic Growth in Existing Geographies Geographic Expansion Acquisitions +++ + + Operating Leverage Market Share Market Share & Scale • Vertical Market Specialization • Brand Leadership • Sales Tools and Training • On-site Management • Multi-Branded Locations • Primarily Tuck-ins • Secondary focus: new service lines
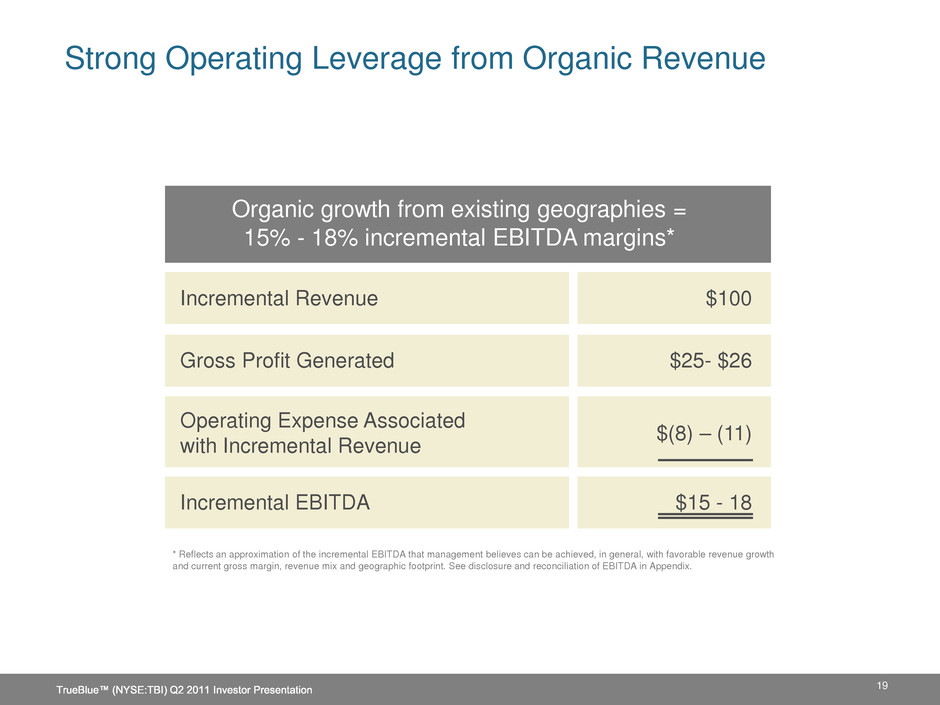
19 Strong Operating Leverage from Organic Revenue Incremental Revenue $100 Gross Profit Generated $25- $26 Operating Expense Associated with Incremental Revenue $(8) – (11) Incremental EBITDA $15 - 18 Organic growth from existing geographies = 15% - 18% incremental EBITDA margins* * Reflects an approximation of the incremental EBITDA that management believes can be achieved, in general, with favorable revenue growth and current gross margin, revenue mix and geographic footprint. See disclosure and reconciliation of EBITDA in Appendix.
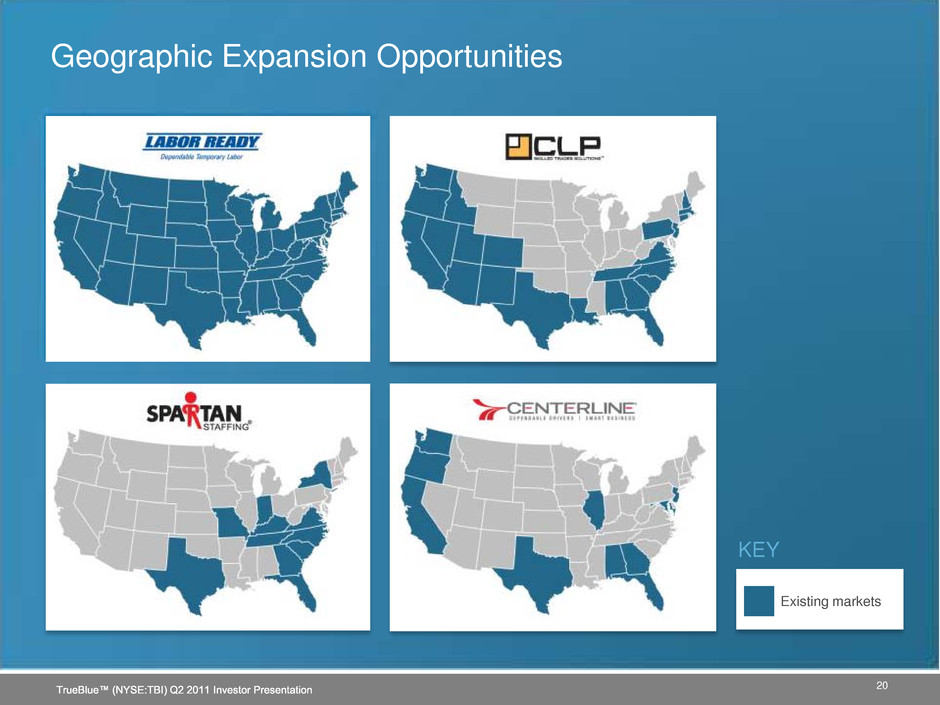
Geographic Expansion Opportunities Existing markets KEY 20
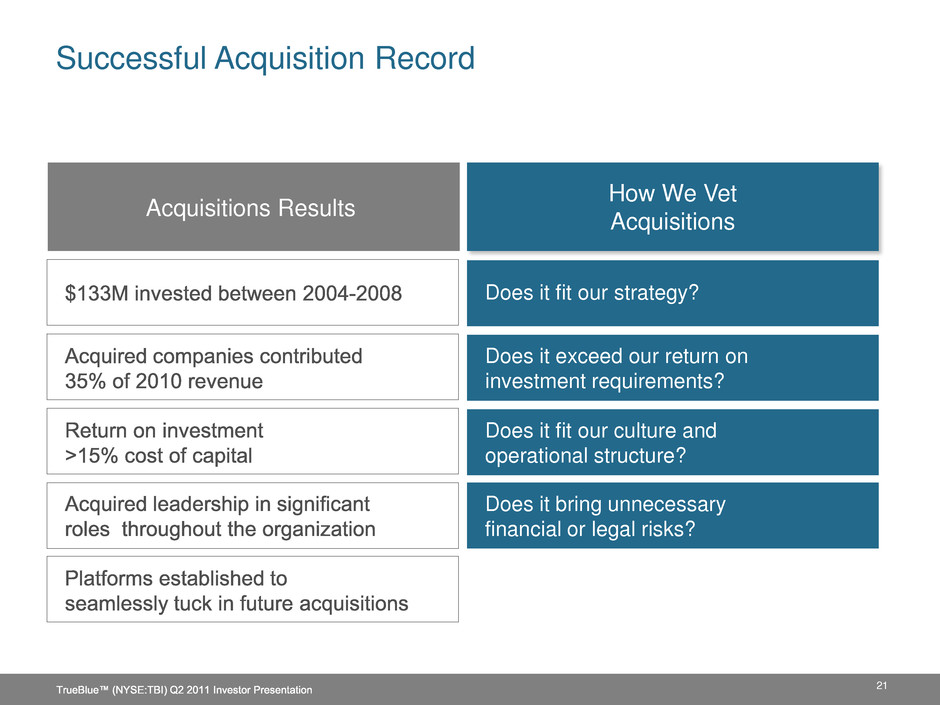
Successful Acquisition Record Acquisitions Results How We Vet Acquisitions Does it fit our strategy? Does it exceed our return on investment requirements? Does it fit our culture and operational structure? Does it bring unnecessary financial or legal risks? 21

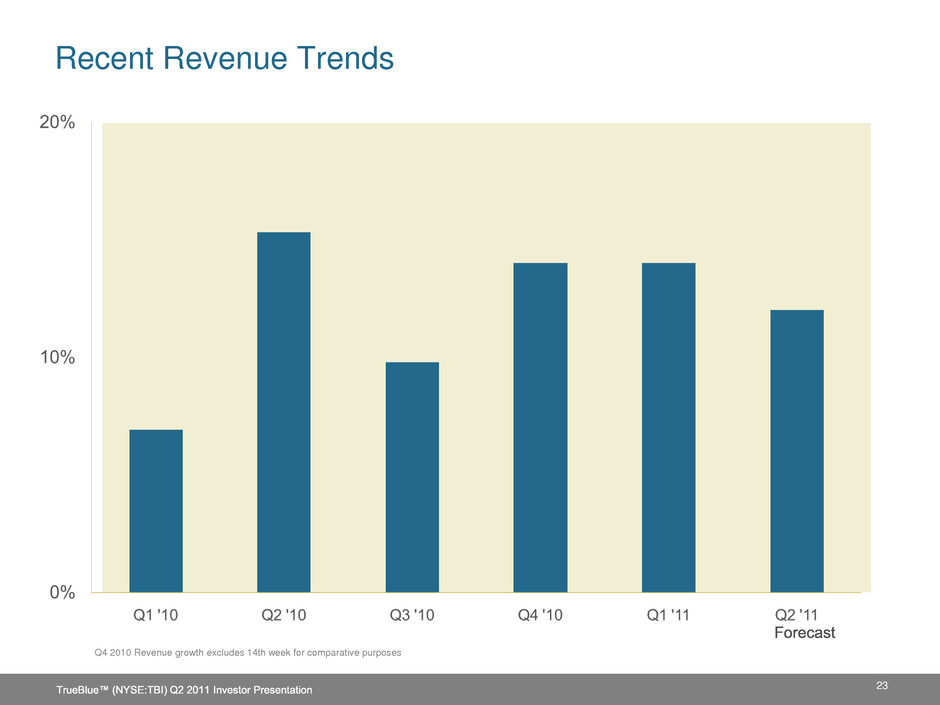
Recent Revenue Trends 23 Q4 2010 Revenue growth excludes 14th week for comparative purposes
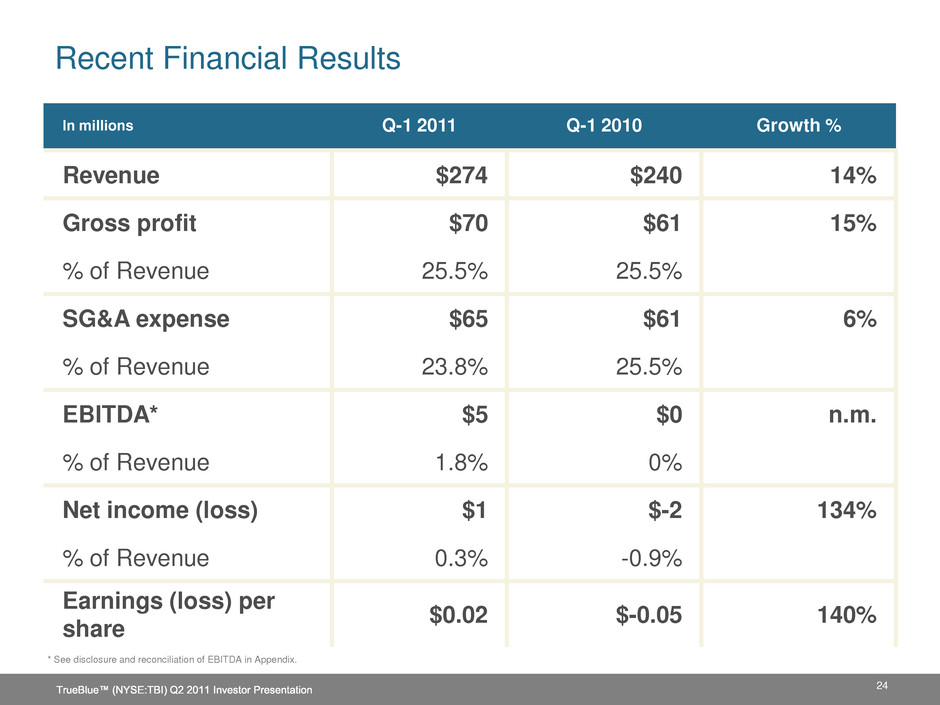
24 Recent Financial Results In millions Q-1 2011 Q-1 2010 Growth % Revenue $274 $240 14% Gross profit $70 $61 15% % of Revenue 25.5% 25.5% SG&A expense $65 $61 6% % of Revenue 23.8% 25.5% EBITDA* $5 $0 n.m. % of Revenue 1.8% 0% Net income (loss) $1 $-2 134% % of Revenue 0.3% -0.9% Earnings (loss) per share $0.02 $-0.05 140% * See disclosure and reconciliation of EBITDA in Appendix.
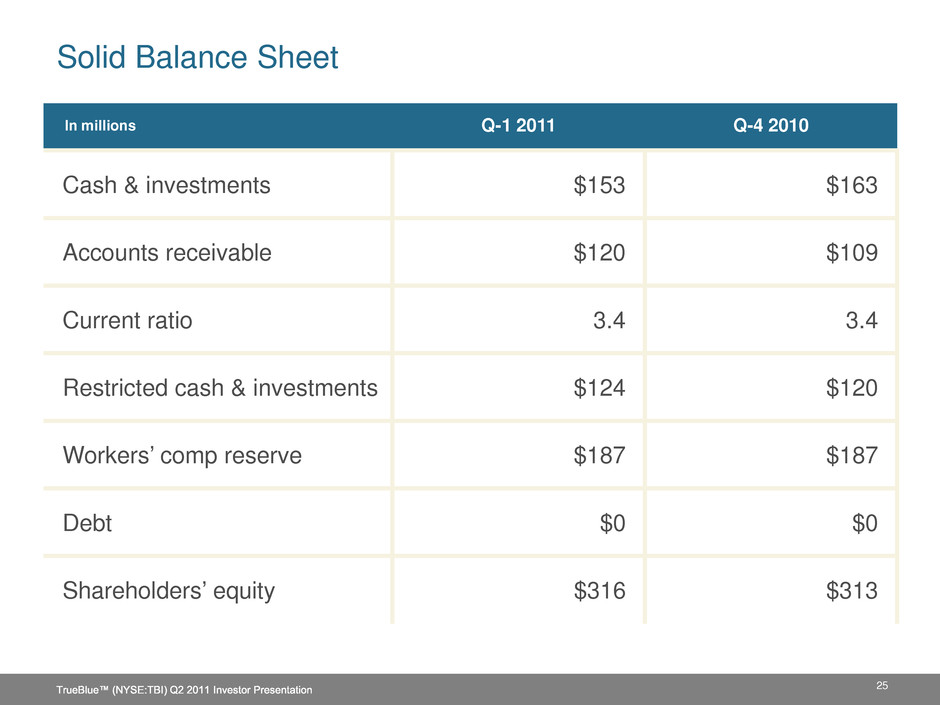
25 Solid Balance Sheet In millions Q-1 2011 Q-4 2010 Cash & investments $153 $163 Accounts receivable $120 $109 Current ratio 3.4 3.4 Restricted cash & investments $124 $120 Workers’ comp reserve $187 $187 Debt $0 $0 Shareholders’ equity $316 $313

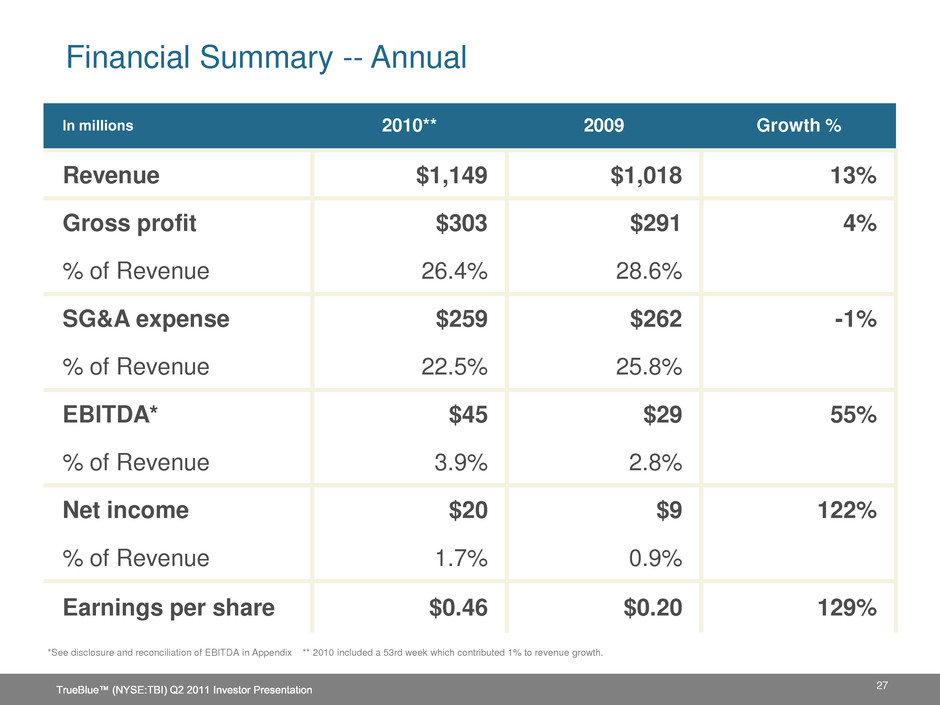
27 Financial Summary -- Annual In millions 2010** 2009 Growth % Revenue $1,149 $1,018 13% Gross profit $303 $291 4% % of Revenue 26.4% 28.6% SG&A expense $259 $262 -1% % of Revenue 22.5% 25.8% EBITDA* $45 $29 55% % of Revenue 3.9% 2.8% Net income $20 $9 122% % of Revenue 1.7% 0.9% Earnings per share $0.46 $0.20 129% *See disclosure and reconciliation of EBITDA in Appendix ** 2010 included a 53rd week which contributed 1% to revenue growth.
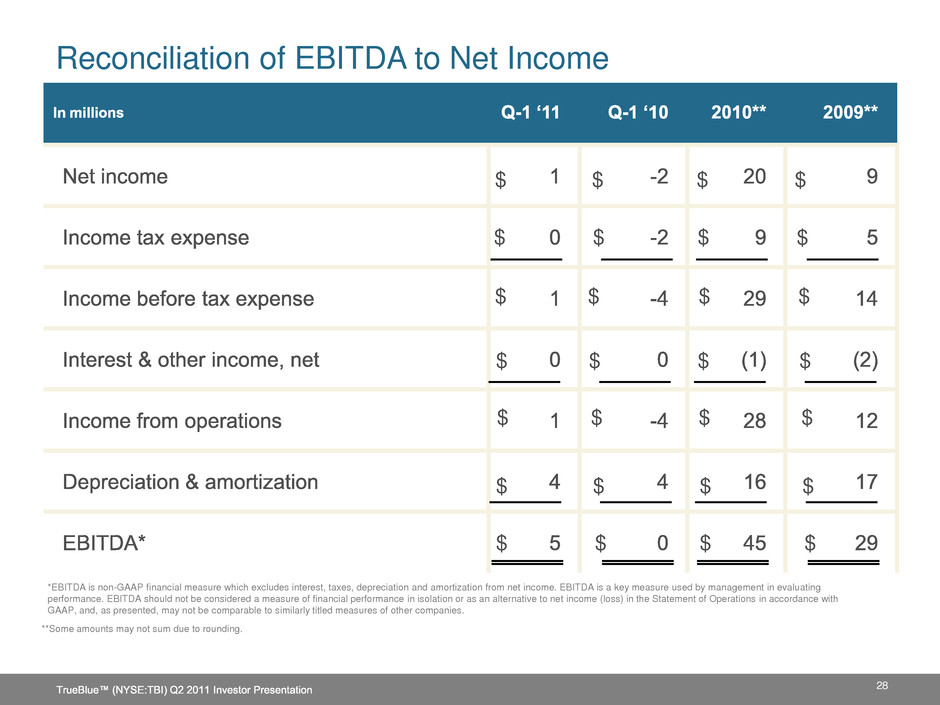
28 Reconciliation of EBITDA to Net Income *EBITDA is non-GAAP financial measure which excludes interest, taxes, depreciation and amortization from net income. EBITDA is a key measure used by management in evaluating performance. EBITDA should not be considered a measure of financial performance in isolation or as an alternative to net income (loss) in the Statement of Operations in accordance with GAAP, and, as presented, may not be comparable to similarly titled measures of other companies. **Some amounts may not sum due to rounding. $ $$ $$$ $ $ $ $ $ $ $ $$ $ $ $ $ $ $ $ $ $ $ $ $ $
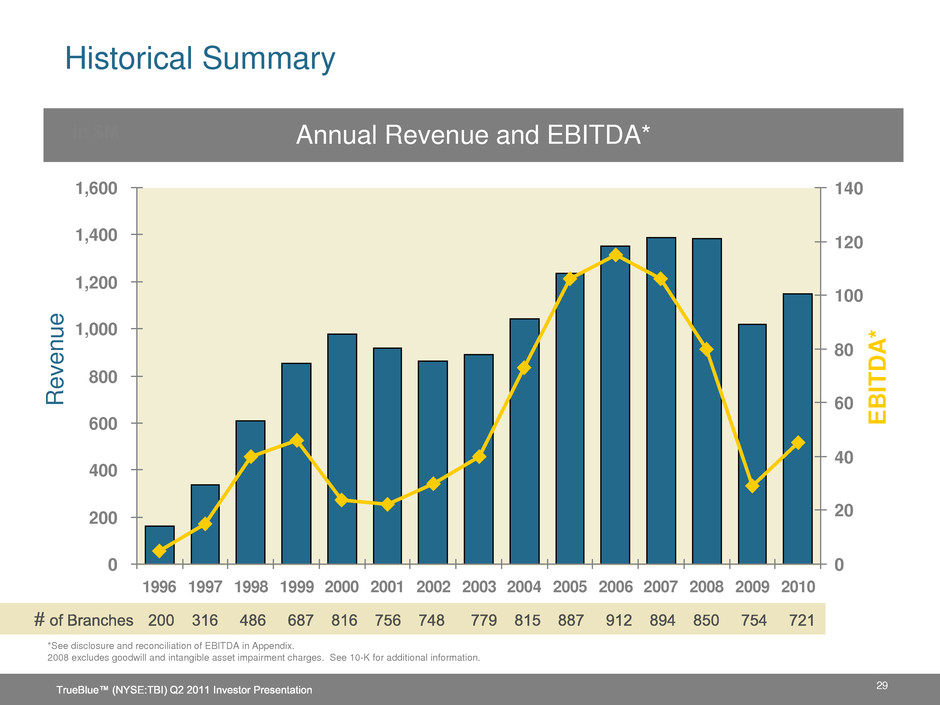
Annual Revenue and EBITDA* 0 200 400 600 800 1,000 1,200 1,400 1,600 1996 1997 1998 1999 2000 2001 2002 2003 2004 2005 2006 2007 2008 2009 2010 0 20 40 60 80 100 120 140 in $M R ev en ue E B IT D A * 29 Historical Summary *See disclosure and reconciliation of EBITDA in Appendix. 2008 excludes goodwill and intangible asset impairment charges. See 10-K for additional information.